Difference in miRNA Expression in Functioning and Silent Corticotroph Pituitary Adenomas Indicates the Role of miRNA in the Regulation of Corticosteroid Receptors

Abstract

Corticotroph pituitary adenomas commonly cause Cushing’s disease (CD), but some of them are clinically silent. The reason why they do not cause endocrinological symptoms remains unclear. We used data from small RNA sequencing in adenomas causing CD (n = 28) and silent ones (n = 20) to explore the role of miRNA in hormone secretion and clinical status of the tumors. By comparing miRNA profiles, we identified 19 miRNAs differentially expressed in clinically functioning and silent corticotroph adenomas. The analysis of their putative target genes indicates a role of miRNAs in regulation of the corticosteroid receptors expression. Adenomas causing CD have higher expression of hsa-miR-124-3p and hsa-miR-135-5p and lower expression of their target genes NR3C1 and NR3C2. The role of hsa-miR-124-3p in the regulation of NR3C1 was further validated in vitro using AtT-20/D16v-F2 cells. The cells transfected with miR-124-3p mimics showed lower levels of glucocorticoid receptor expression than control cells while the interaction between miR-124-3p and NR3C1 3′ UTR was confirmed using luciferase reporter assay. The results indicate a relatively small difference in miRNA expression between clinically functioning and silent corticotroph pituitary adenomas. High expression of hsa-miR-124-3p in adenomas causing CD plays a role in the regulation of glucocorticoid receptor level and probably in reducing the effect of negative feedback mediated by corticosteroids.

1. Introduction

Pituitary adenomas (also referred to as pituitary neuroendocrine tumors, PitNETs) represent about 10–20% of intracranial neoplasms in adults. They may originate from different kinds of secretory pituitary cells including corticotroph ACTH-secreting cells. Corticotroph adenomas commonly cause ACTH-dependent Cushing’s disease, but a significant proportion of these tumors are endocrinologically non-functioning and classified as subclinical/silent corticotroph adenomas (SCAs) [1].
CD-causing ACTH tumors are commonly small microadenomas with approximately 50% being smaller than 5 mm, which is challenging for MRI diagnostics [2]. In contrary, SCAs are commonly diagnosed due to neurological symptoms related to tumor mass at the stage of large macroadenomas. Frequently they show invasive growth and increased proliferation index [1]. According to current recommendations, SCAs are now referred to as “high-risk” pituitary adenomas which refers to their fast and invasive growth, high risk of recurrence and resistance to medical therapy [3,4]. They are recognized to be more aggressive than other clinically nonfunctioning pituitary tumors such as those of gonadotroph origin or null-cell adenomas [5].
The mechanism underlying the difference in secretory activity of CD-causing and subclinical tumors is unclear and only a few studies focused on this issue were published. The results indicated a role of the expression levels of particular genes/proteins involved in the regulation of POMC expression and pro-hormone conversion into ACTH as well as genes involved in pituitary differentiation [6,7,8,9,10,11,12,13]. However, it also appears that both active and silent corticotroph adenomas share a similar overall gene expression profile [14,15].
The aim of this study was to compare the profiles of microRNA (miRNA) expression in clinically functioning and silent corticotroph adenomas and to identify miRNAs that play a role in different ACTH secretory activity.

2. Results

2.1. Patients Characteristics

The study included 28 patients with CD and 20 patients suffering from SCA. All patients with CD had clear clinical signs and symptoms of hypercortisolism verified according to biochemical criteria including elevated midnight cortisol levels and 24 h urinary free cortisol (UFC). Patients with SCA had no clinical or biochemical signs of hypercortisolism and showed normal levels of midnight cortisol and 24 h UFC. Patients with CD had significantly higher morning serum cortisol levels than patients with SCAs (p = 0.0002) while no significant difference was observed in the morning serum ACTH levels. No difference in cortisol/ACTH ratio was observed between CD and SCA patients.
All the adenoma samples were ACTH-positive upon immunohistochemical staining against pituitary hormones (ACTH, GH, TSH, FSH, LH, α-subunit) and had characteristic ultrastructural features of corticotroph adenoma. Forty-one adenomas were positive only for ACTH, while seven ACTH-positive adenomas showed additional moderate/weak immunoreactivity for α-subunit. Increased proliferation assessed by Ki67 index ≥ 3% was observed in a similar proportion of CD and SCA patients, seven tumors causing CD and five SCAs. A higher proportion of sparsely vs. densely granulated adenomas was observed in SCAs than in CD-related adenomas, but the difference did not cross a significance threshold (p = 0.0787). No difference in the proportion of invasive/noninvasive adenomas was observed in clinically functioning and silent corticotroph adenomas.
All SCAs were macroadenomas, while tumors causing CD included 17 macroadenomas and 11 microadenomas. No significant differences in preoperative clinical parameters, including 24 h UFC, morning serum ACTH level, morning and midnight serum cortisol level, cortisol/ACTH ratio, were observed between CD patients with micro- and macroadenomas. Irrespectively, a correlation between tumors size and ACTH level (Spearman R= 0.4678; p = 0.0121) and a negative correlation between cortisol/ACTH ratio (Spearman R= −0.4015; p = 0.0342) was observed in CD patients.
No correlation was found between the remaining biochemical parameters and tumor size. Overall, the patients’ characteristics are presented in Table 1, while details including both the clinical and histopathological data are shown in Supplementary Table S1.
Table 1. Summary of clinical features of patients with Cushing’s disease and silent corticotroph adenomas.
Table

2.2. Identification of miRNAs Differentially Expressed in Corticotroph Adenomas Causing CD and Subclinical Cortiotroph Adenomas

NGS data on miRNA expression of 48 corticotroph adenomas from previous investigation were used to compare miRNA expression levels between adenomas causing CD (n = 24) and subclinical corticotroph adenomas (n = 20). Sequencing of small RNA libraries produced approximately 2,497,367 reads per sample, which were mapped to the human genome (hg19) and used for quantification of expression levels of known miRNAs, according to miRBase 22 release. Sequencing reads were annotated to 1917 miRNAs. Measurements of 1902 mature miRNAs expression were included in the analysis, after filtering out the miRNAs with low expression.
When miRNA profiles of adenomas causing CD and SCAs were compared, a total of 19 differentially expressed miRNAs were found that met the criteria of adjusted p-value < 0.05. This set included 16 miRNAs with higher expression in tumors causing CD: hsa-miR-129-2-3p, hsa-miR-129-5p, hsa-miR-124-3p, hsa-miR-132-5p, hsa-miR-129-1-3p, hsa-miR-135b-5p, hsa-miR-27a-3p, hsa-miR-10b-5p, hsa-miR-9-3p, hsa-miR-6506-3p, hsa-miR-6864-5p, hsa-let-7b-5p, hsa-miR-670-3p, hsa-miR-22-5p, hsa-miR-346 and hsa-miR-9-5p, Three miRNAs with lower expression in CD patients were found: hsa-miR-1909-3p, hsa-miR-4319 and hsa-miR-181b-3p. Details are presented in Table 2 and Figure 1A,B.
Ijms 23 02867 g001 550
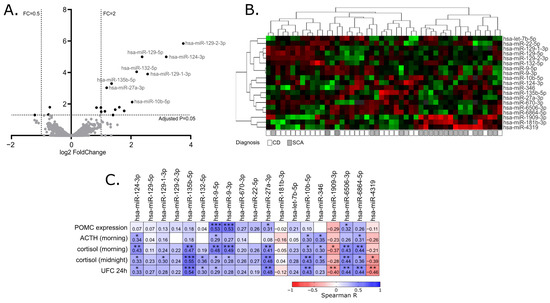
Figure 1. MiRNA expression profiling in corticotroph adenomas. (A). Difference in miRNA expression between functioning and silent corticotroph adenomas. Volcano plot showing differentially expressed miRNAs. Significance and fold change thresholds are marked with dashed lines. (B). Heat map representing the expression of differentially expressed miRNAs and clustering the samples of adenomas causing Cushing’s disease (CD) and silent corticotroph adenomas (SCA). (C). The correlation between the expression levels of differentially expressed miRNAs and POMC expression or hormonal laboratory measurements in patients: morning plasma ACTH level, morning and midnight plasma cortisol levels and 24 h urinary free cortisol; * indicate p-value < 0.05; ** indicate p-value < 0.01; *** indicate p-value < 0.001
Table 2. The list of miRNAs differentially expressed in corticotroph pituitary adenomas causing CD and silent corticotroph adenomas.
Table

2.3. The Correlation of miRNA Expression and Patients’ Clinical Data

Since the clustering of the tumors based on the expression of differentially expressed miRNAs did not clearly separate functioning and silent adenomas, we determined whether the expression of the identified differentially expressed miRNAs is directly related to the results of patients’ laboratory tests as well as POMC expression, measured in tumor samples with qRT-PCR. For this purpose, Spearman’s correlation was applied to calculate a correlation matrix. We observed a significant positive correlation between 13 miRNAs out of 19 differentially expressed miRNAs and at least one of clinical laboratory parameters: serum ACTH, morning cortisol level, midnight cortisol level or 24 h UFC. For 11 miRNAs, with higher expression in patients with CD a positive correlation was observed, while a negative correlation was observed for 3 miRNAs that have lower expression in patients with CD. Four of the differentially expressed miRNAs, hsa-miR-9-3p, hsa-miR-9-5p, hsa-miR-27a-3p and hsa-miR-6506-3p, are correlated with POMC expression level in tumor tissue. The absolute value of correlation coefficient ranged between 0.31 and 0.55 which indicates a weak/moderate relationship. Details are presented in Figure 1C.

2.4. Funtional Enrichment Analysis of Differentially Expressed miRNAs

To investigate the possible functional role of the identified miRNAs with different expression levels in CD tumors and SCAs, we used the information on experimentally validated miRNA targets gathered in the miRtarbase release 8.0 database. High confidence known miRNA targets that were validated with luciferase reporter assay, reported in miRtarbase, were included in the analysis. The enrichment of the genes reported as miRNA targets of our 19 miRNAs of interest was determined with gene set over-representation analysis (GSOA) based on Gene Ontology (GO) Molecular Function and GO Biological Processes. The list of all the genes reported in miRTarbase as validated with reporter gene assay was used as reference. As a result, we found 30 GO Molecular Function terms and 293 GO Biological Processes terms as significantly enriched with genes that are targets of the 19 differentially expressed miRNAs. Top 10 enriched terms were related mainly to steroid hormone activity, regulation of transcription and regulation of stem cell differentiation, as shown in Figure 2. Details are presented in Supplementary Table S2. We paid special attention to the terms that refer to steroid hormone action, i.e., steroid hormone receptor activity (GO:0003707), nuclear receptor activity (GO:0004879), ligand-activated transcription factor activity (GO:0098531), as well as steroid hormone-mediated signaling pathway (GO:0043401) and hormone-mediated signaling pathway (GO:0009755). Importantly, the miRNA target genes that were overrepresented in these terms included NR3C1 and NR3C2 that encode for adrenal hormones glucocorticoid receptor (GR) and mineralocorticoid receptor (MR), respectively. According to the miRtarbase 9.0 database, hsa-miR-124-3p is a negative regulator of NR3C1 gene [16] while both hsa-miR-124-3p and hsa-miR-135b-5p downregulate MR [17].
Ijms 23 02867 g002 550
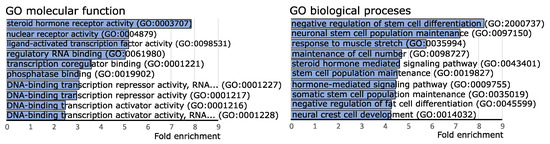
Figure 2. Gene set over-representation analysis of putative target genes of miRNAs differentially expressed in clinically functioning and silent corticotroph adenomas.
Using the PubMed search, we found additional evidence strongly supporting the role of hsa-miR-124-3p in the regulation of NR3C1 [18,19,20,21] as well as the role of hsa-miR-135b-5p in downregulating NR3C2 [22,23].

2.5. Comparison of the Expression of NR3C1 and NR3C2 in Corticotroph Adenomas Causing CD and Silent Adenomas

We determined the expression levels of NR3C1 and NR3C2 in corticotroph adenomas with qRT-PCR. We observed a significantly lower expression of both genes in samples from CD patients (n = 24) as compared to SCAs (n = 24); fold change (FC) 0.49 p = 0.0166 and FC 0.37 p = 0.0132, for NR3C1 and NR3C2, respectively. However, the observed difference is rather slight and a notable dispersion of the results was observed (Figure 3). The differences in NR3C1 and NR3C2 expression correspond to the differences in hsa-miR-124-3p and hsa-miR-135b-5p levels. Patients with CD have higher levels of both miRNAs and lower levels of NR3C1 and NR3C2 mRNA (Figure 3). Unfortunately, we did not find a direct correlation between the expression levels of hsa-miR-124-3p and NR3C1 or hsa-miR-135b-5p and NR3C2.
Ijms 23 02867 g003 550
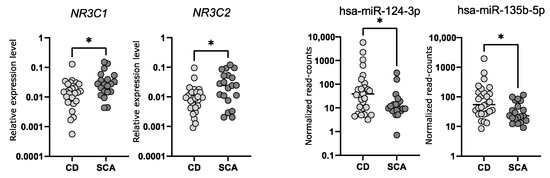
Figure 3. The expression levels of NR3C1 and NR3C2 measured with qRT-PCR as well as hsa-miR-124-3p and hsa-miR-135b-5p measured with small RNA sequencing in tumor samples from CD patients and silent corticotroph adenomas; * indicate p-value < 0.05

2.6. Investigtion of miRNA-Related Regulation of NR3C1 In Vitro

Transfecting the cultured cells with miRNA mimics is the commonly used approach of in vitro validation of specific miRNA–mRNA interaction. We used mice corticotroph tumor AtT-20/D16v-F2 cells for in vitro experiment and initially verified whether these cells do express Nr3c1 and Nr3c2 genes using deposited RNAseq data from a previous experiment on AtT-20 cells (GSE132324; Gene Expression Omnibus) and qRT-PCR. This showed that the AtT-20/D16v-F2 have relatively high expression of Nr3c1 but do not express Nr3c2. Thus, we focused on the regulatory role of miR-124-3p on Nr3c1 expression. We used miRBase [24] and Targetscan [25] to determine whether miR-124-3p is evolutionarily conserved in humans and mice and whether it targets NR3C1 in both species. It confirmed that miR-124-3p is broadly conserved and it shares the same sequence of mature miRNA in humans and mice. Importantly, GR is among highly rated miR-124-3p predicted targets in both humans and mice and two highly conserved miR-124-3p binding motifs in 3′UTR of this gene were identified in these two species (Figure 4A).
Ijms 23 02867 g004 550
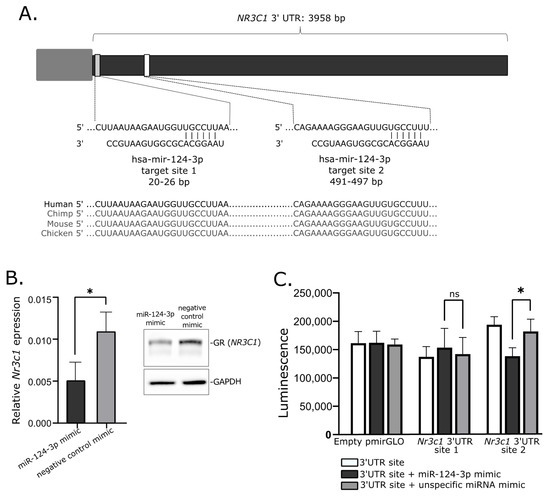
Figure 4. Role of mir-124-3p in regulation of glucocorticoid receptor gene. (A). Putative hsa-mir-124-3p target sites in 3′UTR of NR3C1. (B). Reduced expression of Nr3c1 gene expression and glucocorticoid receptor (GR) protein level in AtT-20/D16v-F2 cells treated with hsa-miR-124-3p mimics. (C). Results of luciferase reporter gene assay, showing the interaction between Nr3c1 3′UTR site 2 and mir-124-3p; * indicate p-value < 0.05; ns—not significant.
When we transfected AtT-20/D16v-F2 cells with miR-124-3p miRNA mimic and unspecific negative control miRNA mimic, we observed a significant decrease in Nr3c1 expression in cells treated with miR-124-3p miRNA mimic (Figure 4B). It was significantly lower than in cells treated with unspecific miRNA mimic. This difference was also clearly visible at the protein level. The GR level was reduced in cells treated with miR-124-3p miRNA mimic as compared to control (Figure 4B).
Two fragments of Nr3c1 3′UTR including each of putative miR-124-3p binding motifs were cloned in plasmid vector into 3′ region of the firefly luciferase gene. AtT-20/D16v-F2 cells were transfected with empty vector, vector with miR-124-3p binding site 1 and vector miR-124-3p binding site 2. Each of the three variants of the cells were cotransfected with miR-124-3p miRNA mimic or unspecific miRNA mimic that served as a negative control. Luminescence was developed 48 h after transfection and detected with microplate reader. As a result, we observed a significant decrease in luminescence in the cells with introduced plasmid with miR-124-3p binding site 2 treated with miR-124-3p mimic as compared to the cells transfected with the same plasmid construct but with control miRNA mimic. This observation confirms the interaction between miR-124-3p and 3′ UTR of Nr3c1 at putative binding site 2 (Figure 4C). The experiment did not confirm an interaction between miR-124-3p and 3′ UTR of Nr3c1 at binding site 1 since no significant difference of luminescence was found in cells transfected with plasmid vector harboring this binding motif treated with miR-124-3p mimic and the same cells treated with negative miRNA mimic (Figure 4C).

3. Discussion

Based on the clinical manifestation and biochemical tests results, pituitary corticotroph adenomas can be divided into functioning adenomas causing Cushing’s disease and SCAs. These two subtypes of tumors also differ in terms of some characteristics in MRI [2,26] and pathological features [27]. In contrast to CD-causing adenomas which are commonly small microadenomas, SCAs are diagnosed as macroadenomas due to neurological symptoms related to tumor mass. They are characterized by invasive growth, high risk of recurrence and resistance to medical therapy and are therefore referred to as “high-risk” pituitary adenomas according to current classification [3,4]. In our study, the SCAs were larger than functioning counterparts, as expected. A clear prevalence of women is observed among CD patients according to literature data [28], while it is not observed in patients suffering from SCAs. Our SCA group contained near equal representation of women and men as in previous reports [29,30]; however, some studies indicated female prevalence in SCAs [31].
Comparing functioning and silent corticotroph adenomas, we did not observe difference in patients’ age as well as differences in invasive growth status, ratio of adenomas with increased proliferation index and proportions of sparsely and densely granulated adenomas that may suggest the lack of difference in the tumors’ “aggressiveness”. Importantly, limitations for generalization of our results should be noted. The number of patients included in the analysis is relatively low and the group is not representative of the general population, especially in the case of patients suffering from Cushing’s disease. Since the main goal of our study was a molecular profiling of tumor tissue, we intentionally preselected large adenomas, which allowed us to have enough tissue for DNA/RNA isolation and successful molecular procedures.
In our investigation, we observed a negative correlation between cortisol/ACTH ratio and tumor volume in functioning corticotroph adenomas as described previously [32]. However, we did not observe any difference between micro- and macroadenomas causing CD as compared to SCAs (data not shown) as was found in previous studies [12].
The reason why some of corticotroph adenomas exhibit excessive hormone secretion and the others remain clinically silent is unclear and only few attempts have been made to determine the possible molecular mechanism underlying this difference in secretory activity. They were mainly focused on investigating the expression of the selected genes or proteins by comparing subclinical and functioning corticotroph adenomas. These studies indicated different expression levels of prohormone convertase 1/3 POMC, genes encoding somatostatin receptors, corticotropin releasing hormone receptor 1, vasopressin receptor (V1BR), corticosteroid 11-beta-dehydrogenase as well as NEUROD1 and TPIT [6,7,8,9,10,11,12,13]. However, whole transcriptome studies indicated that adenomas causing CD and subclinical corticotroph adenomas share a very common gene expression profile and a very low number of differentially expressed genes can be found by comparing transcriptome of silent and CD-causing ACTH tumors [14,15].
In our study, we determined the miRNA expression profile of 28 clinically functioning adenomas and 20 SCAs with next-generation sequencing of small RNA fraction. This allowed for the quantification of over 1900 miRNA annotated to current version of miRbase database and comparing their expression in two groups of tumor samples. We found a significant difference only in the expression levels of 19 miRNAs, that represent less than 1% of the miRNAs included in the analysis. This result resembles the observation from previous comparison of whole transcriptome profiles in functioning adenomas and SCAs where only 34 differentially expressed genes were found. Generally, both observations indicate a very common molecular profile of corticotroph adenomas, regardless of the functional status.
In our study, the expression levels of 13 out of 19 identified differentially expressed miRNAs were also correlated with peripheral ACTH/cortisol levels, further supporting the role of these miRNAs in secretory activity of corticotroph adenomas.
The possible role of miRNA in subclinical nature of SCAs was addressed in only one previous study by García-Martínez A et al. [33]. The authors compared the expression of 5 miRNAs in 24 functioning and 23 silent adenomas and observed a difference in hsa-miR-200a and hsa-miR-103 levels [33]. Their results were not confirmed by our investigation since these two miRNAs were not found among differentially expressed miRNAs. In our data, very a similar expression level of hsa-miR-200a was observed in clinically functioning and silent adenomas. In turn, a slightly higher expression of hsa-miR-103a-3p was observed in SCAs as previously reported, but the difference did not cross the significance threshold level. We should note that different methods were used for these two studies and technical and analytical differences could result in this discrepancy.
Since miRNAs play a role in gene regulation, their effect should be investigated in the context of the function of targeted genes. The interaction between miRNA and its target mRNA 3′UTR can be predicted with in silico tools. Unfortunately, prediction results can be very difficult to interpret since a huge number of predicted interactions can be found for some miRNAs. For example, when using the Targetescan (http://www.targetscan.org; accessed on 28 February 2022) prediction tool [25], over 4000 target genes were predicted for each hsa-miR-9-3p, hsa-miR-1909-3p, hsa-miR-22-5p and hsa-miR-181b-3p that we found as differentially expressed in CD and SCA. Therefore, to investigate a possible functional relevance of differentially expressed miRNAs we used a database of experimentally validated miRNA targets [34]. Gene set over-representation analysis of miRNA target genes indicated their enrichment in the pathways of steroid hormone nuclear receptors functioning. This result indicates that miRNAs that have different expression levels in CD and SCAs play a role in the regulation of expression of genes involved in steroid hormone signaling at hormone receptor level. It is especially interesting since this group of compounds includes adrenal hormones that play a role in the regulation of the hypothalamic–pituitary–adrenal (HPA) axis.
The particular enriched miRNA target genes included NR3C1 and NR3C2 that encode for corticosteroid hormone receptors (GR and MR, respectively). Both receptors are located in the cytoplasm where they bind glucocorticoids. Upon ligand binding, they are translocated to nucleus where they form dimers on DNA at glucocorticoid response elements (GREs). Glucocorticoid and mineralocorticoid receptors directly regulate the expression of target genes and/or influence the expression indirectly through the interaction with other transcription factors [35].
Glucocorticoids play a role in the basic mechanism of negative feedback of HPA axis. They act on hypothalamus, where high cortisol levels reduce secretion of corticotropin-releasing hormone (CRH), thus they directly reduce stimulation of ACTH secretion by anterior pituitary lobe. Glucocorticoids also inhibit the activity of pituitary cells indirectly. Corticotroph cells express GRs and their activation results in the reduction of POMC expression and secretion of ACTH [36,37]. In pituitary corticotroph adenomas, NR3C1 point mutations and loss of heterozygosity in NR3C1 locus were identified [38]. These mutations seem to affect the secretory activity and result in tumor resistance to corticosteroids [39]. Reduced expression of corticosteroid receptors in corticotroph adenomas has been reported in patients with resistance to high doses of dexamethasone [40]. These data indicate a role of GR in secretory activity of clinically functioning corticotroph adenomas. The expression of corticosteroid genes was previously investigated in CD-causing tumors and SCAs and no significant differences were found. However, it is worth noting that a low number of SCA patients was included in these studies: n = 9 [13], n = 8 [11] and n = 2 [41].
According to previously published results, hsa-miR-124-3p is a negative regulator of NR3C1 [16,18,19,20,21]. This was observed in acute lymphoblastic leukemia [19], adipocytes [20] and human embryonic kidney cells [21], where the reduced expression of NR3C1 upon an increase in hsa-miR-124-3p as well as a direct interaction between this miRNA and 3′UTR of GR gene were observed. Some additional clinical observations also suggest the role of hsa-miR-124-3p in the regulation of the response to cortiosteroids in patients with acute-on-chronic liver failure [18] and lymphoblastic leukemia [19]. Hsa-miRNA-124 also mediates corticosteroid resistance in T-cells of sepsis patients through the downregulation of GR [42].
Our analysis of the expression level of NR3C1 in corticotroph adenomas showed that tumors causing CD have lower gene expression and accordingly they exhibit higher levels of hsa-miR-124-3p. Subsequently, the role of hsa-miR-124-3p in NR3C1 downregulation was confirmed in mice AtT-20/D16v-F2 corticotroph cells using miRNA mimics and reporter gene assay. Transfection of AtT-20/D16v-F2 cells with hsa-miR-124-3p mimics resulted in reduced NR3C1 mRNA expression and GR protein level. We also confirmed the interaction between hsa-miR-124-3p and one of two predicted binding motifs in 3′UTR of NR3C1 with luciferase reporter gene assay. Since sequences of hsa-miR-124-3p and target sequence in 3′UTR of NR3C1 mRNA are the same in mice and in humans, we believe that results showing the regulation of the GR-encoding gene in mice AtT-20/D16v-F2 cells are also relevant to humans. Together, the available data indicate that in pituitary corticotrophs, hsa-miR-124-3p downregulates the expression of the GR gene. Since this receptor mediates the response of pituitary cells to cortisol, the expression of hsa-miR-124-3p appears to be an important element in the regulation of secretory activity of corticotroph cells. Based on these results, we can hypothesize that in CD, a high level of hsa-miR-124-3p contributes to lowering of GR expression and in consequence it plays a role in lowering the effect of glucocorticoid feedback on the activity of corticotroph adenoma. Hsa-miR-124-3p and hsa-miR-135b-5p can downregulate the expression level of MR, as proven in model HeLa cells [17]. Expression of both miRNAs is higher in corticotroph adenomas causing CD which corresponds to the lower expression of the NR3C2 gene in these tumors as compared to SCAs. Since the role of the MR receptor expression in pituitary cells is poorly understood, the functional implication of this observation is much less clear than in the case of GR downregulation. MR and GR have similar amino acid sequences, especially in DNA-binding domain, but they differ in affinity to corticosteroids. MR is specific for both mineralocorticoids and glucocorticoids while GR is specific predominantly for glucocorticoids. MRs have much higher affinity for glucocorticoids than GRs and are activated at basal glucocorticoid conditions, while GR occupancy is increased when glucocorticoid levels rise during the circadian peak or stress. Due to these differences, these two receptors play slightly different roles, despite the fact that they share a number of target genes [43]. MR expression is considered more tissue-specific than GR and was reported to be the most prevalent in kidney and adipose tissue but also in the hippocampus and hypothalamus [44]. However, the available databases of human expression pattern such as the Genotype-Tissue Expression project (https://gtexportal.org; accessed on 10 December 2021) or Protein atlas (https://www.proteinatlas.org; accessed on 10 December 2021) indicate that MR is widely expressed in multiple human tissues and organs including the pituitary gland. Unfortunately, a role of MR receptor in pathogenesis of pituitary tumors remains unknown.
AtT-20 cells, which are the only available cell line model of corticotroph adenoma, do not express MR receptor, thus the procedure of experimental validation of the role of miRNA in NR3C2 silencing is not applicable. With a lack of experimental data on the exact role of MR, we can only hypothesize that miRNA-mediated silencing of NR3C2 may have the similar effect on HPA axis feedback as silencing of NR3C1. It may enhance ACTH secretion by reducing the direct inhibitory effect of glucocorticoids on neoplastic pituitary corticotrophs.
The difference in expression of hsa-miR-124-3p and hsa-miR-135b-5p between subclinical and CD-causing adenomas is not big, thus we suppose that high expression of these miRNAs is not the only cause of difference in ACTH secretion. Presumably this is one of the mechanisms in the regulation of corticotrophs’ secretory activity. The model of miRNA-based corticosteroid receptor regulation does not undermine the role of previously described differences in the expression of convertase 1/3, POMC, somatostatin receptors or corticotropin releasing hormone receptor 1 or genes involved in differentiation of pituitary cells [6,7,8,9,10,11,12,13]. When considering the complex nature of the regulation of ACTH secretion, it can be assumed that multiple mechanisms may be involved in the silent character of subclinical adenomas. The low number of identified differentially expressed miRNAs or genes in silent and clinically functioning adenomas probably results from the intertumoral molecular heterogeneity of SCAs. This is also in line with clinical evidence indicating that some silent corticotroph adenomas can transform into clinically functioning ones while the others remain silent [1].
The misregulation of GR expression or NR3C1 mutation may have important therapeutical implications in CD patients. Non-selective GR antagonist Mifepristone was officially approved for treatment in patients with Cushing’s syndrome [45] while another new GR inhibitor, Relacorilant (CORT125134), is under clinical investigation for its use in this group of patients [46]. The further studies will be required to assess the role of GR abnormalities in response to GR-targeting treatment in CD.
In our study, we focused mainly on the role of hsa-miR-124-3p and hsa-miR-135b-5p in the regulation of corticosteroid receptors, but the role of other differentially expressed miRNAs can also be elucidated, based on the function of putative target genes. In the pathways enrichment analysis of the putative targets, molecular functions related to transcriptional regulation were found among the top processes. Interestingly, five miRNAs, i.e., hsa-miR-132-5p, hsa-miR-135b-5p, hsa-miR-27a-3p, hsa-miR-9-3p and hsa-miR-9-5p, were previously reported to downregulate the expression of FOXO1 transcription factor [47,48,49,50,51]. FOXO1 plays an important role in the differentiation of pituitary cells [52] and secretion of gonadotropic hormones [53,54] and prolactin [55]. The role of FOXO1 in pituitary corticotroph cells was not investigated but it was shown to regulate POMC expression in POMC hypothalamic neurons [56]. In POMC, neurons of arcuate nucleus FOXO1 directly suppresses POMC expression. A similar mechanism was also observed in prolactin pituitary adenomas where FOXO1 suppresses the promoter of PRL gene [55]. It is possible that high expression of hsa-miR-132-5p, hsa-miR-135b-5p, hsa-miR-27a-3p, hsa-miR-9-3p and hsa-miR-9-5p in pituitary corticotroph adenomas reduces the level of FOXO1 and eventually contributes to the upregulation of POMC expression. In our data from corticotroph adenomas, we observed the correlation between levels of hsa-miR-9-3p/hsa-miR-9-5 and POMC expression, which also supports this concept, but the exact role of miRNAs in possible FOXO1-related regulation of secretory activity of corticotroph cells requires further functional investigation.

4. Materials and Methods

4.1. Patients and Tissue Samples

Pituitary tumor samples from 48 patients were collected during transsphenoidal surgery. Formalin-fixed and paraffin-embedded (FFPE) tissue samples, including 28 samples from patients with Cushing’s disease and 20 samples of SCA were used for the study. Diagnosis of hypercortisolism was based on standard hormonal criteria: increased UFC in three 24 h urine collections, disturbances of cortisol circadian rhythm, increased serum cortisol levels accompanied by increased or not suppressed plasma ACTH levels at 8.00 and a lack of suppression of serum cortisol levels to <1.8 µg/dL during an overnight dexamethasone suppression test (1 mg at midnight). The pituitary etiology of Cushing’s disease was confirmed based on the serum cortisol levels or UFC suppression < 50% with a high-dose dexamethasone suppression test (2 mg q.i.d. for 48 h) or a positive result of a corticotrophin-releasing hormone stimulation test (100 mg i.v.) and positive pituitary magnetic resonance imaging.
ACTH levels were assessed using IRMA (ELSA-ACTH, CIS Bio International, Gif-sur-Yvette Cedex, France). The analytical sensitivity was 2 pg/mL (reference range: 10–60 pg/mL). Serum cortisol concentrations were determined by the Elecsys 2010 electrochemiluminescence immunoassay (Roche Diagnostics, Mannheim, Germany). Sensitivity of the assay was 0.02 μg/dL (reference range: 6.2–19.4 μg/dL). UFC was determined after extraction (liquid/liquid with dichloromethane) by electrochemiluminescence immunoassay (Elecsys 2010, Roche Diagnostics)—reference range: 4.3–176 μg/24 h.
All the tumors underwent detailed histopathological diagnosis including immunohistochemical staining with antibodies against particular pituitary hormones (ACTH, GH, TSH, FSH, LH, α-subunit) and Ki67 as well as ultrastructural analysis with electron microscopy.
The SCAs were characterized by the following clinicopathological criteria: positive immunohistochemical staining for ACTH, lack of signs and symptoms of hypercortisolism (Cushing’s syndrome), negative hormonal evaluation and non-compliance with diagnostic criteria of the CD.
Macroadenoma was defined as an adenoma with at least one diameter exceeding 10 mm, and the tumor volume was assessed with the diChiro Nelson formula (height × length × width × π/6). Invasive growth of the tumors was evaluated using Knosp grading [57]. Adenomas with Knosp grades 0, 1 and 2 were considered non-invasive, while those with Knosp 3 and 4 were considered invasive.
Forty-three patients had a clear history of not using any drugs that control the overproduction of the cortisol or ACTH (ketoconazole, mitotane, metyrapone, osilodrostat, mifepristone, pasireotide) before surgical treatment. The information on preoperative pharmacological treatment was not available for 5 patients.
Tumor tissue content of each FFPE sample ranged between 80 and 100% (median 99%), as assessed with histopathological examination. Patients’ characteristics are presented in Table 1 and details on each patient’s data are available in Supplementary Table S1.
The study was approved by the local Ethics Committee of Maria Sklodowska-Curie National Research Institute of Oncology in Warsaw, Poland. Each patient provided informed consent for the use of tissue samples for scientific purposes.
Total RNA from FFPE samples was purified with RecoverAll™ Total Nucleic Acid Isolation Kit for FFPE tissue (Thermo Fisher Scientific, Waltham, MA, USA) and measured using NanoDrop 2000 (Thermo Fisher Scientific). RNA was stored at −70 °C.

4.2. Micro RNA Expression Profiling

For comparing the miRNA expression profiles in CD-causing and clinically silent adenomas, NGS data from our previous investigation of miRNA expression in corticotroph adenomas were used. The dataset is available at Gene Expression Omnibus, accession no GSE166279. Sequencing of small RNA fraction was performed in 48 tumor samples (28 CD patients and 20 SCA patients) with ion semiconductor sequencing technology, as described previously [58]. Briefly, Ion Total RNA-Seq Kit v2 (Thermo Fisher Scientific) was used for sequencing library construction, Ion Xpress™ RNA-Seq Barcode Kit was used for hybridization and ligation of RNA adapters. RNA reverse transcription and subsequent cDNA purification and library size selection were performed using Nucleic Acid Binding Beads and verified using Bioanalyzer 2100 with High Sensitivity DNA Kit (Agilent, Santa Clara, CA, USA). Ion Chef instrument, with Ion PI™ Hi-Q™ Chef Kit (Thermo Fisher Scientific) and Ion Proton sequencer (Thermo Fisher Scientific) were used for library preparation and sequencing, respectively.
BamToFastq package was applied for converting unmapped bam files into fastq files. miRDeep2 was applied for read mapping to known human miRNAs (according to miRBase release 22) and reads quantification. Data normalization and differential expression analysis were performed using DESeq2. Filtration for low-expression miRNAs was applied as described previously. FC of expression calculated as the ratio of the normalized read-count value in CD-causing and silent adenomas was used as a measure of expression difference. Adjusted p-value < 0.05 was used as significance threshold. MiRtarbase release 9.0 database [34] was used to identify known miRNA target genes. PANTHER (http://pantherdb.org; accessed on 10 December 2021) [59] was used for gene set over-representation analysis.

4.3. qRT-PCR gene Expression Analysis

One microgram of RNA was subjected to reverse transcription with Transcriptor First Strand cDNA Synthesis Kit (Roche Diagnostics). qRT-PCR reaction was carried out in 384-well format using 7900HT Fast Real-Time PCR System (Applied Biosystems, Foster City, CA, USA) and Power SYBR Green PCR Master Mix (Thermo Fisher Scientific) in a volume of 5 μL, containing 2.25 pmol of each primer. The samples were amplified in triplicates. GAPDH was used as reference gene. Delta Ct method was used to calculate the relative expression level. PCR primers’ sequences are presented in Supplementary Table S3.

4.4. Cell Line Culture and miRNA Mimic Transfection

AtT-20/D16v-F2 cells were purchased from ATCC collection and cultured in DMEM medium supplemented with 10% FBS, as recommended. MiRCURY LNA miRNA Mimics including hsa-miR-124-3p mimic (YM00471256, Qiagen, Hilden, Germany) and negative control mimic (YM00479902-ADB, Qiagen) were used. AtT-20/D16v-F2 cells were seeded at 5 × 10⁴ per well of a 24-well plate in culture medium and transfected with 50 nM miRNA with 1% (v/v) HiPerFect Transfection Reagent (Qiagen), according to the manufacturer’s instructions. The next day, the culture medium was changed. In total, 48 h after transfection the cells were harvested and subjected to isolation of total RNA with RNeasy Mini Kit (Qiagen). The expression of the putative hsa-miR-124-3p target gene was determined with qRT-PCR.

4.5. Luciferase Reporter Gene Assay

Hsa-miR-124-3p target sites in 3′UTR of NR3C1 were determined with Targetscan [25]. Each of two predicted hsa-miR-124-3p target sites were cloned into pmirGLO Dual-Luciferase miRNA Target Expression Vector (Promega, Madison, WI, USA). AtT-20/D16v-F2 cells (2 × 10⁴/well) were seeded onto a 96-well plate in 100 µL culture medium. The next day, the cells were transfected with 100 ng of each plasmid vector, independently using 0.25% (v/v) lipofectamine 3000 (Invitrogen, Carlsbad, CA, USA) in 10 µL of DMEM. The cells were subsequently transfected with either hsa-miR-124-3p mimic (YM00471256, Qiagen) or negative control mimic (YM00479902-ADB, Qiagen) in a final concentration of 50 nM using HiPerfectReagent (Qiagen). Culture medium was changed on the next day. Luciferase activity was measured with One-Glo Luciferase Assay System (Promega) 48 h after transfection.

4.6. Western Blotting

Cells were lysed in ice cold RIPA buffer, incubated for 30 min in 4 °C and centrifuged at 12,500× g rpm for 20 min at 4 °C. Samples were resolved using SDS-PAGE and electrotransferred to polyvinylidene fluoride membranes (PVDF) (Thermo Fisher). GR protein was detected with monoclonal anti-Glucocorticoid Receptor antibody (ab183127, Abcam, Cambridge, UK), and secondary anti-rabbit antibody conjugated to HRP (#7074, Cell Signaling, Beverly, MA, USA). Glyceraldehyde-3-Phosphate Dehydrogenase (#MAB374, Millipore, Bedford, MA, USA) detected with mouse HRP-conjugated antibody (#7076 Cell Signaling) served as control. Visualization was performed with SuperSignal West Pico Chemiluminescent Substrate (Thermo Fisher Scientific) and CCD digital imaging system Alliance Mini HD4 (UVItec Limited, Cambridge, UK).

4.7. Statistical Analysis

A two-sided Mann–Whitney U-test was used for analysis of continuous variables. The Spearman correlation method was used for correlation analysis. Significance threshold of α = 0.05 was adopted. Data were analyzed using GraphPad Prism 6.07 (GraphPad Software, La Jolla, CA, USA). Hierarchical clustering analysis was carried out with Cluster 3.0, and the results were visualized using TreeView 1.6 software (Stanford University School of Medicine, Stanford, CA, USA).

Supplementary Materials

The following supporting information can be downloaded at: https://www.mdpi.com/article/10.3390/ijms23052867/s1.

Author Contributions

Conceptualization, M.M. and M.B.; Methodology, M.B. and B.J.M.; Software, J.B.; Formal analysis, P.K., B.J.M. and M.B.; Investigation, B.J.M., P.K., N.R., M.B. and M.P.; Resources, J.K., G.Z., A.S. and T.M.; Data curation, J.B., B.J.M. and M.B.; Writing—original draft preparation, M.B., P.K. and B.J.M.; Writing—review and editing, all the authors; Visualization, M.B. and B.J.M.; Supervision, M.M.; Project administration M.B.; Funding acquisition, M.M. All authors have read and agreed to the published version of the manuscript.

Funding

This research was funded by National Science Centre, Poland, grant number 2021/05/X/NZ5/01874.

Institutional Review Board Statement

The study was conducted in accordance with the Declaration of Helsinki, and approved by the local Ethics Committee of Maria Sklodowska-Curie Institute—Oncology Center in Warsaw, Poland; approval no. number 44/2018, date of approval 26 July 2018.

Informed Consent Statement

Informed consent was obtained from all subjects involved in the study.

Data Availability Statement

Data from next-generation sequencing of small RNA fraction of 48 corticotroph adenoma samples are available at Gene Expression Omnibus, accession no GSE166279.

Conflicts of Interest

The authors declare no conflict of interest.

References

  1. Ben-Shlomo, A.; Cooper, O. Silent Corticotroph Adenomas. Pituitary 2018, 21, 183–193. [Google Scholar] [CrossRef] [PubMed]
  2. Vitale, G.; Tortora, F.; Baldelli, R.; Cocchiara, F.; Paragliola, R.M.; Sbardella, E.; Simeoli, C.; Caranci, F.; Pivonello, R.; Colao, A. Pituitary Magnetic Resonance Imaging in Cushing’s Disease. Endocrine 2017, 55, 691–696. [Google Scholar] [CrossRef] [PubMed]
  3. Kontogeorgos, G.; Thodou, E.; Osamura, R.Y.; Lloyd, R.V. High-Risk Pituitary Adenomas and Strategies for Predicting Response to Treatment. Hormones 2022, 1, 3. [Google Scholar] [CrossRef] [PubMed]
  4. Osamura, R.Y.; Grossman, A.; Korbonits, M.; Kovacs, K.; Lopes, M.B.S.; Matsuno, A.; Trouillas, J. WHO Classification of Tumours of Endocrine Organs, 4th ed.; Lloyd, R.V., Osamura, R.Y., Rosari, J., Eds.; IARC Press: Lyon, France, 2017. [Google Scholar]
  5. Jiang, S.; Chen, X.; Wu, Y.; Wang, R.; Bao, X. An Update on Silent Corticotroph Adenomas: Diagnosis, Mechanisms, Clinical Features, and Management. Cancers 2021, 13, 6134. [Google Scholar] [CrossRef]
  6. Tateno, T.; Kato, M.; Tani, Y.; Oyama, K.; Yamada, S.; Hirata, Y. Differential Expression of Somatostatin and Dopamine Receptor Subtype Genes in Adrenocorticotropin (ACTH)- Secreting Pituitary Tumors and Silent Corticotroph Adenomas. Endocr. J. 2009, 56, 579–584. [Google Scholar] [CrossRef]
  7. Gabalec, F.; Beranek, M.; Netuka, D.; Masopust, V.; Nahlovsky, J.; Cesak, T.; Marek, J.; Cap, J. Dopamine 2 Receptor Expression in Various Pathological Types of Clinically Non-Functioning Pituitary Adenomas. Pituitary 2012, 15, 222–226. [Google Scholar] [CrossRef]
  8. Righi, A.; Faustini-Fustini, M.; Morandi, L.; Monti, V.; Asioli, S.; Mazzatenta, D.; Bacci, A.; Foschini, M.P. The Changing Faces of Corticotroph Cell Adenomas: The Role of Prohormone Convertase 1/3. Endocrine 2017, 56, 286–297. [Google Scholar] [CrossRef]
  9. Ohta, S.; Nishizawa, S.; Oki, Y.; Yokoyama, T.; Namba, H. Significance of Absent Prohormone Convertase 1/3 in Inducing Clinically Silent Corticotroph Pituitary Adenoma of Subtype I—Immunohistochemical Study. Pituitary 2002, 5, 221–223. [Google Scholar] [CrossRef]
  10. Tateno, T.; Izumiyama, H.; Doi, M.; Akashi, T.; Ohno, K.; Hirata, Y. Defective Expression of Prohormone Convertase 1/3 in Silent Corticotroph Adenoma. Endocr. J. 2007, 54, 777–782. [Google Scholar] [CrossRef]
  11. Tateno, T.; Izumiyama, H.; Doi, M.; Yoshimoto, T.; Shichiri, M.; Inoshita, N.; Oyama, K.; Yamada, S.; Hirata, Y. Differential Gene Expression in ACTH -Secreting and Non-Functioning Pituitary Tumors. Eur. J. Endocrinol. 2007, 157, 717–724. [Google Scholar] [CrossRef]
  12. Nagaya, T.; Seo, H.; Kuwayama, A.; Sakurai, T.; Tsukamoto, N.; Nakane, T.; Sugita, K.; Matsui, N. Pro-Opiomelanocortin Gene Expression in Silent Corticotroph-Cell Adenoma and Cushing’s Disease. J. Neurosurg. 1990, 72, 262–267. [Google Scholar] [CrossRef] [PubMed]
  13. Raverot, G.; Wierinckx, A.; Jouanneau, E.; Auger, C.; Borson-Chazot, F.; Lachuer, J.; Pugeat, M.; Trouillas, J. Clinical, Hormonal and Molecular Characterization of Pituitary ACTH Adenomas without (Silent Corticotroph Adenomas) and with Cushing’s Disease. Eur. J. Endocrinol. 2010, 163, 35–43. [Google Scholar] [CrossRef] [PubMed]
  14. Neou, M.; Villa, C.; Armignacco, R.; Jouinot, A.; Raffin-Sanson, M.L.; Septier, A.; Letourneur, F.; Diry, S.; Diedisheim, M.; Izac, B.; et al. Pangenomic Classification of Pituitary Neuroendocrine Tumors. Cancer Cell 2020, 37, 123–134.e5. [Google Scholar] [CrossRef] [PubMed]
  15. Bujko, M.; Kober, P.; Boresowicz, J.; Rusetska, N.; Paziewska, A.; Dabrowska, M.; Piaścik, A.; Pȩkul, M.; Zieliński, G.; Kunicki, J.; et al. USP8 Mutations in Corticotroph Adenomas Determine a Distinct Gene Expression Profile Irrespective of Functional Tumour Status. Eur. J. Endocrinol. 2019, 181, 615–627. [Google Scholar] [CrossRef]
  16. Vreugdenhil, E.; Verissimo, C.S.L.; Mariman, R.; Kamphorst, J.T.; Barbosa, J.S.; Zweers, T.; Champagne, D.L.; Schouten, T.; Meijer, O.C.; De Ron Kloet, E.; et al. MicroRNA 18 and 124a Down-Regulate the Glucocorticoid Receptor: Implications for Glucocorticoid Responsiveness in the Brain. Endocrinology 2009, 150, 2220–2228. [Google Scholar] [CrossRef]
  17. Sõber, S.; Laan, M.; Annilo, T. MicroRNAs MiR-124 and MiR-135a Are Potential Regulators of the Mineralocorticoid Receptor Gene (NR3C2) Expression. Biochem. Biophys. Res. Commun. 2010, 391, 727–732. [Google Scholar] [CrossRef]
  18. Wang, X.; Xu, H.; Wang, Y.; Shen, C.; Ma, L.; Zhao, C. MicroRNA-124a Contributes to Glucocorticoid Resistance in Acute-on-Chronic Liver Failure by Negatively Regulating Glucocorticoid Receptor Alpha. Ann. Hepatol. 2020, 19, 214–221. [Google Scholar] [CrossRef]
  19. Liang, Y.N.; Tang, Y.L.; Ke, Z.Y.; Chen, Y.Q.; Luo, X.Q.; Zhang, H.; Huang, L. Bin MiR-124 Contributes to Glucocorticoid Resistance in Acute Lymphoblastic Leukemia by Promoting Proliferation, Inhibiting Apoptosis and Targeting the Glucocorticoid Receptor. J. Steroid Biochem. Mol. Biol. 2017, 172, 62–68. [Google Scholar] [CrossRef]
  20. Liu, K.; Zhang, X.; Wei, W.; Liu, X.; Tian, Y.; Han, H.; Zhang, L.; Wu, W.; Chen, J. Myostatin/Smad4 Signaling-Mediated Regulation of Mir-124-3p Represses Glucocorticoid Receptor Expression and Inhibits Adipocyte Differentiation. Am. J. Physiol. Endocrinol. Metab. 2019, 316, E635–E645. [Google Scholar] [CrossRef]
  21. Roy, B.; Dunbar, M.; Shelton, R.C.; Dwivedi, Y. Identification of MicroRNA-124-3p as a Putative Epigenetic Signature of Major Depressive Disorder. Neuropsychopharmacology 2017, 42, 864–875. [Google Scholar] [CrossRef]
  22. Zhang, Z.; Che, X.; Yang, N.; Bai, Z.; Wu, Y.; Zhao, L.; Pei, H. MiR-135b-5p Promotes Migration, Invasion and EMT of Pancreatic Cancer Cells by Targeting NR3C2. Biomed. Pharmacother. 2017, 96, 1341–1348. [Google Scholar] [CrossRef] [PubMed]
  23. Huang, Y.; Wang, Y.; Ouyang, Y. Elevated MicroRNA-135b-5p Relieves Neuronal Injury and Inflammation in Post-Stroke Cognitive Impairment by Targeting NR3C2. Int. J. Neurosci. 2021, 132, 58–66. [Google Scholar] [CrossRef] [PubMed]
  24. Kozomara, A.; Birgaoanu, M.; Griffiths-Jones, S. MiRBase: From MicroRNA Sequences to Function. Nucleic Acids Res. 2019, 47, D155–D162. [Google Scholar] [CrossRef] [PubMed]
  25. McGeary, S.E.; Lin, K.S.; Shi, C.Y.; Pham, T.M.; Bisaria, N.; Kelley, G.M.; Bartel, D.P. The Biochemical Basis of MicroRNA Targeting Efficacy. Science 2019, 366, eaav1741. [Google Scholar] [CrossRef] [PubMed]
  26. Kasuki, L.; Antunes, X.; Coelho, M.C.A.; Lamback, E.B.; Galvão, S.; Silva Camacho, A.H.; Chimelli, L.; Ventura, N.; Gadelha, M.R. Accuracy of Microcystic Aspect on T2-Weighted MRI for the Diagnosis of Silent Corticotroph Adenomas. Clin. Endocrinol. 2020, 92, 145–149. [Google Scholar] [CrossRef] [PubMed]
  27. Thodou, E.; Argyrakos, T.; Kontogeorgos, G. Galectin-3 as a Marker Distinguishing Functioning from Silent Corticotroph Adenomas. Hormones 2007, 6, 227–232. [Google Scholar]
  28. Valassi, E.; Santos, A.; Yaneva, M.; Tóth, M.; Strasburger, C.J.; Chanson, P.; Wass, J.A.H.; Chabre, O.; Pfeifer, M.; Feelders, R.A.; et al. The European Registry on Cushing’s Syndrome: 2-Year Experience. Baseline Demographic and Clinical Characteristics. Eur. J. Endocrinol. 2011, 165, 383–392. [Google Scholar] [CrossRef]
  29. Langlois, F.; Shao, D.; Lim, T.; Yedinak, C.G.; Cetas, I.; Mccartney, S.; Cetas, J.; Dogan, A.; Fleseriu, M. Predictors of Silent Corticotroph Adenoma Recurrence; a Large Retrospective Single Center Study and Systematic Literature Review. Pituitary 2018, 21, 32–40. [Google Scholar] [CrossRef]
  30. Jahangiri, A.; Wagner, J.R.; Pekmezci, M.; Hiniker, A.; Chang, E.F.; Kunwar, S.; Blevins, L.; Aghi, M.K. A Comprehensive Long-Term Retrospective Analysis of Silent Corticotrophic Adenomas vs Hormone-Negative Adenomas. Neurosurgery 2013, 73, 8–17. [Google Scholar] [CrossRef]
  31. Strickland, B.A.; Shahrestani, S.; Briggs, R.G.; Jackanich, A.; Tavakol, S.; Hurth, K.; Shiroishi, M.S.; Liu, C.-S.J.; Carmichael, J.D.; Weiss, M.; et al. Silent Corticotroph Pituitary Adenomas: Clinical Characteristics, Long-Term Outcomes, and Management of Disease Recurrence. J. Neurosurg. 2021, 135, 1–8. [Google Scholar] [CrossRef]
  32. Machado, M.C.; Alcantara, A.E.E.; Pereira, A.C.L.; Cescato, V.A.S.; Castro Musolino, N.R.; de Mendonça, B.B.; Bronstein, M.D.; Fragoso, M.C.B.V. Negative Correlation between Tumour Size and Cortisol/ ACTH Ratios in Patients with Cushing’s Disease Harbouring Microadenomas or Macroadenomas. J. Endocrinol. Invest. 2016, 39, 1401–1409. [Google Scholar] [CrossRef] [PubMed]
  33. García-Martínez, A.; Fuentes-Fayos, A.C.; Fajardo, C.; Lamas, C.; Cámara, R.; López-Muñoz, B.; Aranda, I.; Luque, R.M.; Picó, A. Differential Expression of MicroRNAs in Silent and Functioning Corticotroph Tumors. J. Clin. Med. 2020, 9, 1838. [Google Scholar] [CrossRef] [PubMed]
  34. Huang, H.Y.; Lin, Y.C.D.; Li, J.; Huang, K.Y.; Shrestha, S.; Hong, H.C.; Tang, Y.; Chen, Y.G.; Jin, C.N.; Yu, Y.; et al. MiRTarBase 2020: Updates to the Experimentally Validated MicroRNA-Target Interaction Database. Nucleic Acids Res. 2020, 48, D148–D154. [Google Scholar] [CrossRef] [PubMed]
  35. Koning, A.S.C.A.M.; Buurstede, J.C.; van Weert, L.T.C.M.; Meijer, O.C. Glucocorticoid and Mineralocorticoid Receptors in the Brain: A Transcriptional Perspective. J. Endocr. Soc. 2019, 3, 1917–1930. [Google Scholar] [CrossRef]
  36. Nakai, Y.; Usui, T.; Tsukada, T.; Takahashi, H.; Fukata, J.; Fukushima, M.; Senoo, K.; Imura, H. Molecular Mechanisms of Glucocorticoid Inhibition of Human Proopiomelanocortin Gene Transcription. J. Steroid Biochem. Mol. Biol. 1991, 40, 301–306. [Google Scholar] [CrossRef]
  37. Drouin, J.; Charron, J.; Gagner, J.-P.; Jeannotte, L.; Nemer, M.; Plante, R.K.; Wrange, Ö. Pro-opiomelanocortin Gene: A Model for Negative Regulation of Transcription by Glucocorticoids. J. Cell. Biochem. 1987, 35, 293–304. [Google Scholar] [CrossRef]
  38. Huizenga, N.A.T.M.; De Lange, P.; Koper, J.W.; Clayton, R.N.; Farrell, W.E.; Van Der Lely, A.J.; Brinkmann, A.O.; De Jong, F.H.; Lamberts, S.W.J. Human Adrenocorticotropin-Secreting Pituitary Adenomas Show Frequent Loss of Heterozygosity at the Glucocorticoid Receptor Gene Locus. J. Clin. Endocrinol. Metab. 1998, 83, 917–921. [Google Scholar] [CrossRef]
  39. Miao, H.; Liu, Y.; Lu, L.; Gong, F.; Wang, L.; Duan, L.; Yao, Y.; Wang, R.; Chen, S.; Mao, X.; et al. Effect of 3 NR3C1 Mutations in the Pathogenesis of Pituitary ACTH Adenoma. Endocrinology 2021, 162, bqab167. [Google Scholar] [CrossRef]
  40. Mu, Y.M.; Takayanagi, R.; Imasaki, K.; Ohe, K.; Ikuyama, S.; Yanase, T.; Nawata, H. Low Level of Glucocorticoid Receptor Messenger Ribonucleic Acid in Pituitary Adenomas Manifesting Cushing’s Disease with Resistance to a High Dose-Dexamethasone Suppression Test. Clin. Endocrinol. 1998, 49, 301–306. [Google Scholar] [CrossRef]
  41. Ebisawa, T.; Tojo, K.; Tajima, N.; Kamio, M.; Oki, Y.; Ono, K.; Sasano, H. Immunohistochemical Analysis of 11-β-Hydroxysteroid Dehydrogenase Type 2 and Glucocorticoid Receptor in Subclinical Cushing’s Disease Due to Pituitary Macroadenoma. Endocr. Pathol. 2008, 19, 252–260. [Google Scholar] [CrossRef]
  42. Ledderose, C.; Möhnle, P.; Limbeck, E.; Schütz, S.; Weis, F.; Rink, J.; Briegel, J.; Kreth, S. Corticosteroid Resistance in Sepsis Is Influenced by MicroRNA-124-Induced Downregulation of Glucocorticoid Receptor-α. Crit. Care Med. 2012, 40, 2745–2753. [Google Scholar] [CrossRef] [PubMed]
  43. Spencer, R.L.; Deak, T. A Users Guide to HPA Axis Research. Physiol. Behav. 2017, 178, 43–65. [Google Scholar] [CrossRef] [PubMed]
  44. Han, F.; Ozawa, H.; Matsuda, K.I.; Nishi, M.; Kawata, M. Colocalization of Mineralocorticoid Receptor and Glucocorticoid Receptor in the Hippocampus and Hypothalamus. Neurosci. Res. 2005, 51, 371–381. [Google Scholar] [CrossRef]
  45. Castinetti, F.; Fassnacht, M.; Johanssen, S.; Terzolo, M.; Bouchard, P.; Chanson, P.; Cao, D.; Morange, I.; Picó, A.; Ouzounian, S.; et al. Merits and Pitfalls of Mifepristone in Cushing’s Syndrome. Eur. J. Endocrinol. 2009, 160, 1003–1010. [Google Scholar] [CrossRef] [PubMed]
  46. Fleseriu, M.; Laws, E.R.; Witek, P.; Pivonello, R.; Ferrigno, R.; de Martino, M.C.; Simeoli, C.; di Paola, N.; Pivonello, C.; Barba, L.; et al. Medical Treatment of Cushing’s Disease: An Overview of the Current and Recent Clinical Trials. Front. Endocrinol. 2020, 11, 648. [Google Scholar] [CrossRef]
  47. Senyuk, V.; Zhang, Y.; Liu, Y.; Ming, M.; Premanand, K.; Zhou, L.; Chen, P.; Chen, J.; Rowley, J.D.; Nucifora, G.; et al. Critical Role of MiR-9 in Myelopoiesis and EVI1-Induced Leukemogenesis. Proc. Natl. Acad. Sci. USA 2013, 110, 5594–5599. [Google Scholar] [CrossRef] [PubMed]
  48. Liu, D.Z.; Chang, B.; Li, X.D.; Zhang, Q.H.; Zou, Y.H. MicroRNA-9 Promotes the Proliferation, Migration, and Invasion of Breast Cancer Cells via down-Regulating FOXO1. Clin. Transl. Oncol. 2017, 19, 1133–1140. [Google Scholar] [CrossRef] [PubMed]
  49. Guttilla, I.K.; White, B.A. Coordinate Regulation of FOXO1 by MiR-27a, MiR-96, and MiR-182 in Breast Cancer Cells. J. Biol. Chem. 2009, 284. [Google Scholar] [CrossRef]
  50. Xu, Y.; Zhao, S.; Cui, M.; Wang, Q. Down-Regulation of MicroRNA-135b Inhibited Growth of Cervical Cancer Cells by Targeting FOXO1. Int. J. Clin. Exp. Pathol. 2015, 8, 10294–10304. [Google Scholar]
  51. Lau, P.; Bossers, K.; Janky, R.; Salta, E.; Frigerio, C.S.; Barbash, S.; Rothman, R.; Sierksma, A.S.R.; Thathiah, A.; Greenberg, D.; et al. Alteration of the MicroRNA Network during the Progression of Alzheimer’s Disease. EMBO Mol. Med. 2013, 5, 1613–1634. [Google Scholar] [CrossRef]
  52. Kapali, J.; Kabat, B.E.; Schmidt, K.L.; Stallings, C.E.; Tippy, M.; Jung, D.O.; Edwards, B.S.; Nantie, L.B.; Raeztman, L.T.; Navratil, A.M.; et al. Foxo1 Is Required for Normal Somatotrope Differentiation. Endocrinology 2016, 157, 4351–4363. [Google Scholar] [CrossRef] [PubMed]
  53. Garrel, G.; Denoyelle, C.; L’Hôte, D.; Picard, J.Y.; Teixeira, J.; Kaiser, U.B.; Laverrière, J.N.; Cohen-Tannoudji, J. GnRH Transactivates Human AMH Receptor Gene via Egr1 and FOXO1 in Gonadotrope Cells. Neuroendocrinology 2019, 108, 65–83. [Google Scholar] [CrossRef] [PubMed]
  54. Skarra, D.V.; Arriola, D.J.; Benson, C.A.; Thackray, V.G. Forkhead Box O1 Is a Repressor of Basal and GnRH-Induced Fshb Transcription in Gonadotropes. Mol. Endocrinol. 2013, 27, 1825–1839. [Google Scholar] [CrossRef] [PubMed]
  55. Xiao, Z.; Wang, Z.; Hu, B.; Mao, Z.; Zhu, D.; Feng, Y.; Zhu, Y. MiR-1299 Promotes the Synthesis and Secretion of Prolactin by Inhibiting FOXO1 Expression in Drug-Resistant Prolactinomas. Biochem. Biophys. Res. Commun. 2019, 520, 79–85. [Google Scholar] [CrossRef]
  56. Benite-Ribeiro, S.A.; de Lima Rodrigues, V.A.; Machado, M.R.F. Food Intake in Early Life and Epigenetic Modifications of Pro-Opiomelanocortin Expression in Arcuate Nucleus. Mol. Biol. Rep. 2021, 48, 3773–3784. [Google Scholar] [CrossRef]
  57. Knosp, E.; Steiner, E.; Kitz, K.; Matula, C.; Parent, A.D.; Laws, E.R.; Ciric, I. Pituitary Adenomas with Invasion of the Cavernous Sinus Space: A Magnetic Resonance Imaging Classification Compared with Surgical Findings. Neurosurgery 1993, 33, 610–618. [Google Scholar] [CrossRef]
  58. Bujko, M.; Kober, P.; Boresowicz, J.; Rusetska, N.; Zeber-Lubecka, N.; Paziewska, A.; Pekul, M.; Zielinski, G.; Styk, A.; Kunicki, J.; et al. Differential MicroRNA Expression in USP8-Mutated and Wild-Type Corticotroph Pituitary Tumors Reflect the Difference in Protein Ubiquitination Processes. J. Clin. Med. 2021, 10, 375. [Google Scholar] [CrossRef]
  59. Mi, H.; Ebert, D.; Muruganujan, A.; Mills, C.; Albou, L.P.; Mushayamaha, T.; Thomas, P.D. PANTHER Version 16: A Revised Family Classification, Tree-Based Classification Tool, Enhancer Regions and Extensive API. Nucleic Acids Res. 2021, 49, D394–D403. [Google Scholar] [CrossRef]
Publisher’s Note: MDPI stays neutral with regard to jurisdictional claims in published maps and institutional affiliations.

Covid-19 and Cushing’s Disease in a Patient with ACTH-secreting Pituitary Carcinoma

Abstract

Summary

The pandemic caused by severe acute respiratory syndrome coronavirus 2 is of an unprecedented magnitude and has made it challenging to properly treat patients with urgent or rare endocrine disorders. Little is known about the risk of coronavirus disease 2019 (COVID-19) in patients with rare endocrine malignancies, such as pituitary carcinoma. We describe the case of a 43-year-old patient with adrenocorticotrophic hormone-secreting pituitary carcinoma who developed a severe COVID-19 infection. He had stabilized Cushing’s disease after multiple lines of treatment and was currently receiving maintenance immunotherapy with nivolumab (240 mg every 2 weeks) and steroidogenesis inhibition with ketoconazole (800 mg daily). On admission, he was urgently intubated for respiratory exhaustion. Supplementation of corticosteroid requirements consisted of high-dose dexamethasone, in analogy with the RECOVERY trial, followed by the reintroduction of ketoconazole under the coverage of a hydrocortisone stress regimen, which was continued at a dose depending on the current level of stress. He had a prolonged and complicated stay at the intensive care unit but was eventually discharged and able to continue his rehabilitation. The case points out that multiple risk factors for severe COVID-19 are present in patients with Cushing’s syndrome. ‘Block-replacement’ therapy with suppression of endogenous steroidogenesis and supplementation of corticosteroid requirements might be preferred in this patient population.

Learning points

  • Comorbidities for severe coronavirus disease 2019 (COVID-19) are frequently present in patients with Cushing’s syndrome.
  • ‘Block-replacement’ with suppression of endogenous steroidogenesis and supplementation of corticosteroid requirements might be preferred to reduce the need for biochemical monitoring and avoid adrenal insufficiency.
  • The optimal corticosteroid dose/choice for COVID-19 is unclear, especially in patients with endogenous glucocorticoid excess.
  • First-line surgery vs initial disease control with steroidogenesis inhibitors for Cushing’s disease should be discussed depending on the current healthcare situation.

Background

The pandemic caused by severe acute respiratory syndrome coronavirus 2 (SARS-CoV-2) has had a significant impact on the health care systems to date. The clinical presentation of coronavirus disease 2019 (COVID-19) is diverse, ranging from asymptomatic illness to respiratory failure requiring admission to the intensive care unit (ICU). Risk factors for severe course include old age, male gender, comorbidities such as arterial hypertension, diabetes mellitus, chronic lung-, heart-, liver- and kidney disease, malignancy, immunodeficiency and pregnancy (1). Little is known about the risk of COVID-19 in patients with rare endocrine malignancies, such as pituitary carcinoma.

Case presentation

This case concerns a 43-year-old man with adrenocorticotrophic hormone (ACTH)-secreting pituitary carcinoma (with cerebellar and cervical drop metastases) with a severe COVID-19 infection. He had previously received multiple treatment modalities including surgery, radiotherapy, ketoconazole, pasireotide, cabergoline, bilateral (subtotal) adrenalectomy and temozolomide chemotherapy as described elsewhere (2). His most recent therapy was a combination of immune checkpoint inhibitors consisting of ipilimumab (3 mg/kg) and nivolumab (1 mg/kg) (anti-CTLA-4 and anti-PD-1, respectively) every 3 weeks for four cycles, after which maintenance therapy with nivolumab (240 mg) every 2 weeks was continued. Residual endogenous cortisol production was inhibited with ketoconazole 800 mg daily. He had stabilized disease with a decrease in plasma ACTH, urinary free cortisol and stable radiological findings (2). Surgical resection of the left adrenal remnant was planned but was not carried out due to the development of a COVID-19 infection.

In March 2021, he consulted our emergency department for severe respiratory complaints. He had been suffering from upper respiratory tract symptoms for one week, with progressive dyspnoea in the last three days. He tested positive for SARS-CoV-2 the day before admission. On examination, his O2 saturation was 72%, with tachypnoea (40/min) and bilateral pulmonary crepitations. His temperature was 37.2°C, blood pressure 124/86 mmHg and pulse rate 112 bpm. High-flow oxygen therapy was initiated but yielded insufficient improvement (O2 saturation of 89% and tachypnoea 35/min). He was urgently intubated for respiratory exhaustion.

Investigation

Initial investigations showed type 1 respiratory insufficiency with PaO2 of 52.5 mmHg (normal 75–90), PaCO2 of 33.0 mmHg (normal 36–44), pH of 7.47 (normal 7.35–7.45) and a P/F ratio of 65.7 (normal >300). His inflammatory parameters were elevated with C-reactive protein level of 275.7 mg/L (normal <5·0) and white blood cell count of 7.1 × 10⁹ per L with 72.3% neutrophils. His most recent morning plasma ACTH-cortisol level (measured using the Elecsys electrochemiluminescence immunoassays on a Cobas 8000 immunoanalyzer [Roche Diagnostics]) before his admission was 213 ng/L (normal 7.2–63) and 195 µg/L (normal 62–180) respectively, while a repeat measurement 3 weeks after his admission demonstrated increased cortisol levels of 547 µg/L (possibly iatrogenic due to treatment with high-dose hydrocortisone) and a decreased ACTH of 130 ng/L.

Treatment

On admission, he was started on high-dose dexamethasone therapy for 10 days together with broad-spectrum antibiotics for positive sputum cultures containing Serratia, methicillin-susceptible Staphylococcus aureus and Haemophilus influenzae. Thromboprophylaxis with an intermediate dose of low molecular weight heparin (tinzaparin 14 000 units daily for a body weight of 119 kg) was initiated. A ‘block-replacement’ regimen was adopted with the continuation of ketoconazole (restarted on day 11) in view of his endocrine treatment and the supplementation of hydrocortisone at a dose depending on the current level of stress. The consecutive daily dose of hydrocortisone and ketoconazole is shown in Fig. 1.

Figure 1View Full Size
Figure 1
‘Block-replacement’ therapy with ketoconazole and hydrocortisone/dexamethasone. Dexamethasone 10 mg daily was initially started as COVID-19 treatment, followed by hydrocortisone at a dose consistent with current levels of stress. Ketoconazole was restarted on day 11 and titrated to a dose of 800 mg daily to suppress endogenous glucocorticoid production.

Citation: Endocrinology, Diabetes & Metabolism Case Reports 2022, 1; 10.1530/EDM-21-0182

Outcome and follow-up

He developed multiple organ involvement, including metabolic acidosis, acute renal failure requiring continuous venovenous hemofiltration, acute coronary syndrome type 2, septic thrombophlebitis of the right jugular vein, and critical illness polyneuropathy. He was readmitted twice to the ICU, for ventilator-associated pneumonia and central line-associated bloodstream infection respectively. He eventually recovered and was discharged from the hospital to continue his rehabilitation.

Discussion

We describe the case of a patient with severe COVID-19 infection with active Cushing’s disease due to pituitary carcinoma, who was treated with high-dose dexamethasone followed by ‘block-replacement’ therapy with hydrocortisone in combination with off-label use of ketoconazole as a steroidogenesis inhibitor. His hospitalization was prolonged by multiple readmissions to the ICU for infectious causes. Our case illustrates the presence of multiple comorbidities for a severe and complicated course of COVID-19 in a patient with active Cushing’s disease.

Dexamethasone was initially chosen as the preferred corticosteroid therapy, in analogy with the RECOVERY trial, in which dexamethasone at a dose of 6mg once daily (oral or i.v.) resulted in lower 28-day mortality in hospitalized patients with COVID-19 requiring oxygen therapy or invasive mechanical ventilation (3). However, the optimal dose/choice of corticosteroid therapy is unclear, especially in a patient population with pre-existing hypercortisolaemia. A similar survival benefit for hydrocortisone compared to dexamethasone has yet to be convincingly demonstrated. This may be explained by differences in anti-inflammatory activity but could also be due to the fact that recent studies with hydrocortisone were stopped early and were underpowered (45).

Multiple risk factors for a complicated course of COVID-19 are present in patients with Cushing’s syndrome and might increase morbidity and mortality (67). These include a history of obesity, arterial hypertension and impaired glucose metabolism. Prevention and treatment of these pre-existing comorbidities are essential.

Patients with Cushing’s syndrome also have an increased thromboembolic risk, which is further accentuated by the development of severe COVID-19 infection (67). Thromboprophylaxis with low molecular weight heparin is associated with lower mortality in COVID-19 patients with high sepsis‐induced coagulopathy score or high D-dimer levels (8) and is presently widely used in the treatment of severe COVID-19 disease (9). Subsequently, this treatment is indicated in hospitalized COVID-19 patients with Cushing’s syndrome. It is unclear whether therapeutic anticoagulation dosing could provide additional benefits (67). An algorithm based on the International Society on Thrombosis and Hemostasis-Disseminated Intravascular Coagulation score was proposed to evaluate the ideal anticoagulation therapy in severe/critical COVID-19 patients, with an indication for therapeutic low molecular weight heparin dose at a score ≥5 (9).

Furthermore, the chronic cortisol excess induces suppression of the innate and adaptive immune response. Patients with Cushing’s syndrome, especially when severe and active, should be considered immunocompromised and have increased susceptibility for viral and other (hospital-acquired) infections. Prophylaxis for Pneumocystis jirovecii with trimethoprim/sulfamethoxazole should therefore be considered (67).

Additionally, there is a particular link between the pathophysiology of COVID-19 and Cushing’s syndrome. The SARS-CoV-2 virus (as well as other coronaviruses) enter human cells by binding the ACE2 receptor. The transmembrane serine protease 2 (TMPRSS2), expressed by endothelial cells, is additionally required for the priming of the spike-protein of SARS-CoV-2, leading to viral entry. TMPRSS2 was studied in prostate cancer and found to be regulated by androgen signalling. Consequently, the androgen excess frequently associated with Cushing’s syndrome might be an additional risk factor for contracting COVID-19 via higher TMPRSS2 expression (10), especially in women, in whom the effect of excess androgen would be more noticeable compared to male patients with Cushing’s syndrome.

Treating Cushing’s syndrome with a ‘block-replacement’ approach, with suppression of endogenous steroidogenesis and supplementation of corticosteroid requirements, is an approach that should be considered, especially in severe or cyclic disease. The use of this method might decrease the need for monitoring and reduce the occurrence of adrenal insufficiency (7). Our patient was on treatment with ketoconazole, which was interrupted at initial presentation and then restarted under the coverage of a hydrocortisone stress regimen. Ketoconazole was chosen because of its availability. Advantages of ketoconazole over metyrapone include its antifungal activity with the potential for prevention of invasive pulmonary fungal infections, as well as its antiandrogen action (especially in female patients) and subsequent inhibition of TMPRSS2 expression (10). Regular monitoring of the liver function (every month for the first 3 months, at therapy initiation or dose increase) is necessary. Caution is needed due to its inhibition of multiple cytochrome P450 enzymes (including CYP3A4) and subsequently greater risk of drug-drug interactions vs metyrapone (710). Another disadvantage of ketoconazole is the need for oral administration. In our patient, ketoconazole was delivered through a nasogastric tube. i.v. etomidate is an alternative in case of an unavailable enteral route.

Finally, as a general point, the first-line treatment of a patient with a novel diagnosis of Cushing’s disease is transsphenoidal surgery. Recent endocrine recommendations pointed out the possibility of initial disease control with steroidogenesis inhibitors in patients without an indication for urgent intervention during a high prevalence of COVID-19 (7). This would allow the optimalization of metabolic parameters; emphasizing that the short-to mid-term prognosis is related to the cortisol excess and not its cause. Surgery could then be postponed until the health situation allows for safe elective surgery (7). This decision depends of course on the evolution of COVID-19 and the healthcare system in each country and should be closely monitored by policymakers and physicians.

Declaration of interest

The authors declare that there is no conflict of interest that could be perceived as prejudicing the impartiality of the research reported.

Funding

This work did not receive any specific grant from any funding agency in the public, commercial, or not-for-profit sector.

Patient consent

Written informed consent for publication of their clinical details and/or clinical images was obtained from the patient.

Author contribution statement

J M K de Filette is an endocrinologist-in-training and was the main author. All authors were involved in the clinical care of the patient. All authors contributed to the reviewing and editing process and approved the final version of the manuscript.

References

Vitamin D Deficiency in Cushing’s Disease: Before and After Its Supplementation

1
Department of Health Promotion, Maternal-Infantile Care, Excellence Internal and Specialist Medicine “G. D’Alessandro” [PROMISE], Section of Endocrine Disease and Nutrition, University of Palermo, 90127 Palermo, Italy
2
Biochemistry Head CQRC Division (Quality Control and Biochemical Risk), Department of Health Promotion, Maternal-Infantile Care, Excellence Internal and Specialist Medicine “G. D’Alessandro” [PROMISE], University of Palermo, 90127 Palermo, Italy
Author to whom correspondence should be addressed.
Academic Editor: Edgard Delvin
Nutrients 202214(5), 973; https://doi.org/10.3390/nu14050973

Abstract

Background: The primary objective of the study was to assess serum 25-hydroxyvitamin D [25(OH)D] values in patients with Cushing’s disease (CD), compared to controls. The secondary objective was to assess the response to a load of 150,000 U of cholecalciferol. Methods: In 50 patients with active CD and 48 controls, we evaluated the anthropometric and biochemical parameters, including insulin sensitivity estimation by the homeostatic model of insulin resistance, Matsuda Index and oral disposition index at baseline and in patients with CD also after 6 weeks of cholecalciferol supplementation. Results: At baseline, patients with CD showed a higher frequency of hypovitaminosis deficiency (p = 0.001) and lower serum 25(OH)D (p < 0.001) than the controls. Six weeks after cholecalciferol treatment, patients with CD had increased serum calcium (p = 0.017), 25(OH)D (p < 0.001), ISI-Matsuda (p = 0.035), oral disposition index (p = 0.045) and decreased serum PTH (p = 0.004) and total cholesterol (p = 0.017) values than at baseline. Multivariate analysis showed that mean urinary free cortisol (mUFC) was independently negatively correlated with serum 25(OH)D in CD. Conclusions: Serum 25(OH)D levels are lower in patients with CD compared to the controls. Vitamin D deficiency is correlated with mUFC and values of mUFC > 240 nmol/24 h are associated with hypovitaminosis D. Cholecalciferol supplementation had a positive impact on insulin sensitivity and lipids.

1. Introduction

Vitamin D is the precursor of a hormone with pleiotropic effects. Its deficiency has been largely investigated and shown to be associated with many complications including diabetes mellitus, adrenal insufficiency, cardiovascular disease, neurological disorders and other endocrinopathies [1,2,3].
Vitamin D, also known as cholecalciferol, is first formed in the skin by the photolysis of 7-dehydrocholesterol and after hydroxylated in the liver to 25-hydroxyvitamin D [25(OH)D]. It is further transformed in the kidney into 1,25-dihydroxyvitamin D3 (1,25(OH)2D3) (calcitriol) that is the active form [4].
Cushing’s disease (CD) is characterized by a cortisol excess due to autonomous pituitary ACTH secretion. Patients with CD show many comorbidities such as cardiovascular disease, metabolic disease, diabetes mellitus, metabolic syndrome, dyslipidemia, obesity, osteoporosis/osteopenia and infections that contribute to increasing the mortality risk for these patients [5,6,7,8,9,10,11]. Indeed, GCs are key regulators of intermediary metabolism promoting hepatic gluconeogenesis and glycogenosis and on lipid metabolism favouring the deposition of fat to the upper trunk and the face [12]. They stimulate water diuresis, glomerular filtration rate and renal plasma flow and these effects result in arterial hypertension and atherosclerosis. GCs reduce bone remodelling, augment urinary calcium excretion and decrease the intestinal calcium absorption. In addition, they act on immune and hematological systems inhibiting the secretion of interleukins and increasing the red blood cell count, respectively [12].
An interesting relationship exists between glucocorticoids (GCs) and vitamin D values [13,14,15,16]. Indeed, exogenous steroid therapy has been reported to be associated with vitamin deficiency [13]. The mechanism by which GCs reduce 25(OH)D levels is not direct, but indirect, regulating vitamin D receptor expression in many tissues and cells [17,18]. Some authors have shown that treatment with dexamethasone in mice was associated with a decrease in 1α-hydroxylase which is involved in the conversion from 25(OH)D3 to the active metabolite 1,25(OH)2D3 and an increase in 24-hydroxylase, able to break down the active form of calcitriol, in inactive, reducing circulating 25(OH)D levels [19]. In a clinical setting, controversial data have been reported on GCs effects on serum 1,25(OH)2D concentrations [20,21,22,23]. A likely reason for these discrepancies might be the marked heterogeneity of the studied groups. Some of these studies were performed in humans [23,24,25,26], and others in animal models [27,28], but only a few studies were conducted in subjects with endogenous hypercortisolism.
Low serum 25(OH)D levels have significant skeletal and extra-skeletal consequences such as myopathy, high risk of fractures and also affect the immune system and metabolism. All of these systems are impaired in patients with hypercortisolism and a vitamin D deficiency may provide a further aggravation of CD comorbidities. Indeed, it may cause a reduced intestinal calcium absorption resulting in secondary hypocalcemia and hyperparathyroidism leading to a bone demineralization. Its deficiency can contribute to obesity and metabolic syndrome due to the lack of antiadipogenic effect of vitamin D and to cardiovascular disease by a deregulation of the renin–angiotensin–aldosterone system, cardiac contractility and increase in cytokine release [29]. In the end, vitamin D deficiency causes impaired insulin sensitivity and immune system [30].
The discrepancies that emerge in the above-mentioned studies suggest a need to investigate the role of 25(OH)D in patients with CD. Therefore, the primary objective of the study was to evaluate serum 25(OH)D levels in patients with CD, compared to a control group matched for age, BMI and gender, and search for a possible correlation with the degree of hypercortisolism. The secondary objective was to evaluate the response to a course of 150,000 U of cholecalciferol on metabolic and hormonal parameters 6 weeks after the administration in patients with CD.

2. Materials and Methods

2.1. Subjects and Study Design

Fifty patients with active CD, 43 of them women (86%) and 7 of them men (20%) (mean age 50.9 ± 17.4 years; mean duration of disease 32.5 ± 22.4 years), followed from January 2016 to December 2020, by the Endocrinology of the University of Palermo, were included in the current study. Clinical practice guidelines and a recent consensus statement were used to diagnose CD [31,32].
We recruited a control group matched for age, BMI and gender in the same temporal period. It was composed of 48 patients, 33 women (82.5%) and 7 men (17.5%) (mean age 48.5 ± 13.4 years) were evaluated by our team for a suspicion not biochemically confirmed of Cushing’s syndrome (CS).
In all patients, we evaluated phenotypic characteristics including moon face, facial rubor, dorsal fat pad or buffalo hump, defined as a fatty tissue deposit between the shoulders, purple striae, defined as wide, reddish-purple streaks, and myopathy defined as muscle weakness at the proximal level.
We also assessed cardiovascular, metabolic and bone comorbidities. The diagnosis of metabolic syndrome was based on National Cholesterol Education Program Adult Treatment Panel (NCEP ATP III) criteria, while the diagnosis of diabetes mellitus and prediabetes were based on the American Diabetes Association (ADA, Arlington, VA, USA) criteria [33,34].
Among patients with diabetes mellitus (18 out of 50), 16 were treated with metformin alone, while 2 were treated with a combination of metformin and GLP-1 agonist receptors. Metformin and GLP-1 agonist receptors were discontinued 24 h and 2 weeks before metabolic evaluations, respectively, to avoid any interference with metabolic parameters. Diabetic patients were on good metabolic control (HbA1c ≤ 7%). Both CD patients and the controls were naïve to cholecalciferol.
In CD and the controls, BMI and waist circumference (WC), fasting serum lipids (total cholesterol (TC), HDL cholesterol, LDL cholesterol and triglycerides (TG), HbA1c, glycaemia, insulinaemia, albumin corrected calcium, phosphorus and parathyroid hormone (PTH) were assessed. To avoid seasonal influences, serum 25(OH)D levels were only assayed between winter and spring seasons (November–April). We evaluated urinary free cortisol (UFC) as the mean of three 24 h urine collections (mUFC), cortisol after a low dose of dexamethasone suppression test and plasma ACTH. We defined patients with mild hypercortisolism when mUFC levels not exceeding twice the upper limit of normal (ULN), moderate hypercortisolism by a level of mUFC more than 2 to 5 times the ULN and severe hypercortisolism by a mUFC level more than 5 times the ULN, as previously reported [35].
As defined by the Endocrine Society guidelines, we considered 25(OH)D deficiency for values < 20 ng/mL (50 nmol/L), insufficiency as levels of 20–30 ng/mL (50–75 nmol/L) and sufficiency for values ≥ 30 ng/mL (≥75 nmol/L) [36]. In addition, severe 25(OH)D deficiency was defined by levels < 10 ng/mL (<25 nmol/L) [37].
As markers of insulin sensitivity, we calculated the homeostatic model of insulin resistance (HOMA2-IR) [38], and in 32 patients with CD and in 40 controls who had no previous diagnosis of diabetes, we also evaluated the Matsuda index of insulin sensitivity (ISI-Matsuda) [39], the oral disposition index (DIo) [40] and the area under the curve for insulin (AUC2h insulinemia) and glucose (AUC2h glycaemia).
At the baseline visit, we assessed patients’ lifestyle habits: physical activity level, balanced diet (consumption of dairy products, meat, coffee, soft drinks), exposure to ultraviolet (UV) radiation, smoking status and alcohol use.
We excluded patients with adrenal-dependent hypercortisolism, pregnancy, taking oral contraceptives, liver or renal disease, cholecalciferol supplementation within 3 months before the study, malabsorption syndrome and exposure to ultraviolet (UV) radiation (solarium and sunscreen usage).
Patients with CD received an oral load dose of cholecalciferol of 150,000 UI [41,42] and biochemical parameters (metabolic and hormonal) were assayed 6 weeks after administration.
The study protocol was approved by the Ethics Committee of the Policlinico Paolo Giaccone hospital. All patients signed a written informed consent.

2.2. Assays

Biochemical parameters were measured by standard methods (Modular P800, Roche, Milan, Italy), as previously reported [9].
Hormonal parameters were measured by electrochemiluminescence immunoassay (ECLIA, Elecsys, Roche, Milan, Italy) following the manufacturer’s instructions, as previously reported [9].
Mean UFC was measured by mass spectrometry, as previously reported [35].
Normal values for hormonal markers were defined as follows: ACTH 2.2–14 pmol/L and UFC 59–378 nmol/24 h.

2.3. Statistical Analysis

We used statistical Packages for Social Science SPSS version 19 (SPSS, Inc., Chicago, IL, USA) for data analysis. The normality of quantitative variables was tested with the Shapiro–Wilk test. We calculated mean ± SD for continuous variables and rates and proportions for categorical variables. The differences between paired continuous variables (CD vs. controls) were analysed using one-way ANOVA. We used univariate Pearson correlation to evaluate the relations with the outcome parameters. For those variables which were significant at univariate correlation, we performed multiple linear regression analysis to identify independent predictors of the dependent variable 25(OH)D. A p-value of 0.05 was considered statistically significant. A receiver operating characteristic (ROC) analysis was performed to investigate the diagnostic ability of significantly associated risk factors to predict 25(OH)D deficiency. The ROC curve is plotted as sensitivity versus 1-specificity. The area under the ROC curve (AUC) was estimated to measure the overall performance of the predictive factors for serum 25(OH)D deficiency.

3. Results

At baseline, patients with CD had a higher frequency of arterial hypertension (p = 0.009), osteoporosis/osteopenia (p = 0.002), hypercholesterolemia (p = 0.002), diabetes mellitus (p = 0.026), myopathy (p < 0.001), facial rubor (p = 0.005), buffalo hump (p = 0.002) and hypovitaminosis deficiency (p = 0.001) than the controls (Table 1).
Table 1. Comorbidities of patients with CD and controls at baseline.
Table
By contrast, the controls had a higher frequency of vitamin D sufficiency (p = 0.004). Patients with CD also had higher WC (p = 0.031), PTH (p = 0.003), glycaemia (p = 0.010), HbA1c (p = 0.004), total cholesterol (p < 0.001), LDL cholesterol (p = 0.002), ACTH (p < 0.001), mUFC (p = 0.001), cortisol after a low dose of dexamethasone suppression test (p = 0.001) and lower 25(OH)D (p < 0.001), ISI-Matsuda (p = 0.007) and DIo (p = 0.003) than the controls (Table 2).
Table 2. Anthropometric and biochemical parameters of patients with CD and controls at baseline.
Table
Six weeks after cholecalciferol treatment, patients with CD showed increased serum calcium (p = 0.017), 25(OH)D (p < 0.001), ISI-Matsuda (p = 0.035), DIo (p = 0.045) and a decrease in PTH (p = 0.004) and total cholesterol (p = 0.017) levels than at baseline (Table 3).
Table 3. Anthropometric and biochemical parameters at baseline and 6 weeks after cholecalciferol supplementation in patients with CD.
Table
Considering the degree of hypercortisolism, in patients with severe hypercortisolism we observed 25(OH)D deficiency in 73.1% of cases (53.8% of them had a severe deficiency), insufficiency in 12.5% of cases and sufficiency in 6.3% of cases. In patients with moderate hypercortisolism, we observed 25(OH)D deficiency in 64.7% of cases (29% of them had a severe deficiency), insufficiency in 23.5% of cases and sufficiency in 11.8% of cases. In patients with mild hypercortisolism, we observed deficiency in 52.9% of cases (20% of them had a severe deficiency), insufficiency in 41.1% of cases and sufficiency in 6% of cases.
At univariate correlation, in patients with CD at baseline, serum 25(OH)D was inversely correlated with glycaemia (r = −0.385, p = 0.019), HbA1c (r = −0.391, p = 0.017), WC (r = −0.373, p = 0.023), mUFC (r = −0.466, p = 0.033) and cortisol after a low dose of dexamethasone suppression test (r = −0.299, p = 0.049) (Table 4). In the controls, at baseline, 25(OH)D was inversely correlated with WC (r = −0.130, p = 0.042) (Table 4).
Table 4. Correlation of serum 25-hydroxyvitamin D [25(OH)D] levels at baseline in patients with Cushing’s disease and controls.
Table
Multivariate analysis showed that mUFC was independently inversely associated with 25(OH)D (p = 0.010) in patients with CD (Figure 1). In the controls, no significant associations were found.
Nutrients 14 00973 g001 550
Figure 1. Independent variables associated with serum 25(OH)D in patients with active CD at multivariate analysis. mUFC: mean urinary free cortisol.
The ROC analysis showed that a cut-off of mUFC > 240 nmol/24 h was associated with 25(OH)D deficiency with a specificity of 100% and a sensitivity of 56.9%, AUC 0.803 (Figure 2).
Nutrients 14 00973 g002 550
Figure 2. 25(OH)D status and mUFC. ROC curve showed that a cut-off of mUFC > 240 nmol/24 h could be associated with 25(OH)D deficiency. Statistical analysis was performed using the chi-square test and receiver operator characteristic (ROC) curve analysis.

4. Discussion

The present study shows that patients with active CD have lower serum 25(OH)D values than the controls and that serum 25(OH)D levels are inversely correlated with mUFC in CD. In addition, a cholecalciferol load is associated after 6 weeks from the administration with an improvement of serum 25(OH)D and glycometabolic and lipid parameters in patients with CD. Furthermore, we found that higher values of mUFC than 240 nmol/24 h are predictive of 25(OH)D deficiency. The degree of hypercortisolism evaluated by UFC levels is a useful parameter to quantify the “amount” of cortisol secretion, even though it is not sufficiently exhaustive to assess the aggressiveness of the disease [35]. Indeed, a combination of several factors, including the degree of hypercortisolism, but also the duration of the disease, age and other individual predisposing factors, contribute to the aggressiveness of the disease.
Long-standing studies were conducted on vitamin D levels in patients with CD. Patients with CD, with and without osteopenia, were compared before and after oral calcium load showing that serum 1,25 (OH)2D3 plasma levels were higher in subjects with osteopenia than in those without it, likely due to a secondary increase in PTH levels as an effect of hypercortisolism [19]. Another study investigated the effect of hypercortisolism and eucortisolism, showing a reduction in serum 25(OH)D levels, but not in 1,25 (OH)2D3 in patients with hypercortisolism. By contrast, two other studies found normal serum 25(OH)D values in patients with CD [23,24]. However, all the above-mentioned studies were conducted on a small sample of patients. Recently, a meta-analysis conducted on the studies that evaluated serum 25(OH)D levels in patients treated with GCs reported lower serum 25(OH)D levels in these patients compared to healthy subjects [16]. A hypothetical reason was that patients with CD had low 24-hydroxylase levels than the controls, causing an alteration of vitamin D catabolism.
An interesting in vitro study in NCI-H295R cells found that treatment with 1,25(OH)2D3 decreased corticosterone secretion without affecting cortisol levels [43].
As expected, in the current study, we showed that treatment with cholecalciferol is associated with an improvement in insulin sensitivity and total cholesterol values in patients with CD. Indeed, cholecalciferol supplementation has been reported to be associated with improved peripheral insulin sensitivity and secretion in patients at high risk of diabetes or with type 2 diabetes [44]. A recent meta-analysis on 41 randomized controlled studies showed a significant improvement in total cholesterol levels after cholecalciferol supplementation. In addition, this improvement was more pronounced in patients with vitamin D deficiency [45,46].
A recent study compared the metabolism of vitamin D in patients with CD and controls after cholecalciferol treatment, showing that patients with CD had a higher 25(OH)D/24,25(OH)2D ratio than healthy controls, likely due to a decrease in 24-hydroxylase activity. The authors concluded that this alteration of vitamin D catabolism might have an influence on the effectiveness of cholecalciferol therapy in CD [47].
There are some limitations in the current study. First, the study is not randomized. Second, the dose of cholecalciferol administered is the same independently of the baseline serum 25(OH)D values. Third, we did not register the intake of milk and dairy products of the patients included in the study.
In conclusion, serum 25(OH)D levels are lower in subjects with active CD compared to controls matched for age, BMI and gender. Vitamin D deficiency is correlated with mUFC and values of mUFC > 240 nmol/24 h are predictive of 25(OH)D deficiency. In addition, cholecalciferol supplementation has a positive impact on insulin sensitivity and lipids and therefore should be considered part of the treatment of patients with CD at diagnosis, in order to improve the comorbidities. However, further studies are needed to evaluate a possible effect of cholecalciferol supplementation on the aggressiveness of CD.

Author Contributions

Conceptualization, V.G. and F.D.G.; methodology, V.G.; software, V.G.; validation, V.G., F.D.G. and C.G.; formal analysis, V.G.; investigation, V.G.; resources, F.D.G.; data curation, V.G.; writing—original draft preparation, V.G.; writing—review and editing, V.G.; visualization, V.G.; supervision, C.G.; project administration, C.G.; funding acquisition, C.G. All authors have read and agreed to the published version of the manuscript.

Funding

This research received no external funding.

Institutional Review Board Statement

The study was conducted in accordance with the Declaration of Helsinki, and was approved by the Institutional Review Board (or Ethics Committee) of Policlinico Paolo Giaccone (number 1, approved on the 17 January 2022).

Informed Consent Statement

Informed consent was obtained from all subjects involved in the study. Written informed consent has been obtained from the patient(s) to publish this paper.

Data Availability Statement

Data are available on demand at corresponding author.

Conflicts of Interest

The authors declare no conflict of interest.

References

  1. Muscogiuri, G.; Altieri, B.; Annweiler, C.; Balercia, G.; Pal, H.B.; Boucher, B.J.; Cannell, J.J.; Foresta, C.; Grübler, M.R.; Kotsa, K.; et al. Vitamin D and chronic diseases: The current state of the art. Arch. Toxicol. 2017, 91, 97–107. [Google Scholar] [CrossRef] [PubMed]
  2. Marino, R.; Misra, M. Extra-skeletal effects of Vitamin D. Nutrients 2019, 11, 1460. [Google Scholar] [CrossRef] [PubMed]
  3. Zendehdel, A.; Arefi, M. Molecular evidence of role of vitamin D deficiency in various extraskeletal diseases. J. Cell. Biochem. 2019, 120, 8829–8840. [Google Scholar] [CrossRef] [PubMed]
  4. Bikle, D.; Christakos, S. New aspects of vitamin D metabolism and action-addressing the skin as source and target. Nat. Rev. Endocrinol. 2020, 16, 234–252. [Google Scholar] [CrossRef]
  5. Pivonello, R.; Isidori, A.; De Martino, M.C.; Newell-Price, J.; Biller, B.M.K.; Colao, A. Complications of Cushing’s syndrome: State of the art. Lancet Diabetes Endocrinol. 2016, 4, 611–629. [Google Scholar] [CrossRef]
  6. Guarnotta, V.; Ferrigno, R.; Martino, M.; Barbot, M.; Isidori, A.M.; Scaroni, C.; Ferrante, A.; Arnaldi, G.; Pivonello, R.; Giordano, C. Glucocorticoid excess and COVID-19 disease. Rev. Endocr. Metab. Disord. 2020, 22, 703–714. [Google Scholar] [CrossRef]
  7. Giordano, C.; Guarnotta, V.; Pivonello, R.; Amato, M.C.; Simeoli, C.; Ciresi, A.; Cozzolino, A.; Colao, A. Is diabetes in Cushing’s syndrome only a consequence of hypercortisolism? Eur. J. Endocrinol. 2014, 170, 311–319. [Google Scholar] [CrossRef]
  8. Drey, M.; Berr, C.M.; Reincke, M.; Fazel, J.; Seissler, J.; Schopohl, J.; Bidlingmaier, M.; Zopp, S.; Reisch, N.; Beuschlein, F.; et al. Cushing′s syndrome: A model for sarcopenic obesity. Endocrine 2017, 57, 481–485. [Google Scholar] [CrossRef]
  9. Guarnotta, V.; Prinzi, A.; Pitrone, M.; Pizzolanti, G.; Giordano, C. Circulating irisin levels as a marker of osteosarcopenic-obesity in Cushing’s disease. Diabetes Metab. Syndr. Obes. 2020, 13, 1565–1574. [Google Scholar] [CrossRef]
  10. Hakami, O.A.; Ahmed, S.; Karavitaki, N. Epidemiology and mortality of Cushing′s syndrome. Best Pr. Res. Clin. Endocrinol. Metab. 2021, 35, 101521. [Google Scholar] [CrossRef]
  11. Javanmard, P.; Duan, D.; Geer, E.B. Mortality in patients with endogenous Cushing′s Syndrome. Endocrinol. Metab. Clin. North Am. 2018, 47, 313–333. [Google Scholar] [CrossRef] [PubMed]
  12. McKay, L.I.; Cidlowski, J.A. Physiologic and pharmacologic effects of corticosteroids. In Holland-Frei Cancer Medicine, 6th ed.; Kufe, D.W., Pollock., R.E., Weichselbaum, R.R., Eds.; BC Decker: Hamilton, ON, Canada, 2003. [Google Scholar]
  13. Tirabassi, G.; Salvio, G.; Altieri, B.; Ronchi, C.L.; Della Casa, S.; Pontecorvi, A.; Balercia, G. Adrenal disorders: Is there any role for Vitamin D? Rev. Endocr. Metab. Disord. 2016, 18, 355–362. [Google Scholar] [CrossRef] [PubMed]
  14. Skversky, A.L.; Kumar, J.; Abramowitz, M.K.; Kaskel, F.J.; Melamed, M.L. Association of glucocorticoid use and low 25-Hydroxyvitamin D levels: Results from the National Health and Nutrition Examination Survey (NHANES): 2001–2006. J. Clin. Endocrinol. Metab. 2011, 96, 3838–3845. [Google Scholar] [CrossRef] [PubMed]
  15. Muscogiuri, G.; Altieri, B.; Penna-Martinez, M.; Badenhoop, K. Focus on Vitamin D and the Adrenal Gland. Horm. Metab. Res. 2015, 47, 239–246. [Google Scholar] [CrossRef]
  16. Davidson, Z.E.; Walker, K.Z.; Truby, H. Clinical review: Do Glucocorticosteroids alter Vitamin D status? A systematic review with meta-analyses of observational studies. J. Clin. Endocrinol. Metab. 2012, 97, 738–744. [Google Scholar] [CrossRef]
  17. Hidalgo, A.A.; Trump, D.L.; Johnson, C.S. Glucocorticoid regulation of the vitamin D receptor. J. Steroid Biochem. Mol. Biol. 2010, 121, 372–375. [Google Scholar] [CrossRef]
  18. Hidalgo, A.A.; Deeb, K.K.; Pike, J.W.; Johnson, C.S.; Trump, D.L. Dexamethasone enhances 1α,25-Dihydroxyvitamin D3 effects by increasing Vitamin D receptor transcription. J. Biol. Chem. 2011, 286, 36228–36237. [Google Scholar] [CrossRef]
  19. Favus, M.J.; Kimberg, D.V.; Millar, G.N.; Gershon, E. Effects of cortisone administration on the metabolism and localization of 25-Hydroxycholecalciferol in the rat. J. Clin. Investig. 1973, 52, 1328–1335. [Google Scholar] [CrossRef]
  20. Kugai, N.; Koide, Y.; Yamashita, K.; Shimauchi, T.; Nagata, N.; Takatani, O. Impaired mineral metabolism in Cushing’s syndrome: Parathyroid function, vitamin D metabolites and osteopenia. Endocrinol. Jpn. 1986, 33, 345–352. [Google Scholar] [CrossRef]
  21. Aloia, J.F.; Roginsky, M.; Ellis, K.; Shukla, K.; Cohn, S. Skeletal metabolism and body composition in Cushing’s Syndrome. J. Clin. Endocrinol. Metab. 1974, 39, 981–985. [Google Scholar] [CrossRef]
  22. Findling, J.W.; Adams, N.D.; Lemann, J., Jr.; Gray, R.W.; Thomas, C.J.; Tyrrell, J.B. Vitamin D metabolites and parathyroid hormone in Cushing’s Syndrome: Relationship to calcium and phosphorus homeostasis. J. Clin. Endocrinol. Metab. 1982, 54, 1039–1044. [Google Scholar] [CrossRef] [PubMed]
  23. Seeman, E.; Kumar, R.; Hunder, G.G.; Scott, M.; Heath, H., 3rd; Riggs, B.L. Production, degradation, and circulating levels of 1,25-dihydroxyvitamin D in health and in chronic glucocorticoid excess. J. Clin. Investig. 1980, 66, 664–669. [Google Scholar] [CrossRef] [PubMed]
  24. Klein, R.G.; Arnaud, S.B.; Gallagher, J.C.; DeLuca, H.F.; Riggs, B.L. Intestinal calcium absorption in exogenous Hypercortisonism. J. Clin. Investig. 1977, 60, 253–259. [Google Scholar] [CrossRef] [PubMed]
  25. Chaiamnuay, S.; Chailurkit, L.-O.; Narongroeknawin, P.; Asavatanabodee, P.; Laohajaroensombat, S.; Chaiamnuay, P. Current daily glucocorticoid use and serum creatinine levels are associated with lower 25(OH) Vitamin D levels in Thai patients with systemic lupus erythematosus. JCR J. Clin. Rheumatol. 2013, 19, 121–125. [Google Scholar] [CrossRef]
  26. Slovik, D.M.; Neer, R.M.; Ohman, J.L.; Lowell, F.C.; Clark, M.B.; Segre, G.V.; Potts, J.T., Jr. Parathyroid hormone and 25-hydroxyvitamin D levels in glucocorticoid-treated patients. Clin. Endocrinol. 1980, 12, 243–248. [Google Scholar] [CrossRef]
  27. Lindgren, J.U.; Merchant, C.R.; DeLuca, H.F. Effect of 1,25-dihydroxyvitamin D3 on osteopenia induced by prednisolone in adult rats. Calcif. Tissue Res. 1982, 34, 253–257. [Google Scholar] [CrossRef]
  28. Corbee, R.; Tryfonidou, M.; Meij, B.; Kooistra, H.; Hazewinkel, H. Vitamin D status before and after hypophysectomy in dogs with pituitary-dependent hypercortisolism. Domest. Anim. Endocrinol. 2012, 42, 43–49. [Google Scholar] [CrossRef]
  29. Park, J.E.; Pichiah, P.T.; Cha, Y.-S. Vitamin D and metabolic diseases: Growing roles of Vitamin D. J. Obes. Metab. Syndr. 2018, 27, 223–232. [Google Scholar] [CrossRef]
  30. Medrano, M.; Carrillo-Cruz, E.; Montero, I.; Perez-Simon, J.A. Vitamin D: Effect on Haematopoiesis and immune system and clinical applications. Int. J. Mol. Sci. 2018, 19, 2663. [Google Scholar] [CrossRef]
  31. Fleseriu, M.; Auchus, R.; Bancos, I.; Ben-Shlomo, A.; Bertherat, J.; Biermasz, N.R.; Boguszewski, C.L.; Bronstein, M.D.; Buchfelder, M.; Carmichael, J.D.; et al. Consensus on diagnosis and management of Cushing’s disease: A guideline update. Lancet Diabetes Endocrinol. 2021, 9, 847–875. [Google Scholar] [CrossRef]
  32. Nieman, L.K.; Biller, B.M.K.; Findling, J.W.; Newell-Price, J.; Savage, M.O.; Stewart, P.M.; Montori, V. The diagnosis of Cushing’s Syndrome: An endocrine society clinical practice guideline. J. Clin. Endocrinol. Metab. 2008, 93, 1526–1540. [Google Scholar] [CrossRef] [PubMed]
  33. Expert Panel on Detection, Evaluation, Treatment of High Blood Cholesterol in Adults. Executive summary of the third report of the National Cholesterol Education Program (NCEP) expert panel on detection, evaluation, and treatment of high blood cholesterol in adults (Adult Treatment Panel III). JAMA 2001, 285, 2486–2497. [Google Scholar] [CrossRef] [PubMed]
  34. American Diabetes Association. Classification and diagnosis of diabetes: Standards of medical care in diabetes—2021. Diabetes Care 2021, 44 (Suppl. S1), S15–S33. [Google Scholar] [CrossRef] [PubMed]
  35. Guarnotta, V.; Amato, M.C.; Pivonello, R.; Arnaldi, G.; Ciresi, A.; Trementino, L.; Citarrella, R.; Iacuaniello, D.; Michetti, G.; Simeoli, C.; et al. The degree of urinary hypercortisolism is not correlated with the severity of cushing’s syndrome. Endocrine 2016, 55, 564–572. [Google Scholar] [CrossRef] [PubMed]
  36. Holick, M.F.; Binkley, N.C.; Bischoff-Ferrari, H.A.; Gordon, C.M.; Hanley, D.A.; Heaney, R.P.; Murad, M.H.; Weaver, C.M. Endocrine Society. Evaluation, treatment, and prevention of Vitamin D deficiency: An endocrine society clinical practice guideline. J. Clin. Endocrinol. Metab. 2011, 96, 1911–1930. [Google Scholar] [CrossRef]
  37. Fiebrich, H.-B.; Berg, G.V.D.; Kema, I.P.; Links, T.P.; Kleibeuker, J.H.; Van Beek, A.P.; Walenkamp, A.M.E.; Sluiter, W.J.; De Vries, E.G.E. Deficiencies in fat-soluble vitamins in long-term users of somatostatin analogue. Aliment. Pharmacol. Ther. 2010, 32, 1398–1404. [Google Scholar] [CrossRef]
  38. Matthews, D.R.; Hosker, J.P.; Rudenski, A.S.; Naylor, B.A.; Treacher, D.F.; Turner, R.C. Homeostasis model assessment: Insulin resistance and β-cell function from fasting plasma glucose and insulin concentrations in man. Diabetologia 1985, 28, 412–419. [Google Scholar] [CrossRef]
  39. Matsuda, M.; DeFronzo, R.A. Insulin sensitivity indices obtained from oral glucose tolerance testing: Comparison with the euglycemic insulin clamp. Diabetes Care 1999, 22, 1462–1470. [Google Scholar] [CrossRef]
  40. Utzschneider, K.M.; Prigeon, R.L.; Faulenbach, M.V.; Tong, J.; Carr, D.B.; Boyko, E.J.; Leonetti, D.L.; McNeely, M.J.; Fujimoto, W.Y.; Kahn, S.E. Oral disposition index predicts the development of future diabetes above and beyond fasting and 2-h glucose levels. Diabetes Care 2009, 32, 335–341. [Google Scholar] [CrossRef]
  41. Glendenning, P.; Zhu, K.; Inderjeeth, C.; Howat, P.; Lewis, J.R.; Prince, R.L. Effects of three-monthly oral 150,000 IU cholecalciferol supplementation on falls, mobility, and muscle strength in older postmenopausal women: A randomized controlled trial. J. Bone Miner. Res. 2011, 27, 170–176. [Google Scholar] [CrossRef]
  42. Kearns, M.D.; Alvarez, J.A.; Tangpricha, V. Large, single-dose, oral Vitamin D supplementation in adult populations: A systematic review. Endocr. Pract. 2014, 20, 341–351. [Google Scholar] [CrossRef] [PubMed]
  43. Lundqvist, J.; Norlin, M.; Wikvall, K. 1α,25-Dihydroxyvitamin D3 affects hormone production and expression of steroidogenic enzymes in human adrenocortical NCI-H295R cells. Biochim. Biophys. Acta 2010, 1801, 1056–1062. [Google Scholar] [CrossRef] [PubMed]
  44. Lemieux, P.; Weisnagel, S.J.; Caron, A.Z.; Julien, A.-S.; Morisset, A.-S.; Carreau, A.-M.; Poirier, J.; Tchernof, A.; Robitaille, J.; Bergeron, J.; et al. Effects of 6-month vitamin D supplementation on insulin sensitivity and secretion: A randomised, placebo-controlled trial. Eur. J. Endocrinol. 2019, 181, 287–299. [Google Scholar] [CrossRef] [PubMed]
  45. Li, Y.; Tong, C.H.; Rowland, C.M.; Radcliff, J.; Bare, L.A.; McPhaul, M.J.; Devlin, J.J. Association of changes in lipid levels with changes in vitamin D levels in a real-world setting. Sci. Rep. 2021, 11, 21536. [Google Scholar] [CrossRef] [PubMed]
  46. Dibaba, D.T. Effect of vitamin D supplementation on serum lipid profiles: A systematic review and meta-analysis. Nutr. Rev. 2019, 77, 890–902. [Google Scholar] [CrossRef] [PubMed]
  47. Povaliaeva, A.; Bogdanov, V.; Pigarova, E.; Zhukov, A.; Dzeranova, L.; Belaya, Z.; Rozhinskaya, L.; Mel’Nichenko, G.; Mokrysheva, N. Assessment of Vitamin D metabolism in patients with Cushing’s disease in response to 150,000 IU cholecalciferol treatment. Nutrients 2021, 13, 4329. [Google Scholar] [CrossRef]
Publisher’s Note: MDPI stays neutral with regard to jurisdictional claims in published maps and institutional affiliations.

A Case of Acute Exacerbation of Chronic Hepatitis C During the Course of Adrenal Cushing’s Syndrome

https://doi.org/10.1002/ccr3.5337

Abstract

A 50-year-old woman with adrenal Cushing’s syndrome and chronic hepatitis C developed an acute exacerbation of chronic hepatitis C before adrenectomy. After administration of glecaprevir/pibrentasvir was started, her transaminase levels normalized promptly and a rapid virological response also was achieved. Laparoscopic left adrenectomy was then performed safely.

1 INTRODUCTION

Reports of reactivation of hepatitis C virus (HCV) and acute exacerbation of chronic hepatitis C associated with immunosuppressive therapy and cancer drug therapy are rarer than for hepatitis B virus (HBV) but have been made occasionally. In HBV infection, viral reactivation and acute hepatitis caused by an excess of endogenous cortisol due to Cushing’s syndrome have been reported, but no acute exacerbation of chronic hepatitis C has been reported so far. Here, we report a case of acute exacerbation of chronic hepatitis C during the course of adrenal Cushing’s syndrome.

2 CASE REPORT

A woman in her 50s underwent a CT scan at a nearby hospital to investigate treatment-resistant hypertension and was found to have a left adrenal mass. Her blood tests showed low ACTH and HCV antibody positivity, and she was referred to our hospital because she was suspected of having Cushing’s syndrome and chronic hepatitis C. There is nothing special to note about her medical or family history. She had never smoked and drank very little. Her physical findings on admission were 164.5 cm tall, 92.6 kg in weight, and a BMI of 34.2 kg/m2. Her blood pressure was 179 / 73 mmHg, pulse 64 /min (rhythmic), body temperature 36.8°C, and respiratory rate 12 /min. She had findings of central obesity, moon face, buffalo hump, and red skin stretch marks. Her blood test findings (Table 1) showed an increase in ALT, HCV antibody positivity, and an HCV RNA concentration of 4.1 log IU/mL. The virus was genotype 2. Cortisol was within the reference range, but ACTH was as low, less than 1.5 pg/mL. Her bedtime cortisol level was 7.07 μg/dL, which was above her reference of 5 μg/dL, suggesting the loss of diurnal variation in cortisol secretion. Testing showed the amount of cortisol by 24-hour urine collection was 62.1 μg/day, and this level of cortisol secretion was maintained. In an overnight low-dose dexamethasone suppression test, cortisol after loading was 6.61 μg/dL, which exceeded 5 μg/dL, suggesting that cortisol was autonomously secreted. Her contrast-enhanced CT scan (Figure 1) revealed a tumor with a major axis of about 30 mm in her left adrenal gland. MRI scans showed mild hyperintensity in the “in phase” (Figure 2A) and decreased signal in the “out of phase” (Figure 2B), suggesting her adrenal mass was an adenoma. Based on the above test results, she was diagnosed with chronic hepatitis C and adrenal Cushing’s syndrome. She agreed to receive treatment with direct acting antiviral agents (DAAs) after resection of the left adrenal tumor. However, two months later, she had liver dysfunction with AST 116 U/L and ALT 213 U/L (Figure 3). HBV DNA was undetectable at the time of liver injury, but the HCV RNA concentration increased to 6.4 logIU/mL. Therefore, an acute exacerbation of chronic hepatitis C was suspected, and a percutaneous liver biopsy was performed. The biopsy revealed an inflammatory cell infiltration, mostly composed of lymphocytes and plasma cells and mainly in the portal vein area (Figure 4). Fibrosis and interface hepatitis were also observed, and spotty necrosis was evident in the hepatic lobule. No clear fat deposits were found in the hepatocytes, ruling out NASH or NAFLD. According to the New Inuyama classification, hepatitis equivalent to A2-3/F1-2 was considered. Because HBV DNA was not detected, no new drug was used, and no cause of liver damage, such as biliary atresia, was found; the patient was diagnosed with liver damage due to reactivation of HCV, with acute exacerbation of chronic hepatitis C. The treatment policy was changed, in order to treat hepatitis C before the left adrenal resection, and administration of glecaprevir/pibrentasvir was started. A blood test two weeks after the start of treatment confirmed normalization of AST and ALT, and a rapid virological response was achieved (Figure 3). Subsequently, HCV RNA remained negative, no liver damage was observed, and laparoscopic left adrenectomy was safely performed nine months after the initial diagnosis. The pathological findings were adrenal adenoma, and no atrophy was observed in the attached normal adrenal cortical gland. After the operation, hypertension improved and weight loss was obtained (92.6 kg (BMI: 34.2 kg/m2) before the operation, but 77.0 kg (BMI: 28.5 kg/m2) one year after the operation). ACTH increased, and the adrenal Cushing’s syndrome was considered to have been cured. Regarding HCV infection, the sustained virological response has been maintained to date, more than 2 years after the completion of DAA therapy, and the follow-up continues.

TABLE 1. Laboratory data on admission
Hematology Chemistry
WBC 6100 /μL TP 8.2 g/dL DHEA-S 48 /μL
RBC 526 x 104 /μL Alb 3.4 g/dL PRA 0.7 ng/mL/h
Hb 15.8 g/dL T-Bil 0.3 mg/dL ALD 189 pg/mL
Ht 49.1 % AST 33 U/L
PLT 25.5 x 104 /μL ALT 46 U/L Serological tests
LDH 201 U/L CRP <0.10 mg/dL
ALP 292 U/L HBsAg (-)
γ-GTP 77 U/L anti-HBs (-)
Coagulation BUN 13 mg/dL anti-HBc (+)
PT 126.1 % Cr 0.63 mg/dL HBeAg (-)
APTT 27.5 sec HbA1c 6.2 % anti-HBe (+)
Cortisol 7.46 μg/dL anti-HCV (+)
ACTH <1.5 pg/mL
FBS 82 mg/dL Genetic tests
Na 138 mmol/L HBV DNA Undetectable
Cl 105 mmol/L HCV RNA 4.1 LogIU/Ml
K 3.6 mmol/L HCV genotype 2
Ca 9.0 mg/dL
  • Abbreviations: Hematology: WBC, white blood cells; RBC, red blood cells; Hb, hemoglobin; Ht, hematocrit; PLT, platelets.
  • Coagulation: PT, prothrombin time; APTT, activated partial thromboplastin time.
  • Chemistry: TP, total protein; Alb, albumin; T-Bil, total bilirubin; AST, aspartate transaminase; ALT, alanine aminotransferase; LDH, lactate dehydrogenase; ALP, alkaline phosphatase; γGTP, γ-glutamyl transpeptidase; BUN, blood urea nitrogen; Cr, creatinine; HbA1c, Hemoglobin A1c; FBS, fasting blood sugar; Na, sodium; Cl, chlorine; K, potassium; Ca, calcium; DHEA-S, dehydroepiandrosterone sulfate; PRA, plasma renin activity; ALD, aldosterone.
  • Serological tests: CRP, C-reactive protein; HBsAg, hepatitis B surface antigen; anti-HBs, hepatitis B surface antibody; anti-HBc, hepatitis B core antibody; HBeAg, hepatitis B e antigen; anti-HBe, hepatitis B e antibody; anti-HCV, hepatitis C virus antibody.
  • Genetic tests: HBV DNA, hepatitis B virus deoxyribonucleic acid; HCV RNA, hepatitis C virus ribonucleic acid.

Details are in the caption following the image

Contrast-enhanced CT examination. Contrast-enhanced CT examination revealed a tumor (arrow) with a major axis of about 30 mm in the left adrenal gland

Details are in the caption following the image

MRI image of the adrenal lesion. MRI showed mild hyperintensity in the “in phase” (A) and decreased signal in the “out of phase” (B), suggesting adrenocortical adenoma (arrow)

Details are in the caption following the image

Changes in serum transaminase and HCV RNA levels. All showed rapid improvement by administration of direct acting antivirals. ALT: alanine aminotransferase, AST: aspartate transaminase, HCV RNA: hepatitis C virus ribonucleic acid

Details are in the caption following the image

Pathological findings of tissues obtained by percutaneous liver biopsy. Infiltration of inflammatory cells, which was mostly composed of lymphocytes and plasma cells and a small number of neutrophils, was observed mainly in the portal vein area. This was accompanied by fibrous enlargement and interface hepatitis. Although the arrangement of hepatocytes was maintained in the hepatic lobule, spotty necrosis was observed in some parts. No clear fat deposits were found in the hepatocytes, and NASH or NAFLD was a negative finding. According to the New Inuyama classification, hepatitis equivalent to A2-3/F1-2 was considered (a; ×100, b; ×200, scale bar = 500 µm)

3 DISCUSSION

Reactivation of HBV can cause serious liver damage. Therefore, it is recommended to check the HBV infection status before starting anticancer chemotherapy or immunotherapy and to continue monitoring for the presence or absence of reactivation thereafter.12 On the other hand, there are fewer reports of the reactivation of HCV, and many aspects of the pathophysiology of HCV reactivation remain unclear. In this case, it is possible that chronic hepatitis C was acutely exacerbated due to endogenous cortisol secretion in Cushing’s syndrome. Although the definition of HCV reactivation has not been defined, several studies35 have defined an increase of HCVRNA of 1.0 log IU/ml or more as HCV reactivation. In addition, the definition of acute exacerbation of chronic hepatitis C is that ALT increases to more than three times the upper limit of the reference range.346 Mahale et al. reported a retrospective study in which acute exacerbation of chronic hepatitis C due to cancer medication was seen in 11% of 308 patients.3 Torres et al. also reported that, in a prospective study of 100 patients with cancer medication, HCV reactivation was found in 23%.4 Given these reports, HCV reactivation potentially could occur quite frequently. However, Torres et al. reported that only 10% of all patients had acute exacerbations, none of which led to liver failure.4 Such data suggest that HCV reactivation may often be overlooked in actual cases without aggravation. Thus, the frequency of aggravation due to hepatitis virus reactivation is thought to be lower for HCV than for HBV. However, there are some reports of deaths from acute exacerbation of chronic hepatitis C.710 In addition, if severe hepatitis develops following viral reactivation, mortality rates have been reported to be similar for HBV and HCV.811 Thus, reactivation of HCV is considered to be a pathological condition that requires caution, similar to HBV. Torres et al. reported that administration of rituximab or corticosteroids is a significant independent risk factor.4 In addition, there are reports of acute exacerbation of chronic hepatitis C due to corticosteroids administered as antiemetics and as immunosuppressive therapy.1214 Therefore, excess cortisol can reactivate not only HBV but also HCV. The mechanism by which HCV is reactivated with cortisol is assumed to be decreased cell-mediated immunity due to rapid apoptosis of circulating T cells caused by glucocorticoids,4 enhancement of HCV infectivity by upregulation of viral receptor expression on the hepatocyte surface,15 and enhanced viral replication.16 In addition, there is a report that genotype 2 is more common in cases with acute exacerbation of chronic hepatitis C,413 which is consistent with this case.

Regarding HBV reactivation due to Cushing’s syndrome, three cases of acute exacerbation of chronic hepatitis B have been reported.1719 It is believed that Cushing’s syndrome caused a decrease in cell-mediated immunity and humoral immunity due to an endogenous excess of cortisol, resulting in an acute exacerbation of chronic hepatitis B.13 As described above, because an excess of cortisol can cause reactivation of HCV, it is considered that a decrease in immunocompetence due to Cushing’s syndrome, which is an excess of endogenous cortisol, can also cause reactivation of HCV and acute exacerbation of chronic hepatitis. However, as far as we can determine, no cases of Cushing’s syndrome causing HCV reactivation or acute exacerbation of chronic hepatitis C have been reported and similar cases may be latent. Among the reports of acute exacerbation of hepatitis B due to adrenal Cushing’s syndrome, there is a case in which the liver damage and viral load were improved only by adrenalectomy.17 Therefore, it is also possible that hepatitis C was improved by adrenal resection in this case. However, general anesthesia associated with adrenalectomy and the use of various drugs used for postoperative physical management should be avoided, if possible, in situations where some severe liver damage is present. In addition, reactivation of immunity due to rapid depletion of glucocorticoid, following resection of an adrenal tumor, may lead to exacerbation of liver damage. In this case, the amount of HCV and hepatic transaminase levels were improved rapidly by glecaprevir/pibrentasvir treatment, and the operation could be performed safely. If Cushing’s syndrome is complicated by an acute exacerbation of hepatitis C, clinicians should consider including treatment strategies such as in this case. Summarizing the above, when liver damage appears in HCV-infected patients with Cushing’s syndrome, it will be necessary to distinguish the acute exacerbation and reactivation of chronic hepatitis C. Treatment with DAAs may then be considered to be effective for reactivation of HCV and acute exacerbation of chronic hepatitis.

4 CONCLUSION

We report a case of chronic hepatitis C with acute exacerbation during the course of Cushing’s syndrome. At the time of cancer drug therapy and in the state of endogenous and extrinsic corticosteroid excess, it is necessary to pay attention not only to acute exacerbation of chronic hepatitis B but also to hepatitis C.

ACKNOWLEDGEMENTS

All authors would like to thank the patient and his family for allowing this case study.

CONFLICT OF INTEREST

The authors have no conflict of interests.

AUTHOR CONTRIBUTIONS

TO and KM were collected and analyzed the data and wrote and edited the manuscript. KH, ST, HO, KT, KM, and JK were involved in the patient’s care and provided advice on the preparation of this case report.

ETHICAL APPROVAL

This study complied with the standards of the Declaration of Helsinki and the current ethical guidelines.

CONSENT

Written informed consent was obtained from the patient to publish this report in accordance with the journal’s patient consent policy.

From https://onlinelibrary.wiley.com/doi/10.1002/ccr3.5337