Day 5, Cushing’s Awareness Challenge

In Day 9 on April 9, 2015, I wrote about how we got the Cushing’s colors of blue and yellow.  This post is going to be about the first Cushing’s ribbons.

I was on vacation  in September, 2001 when SuziQ called me to let me know that we had had our first Cushie casualty (that we knew about).

On the message boards, Lorrie wrote: Our dear friend, Janice died this past Tuesday, September 4, 2001. I received an IM from her best friend Janine, tonight. Janine had been reading the boards, as Janice had told her about this site, and she came upon my name and decided to IM me. I am grateful that she did. She said that she knew that Janice would want all of us to know that she didn’t just stop posting.

For all of the newcomers to the board that did not know Janice, she was a very caring individual. She always had something positive to say. Janice was 36 years old, was married and had no children. She had a miscarriage in December and began to have symptoms of Cushing’s during that pregnancy. After the pregnancy, she continued to have symptoms. When discussing this with her doctor, she was told that her symptoms were just related to her D&C. She did not buy this and continued until she received the accurate diagnosis of Cushing’s Syndrome (adrenal) in March of 2001. Tragically, Janice’s tumor was cancerous, a very rare form of Cushing’s.

Janice then had her tumor and adrenal gland removed by open adrenalectomy, a few months ago. She then began chemotherapy. She was very brave through this even though she experienced severe side effects, including weakness and dizziness. She continued to post on this board at times and even though she was going through so much, she continued with a positive attitude. She even gave me a referral to a doctor a few weeks ago. She was my inspiration. Whenever I thought I had it bad, I thought of what she was dealing with, and I gained more perspective.

Janice was having difficulty with low potassium levels and difficulty breathing. She was admitted to the hospital, a CT scan was done and showed tumor metastasis to the lungs. She then was begun on a more aggressive regimen of chemo. She was discharged and apparently seemed to be doing well.

The potassium then began to drop again, she spiked a temp and she was again admitted to the hospital. She improved and was set to be discharged and then she threw a blood clot into her lungs. She was required to be put on a ventilator. She apparently was at high risk for a heart attack. Her husband did not want her to suffer anymore and did not want her to suffer the pain of a heart attack and so chose for the doctors to discontinue the ventilator on Tuesday. She died shortly thereafter.

Janice was our friend. She was a Cushie sister. I will always remember her. Janine asked me to let her know when we get the Cushing’s ribbons made as she and the rest of Janice’s family would like to wear them in her memory. She said that Janice would want to do anything she could to make others more aware of Cushing’s.

The image at the top of the page shows the first blue and yellow ribbon which were worn at Janice’s funeral.  When we had our “official ribbons” made, we sent several to Janice’s family.

Janice was the first of us to die but there have been more, way too many more, over the years.  I’ll write a bit more about that on Day 21.

Cushing Syndrome due to a CRH- and ACTH-Secreting Silent Pheochromocytoma

Highlights

  • EAS should be considered in patients presenting with rapid progression of ACTH-dependent hypercortisolism causing severe clinical and metabolic abnormalities.
  • Ectopic ACTH secretion by a pheochromocytoma should be suspected in cases of ACTH-dependent Cushing syndrome in the presence of an adrenal mass.
  • If required, medical management with steroidogenesis inhibitors can be initiated at the time of EAS diagnosis to control clinical and metabolic derangements associated with severe hypercortisolemia
  • In patients with ACTH-dependent Cushing syndrome from an ectopic source, inhibiting steroidogenesis should be reserved for cases where the initial diagnosis is unclear or patients who are not suitable candidates for surgery.
  • Unilateral adrenalectomy is indicated in the management of ACTH/CRH-secreting pheochromocytomas and is typically curative.
  • Catecholamine blockade should be started prior to surgical removal of catecholamines-secreting pheochromocytomas.
  • A multidisciplinary approach is required to diagnose and manage this condition.

Abstract

Background/Objective

Ectopic co-secretion of corticotropin-releasing hormone (CRH) and adrenocorticotropic hormone (ACTH) in silent (i.e., noncatecholamine-secreting) pheochromocytoma is a rare cause of Cushing Syndrome (CS).

Case Report

A 57-year-old woman rapidly developed hypercortisolism, clinically manifesting as fatigue, muscle weakness, weight gain, and worsening hypertension, and biochemically characterized by hypokalemia and marked elevation of serum cortisol and plasma ACTH. This acute presentation suggested a diagnosis of ectopic ACTH syndrome (EAS). Imaging studies revealed a right adrenal mass that enhanced after administration of the radioisotope 68Ga-DOTATATE. Plasma metanephrines were normal in two separate measurements. The possibility of a silent pheochromocytoma was considered. After controlling her hypercortisolism with metyrapone and surgical preparation with alpha blockade, the patient underwent elective right adrenalectomy. Pathology revealed a pheochromocytoma that stained focally for ACTH and CRH. Postoperatively, cortisol levels normalized, the hypothalamic–pituitary–adrenal (HPA) axis was not suppressed, and clinical symptoms from hypercortisolism abated.

Discussion

Patients who exhibit a rapid progression of ACTH-dependent hypercortisolism should be screened for ectopic ACTH syndrome (EAS). The use of functional imaging radioisotopes (such as gallium DOTA-peptides), improves the detection of ACTH-secreting tumors. Preoperative treatment with steroidogenesis inhibitors helps control clinical and metabolic derangements associated with severe hypercortisolemia, while alpha blockade prevents the onset of an adrenergic crisis.

Conclusion

We present a rare case of EAS due to a silent pheochromocytoma that co-secreted ACTH and CRH. Pheochromocytoma should be considered in patients with EAS who have an adrenal mass even in the absence of excessive catecholamine secretion.

Key words

ectopic ACTH syndrome
Cushing Syndrome
non-catecholamine-secreting pheochromocytoma

Abbreviations

EAS

ectopic ACTH syndrome
CS

Cushing Syndrome
CRH

corticotropin-releasing hormone
ACTH

adrenocorticotropic hormone
DHEA-S

dehydroepiandrosterone sulfate
UFC

urine free cortisol
PRA

plasma renin activity

Introduction

Cushing Syndrome (CS) is rare, with an estimated incidence of 0.2-5.0 per million people per year, and prevalence of 39-79 per million (1). Ectopic ACTH Syndrome (EAS), a type of CS originating from extra-pituitary ACTH-secreting tumors, is uncommon. The prevalence of CS due to ACTH-secreting adrenal medullary lesions is not well established. However, EAS is observed in approximately 1.3% of all identified cases of pheochromocytoma (2). Recognizing EAS can be challenging due to its rarity, leading to delayed diagnosis.

Neuroendocrine neoplasms can produce CRH, which can lead to the secretion of ACTH by the pituitary. In certain cases, co-secretion of ACTH and CRH by an adrenal neoplasm has been observed. Only two published cases have provided definitive biochemical and immunohistochemical evidence of exclusive CRH secretion (3).

Case Report

A 57-year-old woman with a history of well-controlled hypertension sought care due to a two-month history of 60 lb weight gain, facial rounding, easy bruising, muscle weakness, lower extremity edema and acne. Her blood pressure control had worsened, and laboratory tests showed a markedly low serum potassium level of 1.8 mmol/L while taking hydrochlorothiazide. To manage her blood pressure, she was prescribed a calcium channel blocker, an angiotensin receptor blocker, and potassium supplements. However, her symptoms worsened, and she was referred to our emergency department. Blood pressure at presentation to our hospital was 176/86 mmHg. She had characteristic features of CS, including face rounding, supraclavicular fullness, dorsocervical fat accumulation, pedal edema, oral candidiasis, multiple forearm ecchymoses, and acneiform skin eruptions. No visible abdominal striae were present. She had no family history of pheochromocytoma, or multiple endocrine neoplasia type 2.

Serum cortisol level was 128 mcg/dL (normal range: 4.6-23.4) at 5 PM, with an ACTH level of 1055 pg/mL (normal range: 6-50); serum DHEA-S level was elevated at 445 mcg/dL (normal range: 8-188). Her 24-hour urine cortisol was at 12,566 mcg (normal range: 4.0-50.0). Plasma metanephrines were normal at <25 pg/mL (normal range: <57), and plasma normetanephrine was 44 (normal range: <148). A second plasma metanephrine measurement showed similar results. Serum aldosterone level and plasma renin activity were low at 2 ng/dL (normal range: 3-16) and 0.11 ng/mL/h (normal range: 0.25-5.82), respectively. Dopamine and methoxytyramine levels were not measured. An abdominal CT revealed a 4.8 x 4.5 x 5 cm right heterogeneously enhancing adrenal mass with a mean Hounsfield Unit of 68 in the non-contrast phase, and an absolute percentage washout of 30% (Fig 1A). The left adrenal gland appeared hyperplastic (Fig 1B). An Octreoscan, which was the in-hospital available nuclear medicine imaging modality, confirmed a 5.1 cm adrenal mass that was mild to moderately avid, with diffuse bilateral thickening of the adrenal glands and no other focal radiotracer avidity. A pituitary MRI did not show an adenoma, and EAS was suspected. Further evaluation with 68Ga-DOTATATE PET/CT (Fig 2) performed after her admission demonstrated an avid right adrenal mass consistent with a somatostatin receptor-positive lesion. No other suspicious tracer uptake was detected. These findings were consistent with a neuroendocrine tumor, such as pheochromocytoma.

  1. Download : Download high-res image (261KB)
  2. Download : Download full-size image

Fig. 1. Preoperative abdominal computed tomography scan showing a 4.8 x 4.5 x 5 cm right heterogeneously enhancing adrenal mass with irregular borders (A) and a hyperplastic left adrenal gland (B).

  1. Download : Download high-res image (219KB)
  2. Download : Download full-size image

Fig 2. 68Ga-DOTATATE PET/CT showing an avid right adrenal mass.

To control her symptoms while undergoing workup, the patient received oral metyrapone 500 mg thrice daily and oral ketoconazole 200 mg twice daily. Ketoconazole was stopped due to an increase in transaminases. The dosage of metyrapone was increased to 500 mg four times daily and later decreased to alternating doses of 250 mg and 500 mg four times daily. Within 3 weeks of starting medical therapy, serum cortisol level normalized at 20 mcg/dL. The 24-hour UFC improved to 246.3 mcg/24h. She experienced gradual improvement in facial fullness, acne, and blood pressure control.

The possibility of a silent pheochromocytoma was considered, and a-adrenergic blockade with doxazosin 1 mg daily was started 1 month prior surgery. She underwent surgery after two months of metyrapone therapy. With an unclear diagnosis and a large, heterogeneous adrenal mass, the surgical team elected to perform open adrenalectomy for en bloc resection due to concerns for an adrenal malignancy. The tumor was well-demarcated and did not invade surrounding structures (Figure 3A). H&E-stained sections showed classic morphologic features of a pheochromocytoma (Figure 3B), with immunohistochemistry demonstrating strong immunoreactivity for synaptophysin and chromogranin, and negative SF- I and inhibin stains excluding an adrenal cortical lesion. The sections analyzed by QuPath (4) revealed that approximately 4% of ce11s were ACTH cells, often found in isolation, and had a clear, high signal-to-noise staining (Figure 3C). CRH cells were less prevalent, comprising about 2.4% of the total analyzed cells, and tended to cluster together (Figure 3D). These cells had more background staining, resulting in a lower signal- to-noise ratio.

  1. Download : Download high-res image (663KB)
  2. Download : Download full-size image

Figure 3. Gross and Histopathological analysis of the patient’s pheochromocytoma. (A) Image of the gross excised specimen. (B) H&E staining (200x final magnification) demonstrates prominent vascularity and cells with finely granular, eosinophilic cytoplasm and salt-and-pepper chromatin. (C) ACTH staining (200x final magnification) shows clear and isolated positive cells, representing about 4.0% of the section analyzed by QuPath. (D) CRH staining (200x final magnification) reveals tight clusters of positive cells, accounting for 2.4% of the total cells. Positive (human placenta and hypothalamus) and negative (thyroid gland) control tissues performed as expected (data not shown).

The patient’s postoperative recovery was uneventful, with a short course of hydrocortisone which was stopped 1 week after surgery after HPA axis evaluation showed normal results. After one month, hypercortisolism had resolved, as shown by a normal 24-hour UFC at 28 mcg.

Administration of dexamethasone at 11 PM resulted in suppression of morning cortisol to 0.8 and 0.6 mcg/dL 1 and 7 months after surgery, respectively. Her liver function tests normalized, and blood pressure was well-controlled with amlodipine 10 mg daily and losartan 100 mg daily. Genetic testing for pheochromocytoma predisposition syndromes is currently planned.

Discussion

EAS accounts for 10-20% of cases of ACTH-dependent CS (5). This condition can be caused by several neuroendocrine neoplasms that produce bioactive ACTH (6) In the literature, we have found 99 documented cases of EAS caused by a pheochromocytoma. Of these, 93% showed ACTH expression. Only two cases have been reported with dual staining of ACTH and CRH (7). Exclusive CRH production has only been reported in two cases (8:9). However, the true prevalence of CRH-producing pheochromocytomas might be underestimated, as most cases testing for CRH expression was not performed.

Although the clinical presentation of EAS may be highly variable, there is often a rapid onset of hypercortisolism accompanied by severe catabolic symptoms. The diagnostic process should focus on identifying the location of a potential neuroendocrine neoplasm responsible for the ACTH secretion. Sometimes the peripheral origin of ACTH must be confirmed by inferior petrosal sinus sampling (IPSS). In this case, given the clinical presentation consistent with EAS, negative pituitary MRI, and the presence of an adrenal mass that needed to be removed independently, IPSS was not performed.

Neuroendocrine neoplasms express somatostatin receptors on their surface, which allow functional imaging using [11 lln]-pentetreotide (Octreoscan). However, Octreoscan has a low sensitivity in detecting occult EAS. In cases where the tumor is in the abdomen and pelvis, Octreoscan has limited utility in locating the source of ACTH (10). This increased risk of false negatives is caused by physiological tracer uptake by the liver, spleen, urinary tract, bowel, and gallbladder. The use of Gallium-68 labeled somatostatin receptor ligands (PET/CT 68Ga-DOTATATE) is more effective in detecting somatostatin receptors (SSTR2) than [11lln]-pentetreotide due to its higher spatial resolution and affinity (11)_ This test was performed after discharge form the hospital to rule out the presence of a second, smaller neuroendocrine tumor that the Octreoscan might have missed. A new molecular imaging technique targeting CRH receptors (68Ga CRH PET/CT) has shown potential in identifying tumors expressing CRH, but its availability remains limited (12). In our patient’s case, both the Octreoscan and 68Ga- DOTATATE successfully identified the adrenal tumor as a potential ACTH/CRH secretion source.

According to relevant guidelines, presurgical adrenergic blockade is recommended for patients with biochemical evidence of catecholamine excess (1314). Conversely, silent pheochromocytomas can generally be operated without alpha blockade (15). Despite this, we opted to administer pre-operative alpha blockade as a precautionary measure for this patient.

Pathology examination confirmed the diagnosis of pheochromocytoma. ACTH and CRH staining demonstrated that clear and significant populations of two separate ACTH and CRH positive cells were present in the excised pheochromocytoma. ACTH/CRH cells were dispersed throughout various regions of the pheochromocytoma rather than being well-defined, separate histological entities. As a result, there is no indication that this resulted from collision tumors, but rather random mutation and expansion of tumor cells into ACTH or CRH secreting cells. These results have limitations, including variation in ACTH and CRH expressing regions due to tumor heterogeneity, nonspecific binding of polyclonal antibodies, and normal low-rate false negative/positive detection using QuPath.

Post-surgical normal HPA activity was likely due to the de-suppression of the HPA axis by medical therapy, but it may also be explained by chronic stimulation of corticotroph cells induced by ectopic CRH secretion.

The standard approach to managing EAS involves surgical intervention. However, surgery may not be a viable option in cases where the source of ACTH production is unknown. Medical therapy to reduce or block excess cortisol can be used in such circumstances.

Conclusions

In conclusion, a pheochromocytoma causing EAS should be considered even in the absence of elevated plasma metanephrines. These tumors may simultaneously express ACTH and CRH.CRH.

References

Cited by (0)

Sources of support: None

Permission in the form of written consent from patient for use of actual test results was obtained.

Cushing in silent pheochromocytoma

Clinical Relevance

This case highlights the importance of considering ectopic ACTH secretion by a pheochromocytoma in patients presenting with rapid progression and considerable clinical hypercortisolism concomitant with an adrenal mass and elevated plasma ACTH. This represents an unusual manifestation of a specific subtype of ACTH/CRH-secreting pheochromocytoma that did not exhibit catecholamine secretion

The authors declare that they have no known competing financial interests or personal relationships that could have appeared to influence the work reported in this paper

These 2 authors contributed equally to this work

From https://www.sciencedirect.com/science/article/pii/S2376060524000075

Association Between Aldosterone and Hypertension Among Patients With Overt and Subclinical Hypercortisolism

Abstract

Introduction

Hypertension is one of the most common clinical features of patients with overt and subclinical hypercortisolism. Although previous studies have shown the coexistence of autonomous cortisol and aldosterone secretion, it is unclear whether aldosterone plays a role in hypertension among patients with hypercortisolism. Therefore, we examined the associations of plasma aldosterone concentrations (PACs) with hypertension among patients with overt and subclinical hypercortisolism.

Methods

This single-center retrospective cohort study included patients with adrenal tumor and serum cortisol levels after 1-mg dexamethasone suppression test >1.8 µg/dL (50 nmol/L). Using multivariable regression models adjusting for baseline characteristics, we investigated the association of PACs with systolic blood pressure and postoperative improvement of hypertension after the adrenalectomy.

Results

Among 89 patients enrolled in this study (median age, 51 years), 21 showed clinical signs of Cushing syndrome (overt hypercortisolism) and 68 did not show clinical presentations (subclinical hypercortisolism). We found that higher PACs were significantly associated with elevated systolic blood pressure among patients with subclinical hypercortisolism (adjusted difference [95% CI] = +0.59 [0.19-0.99], P = 0.008) but not among those with overt hypercortisolism. Among 33 patients with subclinical hypercortisolism and hypertension who underwent adrenalectomy, the postoperative improvement of hypertension was significantly associated with higher PACs at baseline (adjusted risk difference [95% CI] = +1.45% [0.35-2.55], P = 0.01).

Conclusion

These findings indicate that aldosterone may contribute to hypertension among patients with subclinical hypercortisolism. Further multi-institutional and population-based studies are required to validate our findings and examine the clinical effectiveness of the intervention targeting aldosterone for such patients.

Cortisol production in the adrenal gland is regulated by the hypothalamus-pituitary-adrenal (HPA) axis. Subclinical hypercortisolism is a status characterized by the alteration of HPA axis secretion without typical signs or symptoms of overt hypercortisolism (eg, moon face, truncal obesity, easy bruising, thin extremities, proximal myopathy, cutaneous purple striae) [12]. Although overt hypercortisolism can be detected by its clinical presentations or severe complications, it is sometimes challenging for clinicians to appropriately diagnose subclinical hypercortisolism because of the absence of such clinical presentations [2]. The 1-mg overnight dexamethasone suppression test (1-mg DST) measures the response of the adrenal glands to ACTH through the HPA axis and therefore has been widely used for screening and diagnosis of subclinical hypercortisolism [13]. The European Society of Endocrinology Guideline has defined a partial suppression of the HPA axis (ie, serum cortisol levels after 1-mg DST [F-DST] > 1.8 µg/dL [50 nmol/L]) without clinical signs of overt cortisol hypersecretion as “possible autonomous cortisol secretion” and recommended screening these patients for metabolic disorders including hypertension and type 2 diabetes mellitus to offer appropriate treatment of these comorbidities [4].

Hypertension is one of the most common and distinguishing clinical features in patients with subclinical hypercortisolism [2] as well as overt hypercortisolism [5]. Although hypertension can be triggered by excess cortisol levels [56], it is still unclear whether even slightly elevated cortisol levels among individuals with subclinical hypercortisolism contribute to the occurrence of hypertension. This raises another potential mechanism to cause hypertension such as the coexistence of hyperaldosteronism (ie, excess aldosterone that is an essential steroid hormone for sodium reabsorption, water retention, and blood pressure control) [7]. Previous studies have reported that 10% to 20% of primary aldosteronism is accompanied by cortisol-producing adenoma [8-10], and autonomous cortisol secretion was decreased after the resection of the aldosterone-producing adenoma (a subtype of primary aldosteronism) [11]. Furthermore, a previous mass spectrometry-based analysis revealed that cortisol secretion was frequently found in patients with primary aldosteronism [12]. Although these studies have examined cortisol biosynthesis in primary aldosteronism [13], evidence about whether aldosterone plays a role in the occurrence of hypertension among people with subclinical hypercortisolism is limited.

To address this knowledge gap, we performed a cohort study examining the association between aldosterone and hypertension among patients with adrenal tumor and F-DST >1.8 µg/dL, stratified by whether patients had clinical signs of Cushing syndrome or not. We first analyzed the cross-sectional association between aldosterone and blood pressure at baseline. Then, we analyzed the longitudinal association between aldosterone at baseline and the improvement rate of hypertension after the adrenalectomy. Last, to further clarify the role of aldosterone in the regulation of blood pressure in subclinical hypercortisolism, we described the difference in aldosterone response to ACTH after the adrenalectomy according to the postoperative improvement of hypertension.

Materials and Methods

Data Sources and Study Participants

A retrospective cohort study was designed to assess the clinical characteristics (focusing on aldosterone) among patients with hypercortisolism at the Yokohama Rosai Hospital from 2008 to 2017. We enrolled 89 patients with adrenal tumor and F-DST > 1.8 µg/dL (50 nmol/L) [3414]. We then categorized them into 2 groups: (1) overt hypercortisolism (F-DST > 5.0 µg/dL [138 nmol/L]) and having clinical signs of Cushing syndrome (moon face, central obesity, dorsocervical fat pad [buffalo hump], purple striae, thin skin, easy bruising, and proximal myopathy] [15]) and (2) subclinical hypercortisolism (not having such clinical signs). All patients with overt hypercortisolism in this study showed F-DST > 5.0 µg/dL (138 nmol/L). The study was approved by the research ethics committee of the Yokohama Rosai Hospital, and all participants provided written informed consent.

Measurements

Demographic characteristics were self-reported, and body mass index (BMI) was calculated using measured weight and height. Systolic blood pressure was measured in the sitting position using a standard upper arm blood pressure monitor after a 5-minute rest in a quiet place [16]. The mean of 2 measurements was recorded. If the measurement was done only once on a given occasion, the level obtained was recorded. When the patients were already taking antihypertensives at enrollment, they were asked to report their blood pressure levels at the diagnosis of hypertension (ie, systolic blood pressure before starting antihypertensives). Blood samples were collected at 8:00 AM after the patient had rested in the supine position for 30 minutes. We measured F (µg/dL, × 27.6 for nmol/L) and ACTH (pg/mL, × 0.220 for pmol/L) using chemiluminescent enzyme immunoassay and electrochemiluminescent immunoassay, respectively. Plasma aldosterone concentrations (PACs; ng/dL, × 27.7 for pmol/L) and plasma renin activities (PRAs; ng/mL/h) were measured using radioimmunoassay. Any antihypertensive drugs were replaced with calcium channel antagonists (including dihydropyridine calcium channel antagonists) and/or α blocker several weeks before the measurement of PACs and PRAs according to the clinical guideline of the Japan Endocrine Society [17]. We also measured urine aldosterone (µg/day × 2.77 for nmol/d) and urine cortisol (µg/day, × 2.76 for nmol/d) using radioimmunoassay. The tumor size was estimated using contrast-enhanced thin-section computed tomography scans of the adrenal glands.

To evaluate whether the patients had autonomous cortisol secretion, we performed 1-mg DST, in which dexamethasone (1 mg) was administered at 11:00 PM, and blood samples were drawn at 8:00 AM the following morning. F and ACTH were measured in 1-mg DST.

The total or partial adrenalectomy was performed in all cases with overt hypercortisolism. For patients with subclinical hypercortisolism, the adrenalectomy was recommended to those who showed F-DST > 5.0 µg/dL (138 nmol/L) accompanying metabolic disorders [3]. It was also recommended to those who were expected to improve their clinical symptoms and/or metabolic disorders by the tumor resection, which included patients with hypertension possibly resulting from autonomous aldosterone secretion as well as autonomous cortisol secretion from the adrenal gland. The adrenalectomy was conducted when patients agreed with the treatment plan through informed consent. To evaluate whether patients had autonomous aldosterone secretion, we used the screening criterion of primary aldosteronism (ie, PAC/PRA ratio; aldosterone-to-renin ratio [ARR] > 20), followed by the confirmatory tests of primary aldosteronism that included the saline infusion test, captopril challenge, and/or furosemide stimulation test [17].

For patients who were considered to receive a benefit by the adrenalectomy and who agreed with the examination, we performed the segment-selective adrenal venous sampling to assess the laterality of hyperaldosteronism [18-20]. First, blood samples were collected from the bilateral central adrenal veins before ACTH stimulation. Then, we collected samples from the superior, lateral, and inferior tributaries of the right central adrenal vein and the superior and lateral tributaries of the left central adrenal vein after ACTH stimulation. Aldosterone excess (ie, hyperaldosteronism) was considered when the effluent aldosterone concentrations were > 250 ng/dL before ACTH stimulation and 1400 ng/dL after ACTH stimulation, respectively [18-20]. We used the absolute value instead of the lateralization index because individuals included in our study had elevated cortisol concentrations given the inclusion criteria (ie, F-DST >1.8 µg/dL [50 nmol/L]). For 9 patients with subclinical hypercortisolism who showed bilateral adrenal nodules, the side of adrenalectomy was determined by the nodule size and the results of adrenal venous sampling (ie, laterality of hyperaldosteronism). The adrenalectomy was conducted when patients agreed with the treatment plan through informed consent. Immunohistochemical evaluation of aldosterone synthase cytochrome P450 (CYP11B2) was conducted for some resected nodules.

To evaluate the postoperative cortisol responsiveness to ACTH, we performed an ACTH stimulation test a year after the adrenalectomy, in which blood samples were collected and PAC and F were measured 30 and 60 minutes after ACTH administration. Postoperative improvement of hypertension was defined as blood pressure <140/90 mmHg without antihypertensives or the reduction of the number of antihypertensives to maintain blood pressure <140/90 mmHg after the adrenalectomy.

Statistical Analyses

We describe the demographic characteristics and endocrine parameters at baseline comparing patients with overt hypercortisolism and those with subclinical hypercortisolism using the Fisher exact test for categorical variables and Mann-Whitney U test for continuous variables. Second, for each group, we investigated the association between the baseline characteristics and systolic blood pressure using ordinary least-squares regression models. The model included age, sex, BMI, serum potassium levels, estimated glomerular filtration rate, tumor size, and F and PAC at 8:00 AM. Third, we estimated the risk difference and 95% CI of the improvement rate of hypertension after the adrenalectomy according to these baseline characteristics (including systolic blood pressure) using a modified least-squares regression model with a Huber-White robust standard error [21]. Last, to evaluate whether the improvement of hypertension is related to postoperative cortisol and aldosterone secretion, we compared PAC and F responsiveness to ACTH from peripheral blood samples between patients who improved hypertension and those who did not using the Mann-Whitney U test. The longitudinal and postoperative analyses were performed among patients with subclinical hypercortisolism because only 2 cases with overt hypercortisolism failed to show the improvement of hypertension after the adrenalectomy.

To assess the robustness of our findings, we conducted the following 2 sensitivity analyses. First, we replaced F at 8:00 AM with F after DST in our regression models. Second, we estimated the risk difference of the improvement rate of hypertension after the adrenalectomy according to the postoperative F and PAC levels after ACTH stimulation, adjusting for the baseline characteristics included in our main model.

We also conducted several additional analyses. First, to investigate the relationship of change in PAC after adrenalectomy with the improvement rate of hypertension, we included decrease in PAC between before and after adrenalectomy instead of PAC at baseline in the model. Second, to assess the relationship between aldosterone and hypertension among patients with subclinical hypercortisolism without primary aldosteronism, we reran the analyses excluding patients who met the diagnostic criteria of primary aldosteronism. Third, to understand the overall association, we reran the analyses using all samples as a single group to assess the relationship among people with overall (ie, overt and subclinical) hypercortisolism. Last, we compared PAC and F responsiveness with ACTH during adrenal venous sampling between patients with and without postoperative improvement of hypertension. All statistical analyses were performed using Stata, version 15.

Results

Among the 89 enrolled patients, 21 showed clinical signs of overt Cushing syndrome and 68 did not. The flow of the study population is shown in Fig. 1. Among 21 patients with overt hypercortisolism, 19 patients had hypertension. All patients underwent adrenalectomy, and 16 patients showed improved hypertension levels after the surgery (1 patient was referred to another hospital; therefore, no information is available). Among 68 patients with subclinical hypercortisolism, 63 had hypertension. After the evaluation of autonomous aldosterone secretion as well as autonomous cortisol secretion, of 33 patients who underwent adrenalectomy, 23 (70%) showed improved hypertension levels after the adrenalectomy (10 patients in the surgery group decided not to undergo adrenalectomy). Patients with subclinical hypercortisolism who underwent adrenalectomy showed lower PRA and higher ARR than those without adrenalectomy (Supplementary Table S1) [22].


Figure 1.

Enrollment and follow-up of the study population after the adrenalectomy. aThe prevalence of patients with overt hypercortisolism and hypertension among this study population may be higher than in the general population and therefore needs to be carefully interpreted given that the study institute is one of the largest centers for adrenal diseases in Japan. bAll patients in this category showed autonomous cortisol secretion (ie, serum cortisol levels >5.0 µg/dL [138 nmol/L] after a 1-mg dexamethasone suppression test). cOne case underwent adrenalectomy at another hospital and therefore no information was available after the adrenalectomy. dThe adrenalectomy was performed for 33 patients who were expected to improve their clinical symptoms and/or metabolic disorders, including hypertension. This assessment was mainly based on autonomous cortisol secretion evaluated by a 1-mg dexamethasone suppression test, complicated metabolic disorders, and autonomous aldosterone secretion evaluated by adrenal venous sampling for patients who were positive for the screening and confirmatory tests of primary aldosteronism. Details in the assessment can be found in the Methods section or elsewhere [18-20].

Demographic Characteristics and Endocrine Parameters Among Patients With Overt and Subclinical Hypercortisolism

The median age (interquartile range) was 51 years (46, 62 years), and 72% were female. Patients with overt hypercortisolism were relatively younger and showed a higher estimated glomerular filtration rate and larger tumor size compared with patients with subclinical hypercortisolism (Table 1). Other demographic characteristics were similar between these groups. Patients with overt hypercortisolism showed higher F with undetected low ACTH, higher F after DST, and higher urine cortisol levels compared with those with subclinical hypercortisolism who instead showed higher PAC and ARR. Among patients with subclinical hypercortisolism, 9/68 (13.2%) showed undetectable ACTH levels and 25/68 (36%) were positive for PA screening criterion (ie, ARR > 20) followed by at least 1 positive confirmatory test. Based on the results of adrenal venous sampling of these cases, 9 showed aldosterone excess in the right nodules, 6 showed aldosterone excess in the left nodules, and 7 showed aldosterone excess on both sides, respectively (3 cases did not show aldosterone excess on both sides). Immunohistochemical evaluation of CYP11B2 was examined for 6 resected adrenal glands, and all of them showed positive expression.


Patients’ characteristicsa Patients with overt hypercortisolism (N = 21) Patients with subclinical hypercortisolism (N = 68) P
Age, y 46 [38-52] 54 [47-63] 0.002
Female, n (%) 18 (85.7) 46 (67.7) 0.11
Body mass index, kg/m2 23.4 [20.6-26.2] 23.1 [21.7-25.1] 0.94
Systolic blood pressure, mm Hg 156 [140-182] 162 [151-191] 0.29
Diastolic blood pressure, mm Hg 98 [92-110] 100 [90-110] 0.73
Serum potassium, mEq/Lb 3.9 [3.5-4.0] 3.8 [3.6-4.0] 0.98
eGFR, mL/min/1.73 m2 86.7 [77.3-123.0] 82.1 [69.8-87.7] 0.02
Tumor size by CT scan, mm 28 [25-30] 22 [17-26] 0.001
ACTH, 8:00 AM − c 6.6 [2.4-11.8]
F, 8:00 AM 16.6 [12.5-18.8] 9.5 [7.7-12.0] <0.001
PRA, 8:00 AM 0.7 [0.4-1.3] 0.5 [0.2-1.0] 0.10
PAC, 8:00 AM 8.3 [7.2-9.8] 9.2 [7.2-16.2] 0.09
ARR, 8:00 AM 10.0 [6.4-16.7] 21.0 [9.8-46.5] 0.02
F after DST 16.5 [14.4-18.7] 5.1 [3.2-7.5] <0.001
Urine cortisol 220.0 [105.0-368.0] 49.5 [37.4-78.5] <0.001
Urine aldosterone 5.7 [3.9-10.1] 7.2 [4.8-13.1] 0.16

Conversion to SI units: ACTH, pg/mL × 0.220 for pmol; F, µg/dL × 27.6 for nmol/L; PAC, ng/dL × 27.7 for pmol/L; urine aldosterone, μg/day × 2.77 for nmol/d; Urine cortisol, μg/day × 2.76 for nmol/d.

Abbreviations: ARR, aldosterone-to-renin ratio; CRH, corticotropin-releasing hormone; CT, thin-section computed tomography; DST, 1-mg dexamethasone suppression test; eGFR, estimated glomerular filtration rate; F, serum cortisol; PRA, plasma renin activity; PAC, plasma aldosterone concentration.

aData are presented as median (interquartile range) or count (proportions) unless otherwise indicated.

bSerum potassium levels were controlled using potassium supplement/tablets at enrollment.

cUndetected in all cases.

Association of Demographic Characteristics and Endocrine Parameters With Systolic Blood Pressure

Among patients with overt hypercortisolism, we did not find a significant association of demographic characteristics and endocrine parameters with systolic blood pressure (Table 2). However, among patients with subclinical hypercortisolism, we found that higher PACs at 8:00 AM were significantly associated with systolic blood pressure (adjusted coefficient [95% CI] = +0.59 [0.19-0.99], P = 0.008). The results did not change when we used F after DST instead of F at 8:00 AM (Supplementary Table S2) [22].

Table 2.

Cross-sectional association of demographic characteristics and endocrine parameters with systolic blood pressure among patients with overt and subclinical hypercortisolism

Outcome Systolic blood pressure at baseline
Groups Patients with overt hypercortisolism Patients with subclinical hypercortisolism
Parameters Adjusted coefficient (95% CI) P Adjusted coefficient (95% CI) P
Age, y +1.73 (0.17-3.30) 0.03 +0.49 (−0.13 to 1.10) 0.12
Female −7.48 (−76.75 to 61.79) 0.81 +15.38 (−0.83 to 31.59) 0.06
Body mass index +5.47 (−2.4 to 13.33) 0.15 +1.07 (−0.49 to 2.63) 0.17
Serum potassium +11.29 (−23.42 to 45.99) 0.48 −9.61 (−26.38 to 7.15) 0.26
eGFR −0.12 (−1.00 to 0.77) 0.77 −0.44 (−0.89 to 0.01) 0.06
Tumor size −2.39 (−6.92 to 2.14) 0.26 +0.40 (−0.46 to 1.26) 0.35
F, 8:00 AMa,b +1.96 (−1.27 to 5.18) 0.20 +1.26 (−1.00 to 3.52) 0.27
PAC, 8:00 AMa −2.86 (−7.38 to 1.66) 0.18 +0.59 (0.19-0.99) 0.008

Abbreviations: DST, 1-mg dexamethasone suppression test; eGFR, estimated glomerular filtration rate; F, serum cortisol; PRA, plasma renin activity; PAC, plasma aldosterone concentration.

aACTH and PRA were not included in the main model because they have strong correlation with F and PAC, respectively (ie, multicollinearity). The results did not change when additionally adjusting for ACTH and PRA.

bThe results did not change when we replaced F at 8:00 AM with F after DST (Supplementary Table S2).

Association of Demographic Characteristics and Endocrine Parameters With Hypertension Improvement After the Adrenalectomy Among Patients With Subclinical Hypercortisolism

Among 33 patients with subclinical hypercortisolism and hypertension who underwent the adrenalectomy, we found that age and higher PAC were significantly associated with a higher improvement rate of hypertension after the adrenalectomy (age, adjusted risk difference [95% CI] = +2.36% [1.08-3.64], P = 0.001; PAC, adjusted risk difference [95% CI] = +1.45% [0.35-2.55], P = 0.01; Table 3). The results did not change when we used F after DST instead of F at 8:00 AM (Supplementary Table S3) [22]. Patients with improved hypertension after the surgery showed significantly lower PACs 60 minutes after a postoperative ACTH stimulation test than those without the improvement of hypertension (P = 0.05), although F and PAC/F ratio were not significantly different between these 2 groups (Table 4). The association between lower PACs after postoperative ACTH stimulation and higher improvement rate of hypertension was also found in the multivariable regression analysis adjusting for baseline characteristics (adjusted risk difference [95% CI] = −1.08% [−1.92 to −0.25], P = 0.01; Supplementary Table S4) [22].

Table 3.

Longitudinal association of demographic characteristics and endocrine parameters with hypertension improvement after the adrenalectomy among patients with subclinical hypercortisolisma

Outcome Hypertension improvement after the adrenalectomy
Parameters Adjusted risk difference (95% CI) P
Age +2.36% (1.08-3.64) 0.001
Sex (female) −11.32% (−61.37 to 38.73) 0.64
Body mass index −5.08% (−10.29 to 0.13) 0.06
Systolic blood pressure −0.67% (−1.77 to 0.43) 0.22
Serum potassium −0.06% (−31.84 to 31.71) 1.00
eGFR +0.53% (−0.36 to 1.42) 0.23
Tumor size +0.79% (−1.35 to 2.93) 0.45
F, 8:00 AMb,c −2.81% (−7.43 to 1.81) 0.22
PAC, 8:00 AMb +1.45% (0.35-2.55) 0.01

Abbreviations: eGFR, estimated glomerular filtration rate; F, serum cortisol; PRA, plasma renin activity; PAC, plasma aldosterone concentration.

aAnalysis was not performed for patients with overt hypercortisolism because only 2/18 cases failed to show improved hypertension after the adrenalectomy.

bACTH and PRA were not included in the main model because they have strong correlation with F and PAC, respectively (ie, multicollinearity). The results did not change when additionally adjusting for ACTH and PRA.

cThe results did not change when we replaced F at 8:00 AM with F after DST (Supplementary Table S3).


Table 4.

Aldosterone and cortisol response to ACTH a year after the adrenalectomy according to hypertension improvement status among patients with subclinical hypercortisolisma

Outcome: hypertension improvement status after the adrenalectomy Improvement (+) (N = 23) Improvement (−) (N = 10)
Parameters Median [IQR] Median [IQR] P
PAC 60 min after ACTH stimulation 13.6 [10.0-16.7] 15.5 [13.7-43.1] 0.05b
F 60 min after ACTH stimulation 16.9 [13.7-20.6] 18.5 [13.5-24.7] 0.61
PAC/F ratio 60 min after ACTH stimulation 0.70 [0.52-1.39] 1.27 [0.50-5.44] 0.26

Conversion to SI units: F, µg/dL × 27.6 for nmol/L; PAC, ng/dL × 27.7 for pmol/L.

Abbreviations: F, serum cortisol; PAC, plasma aldosterone concentration.

aAnalysis was not performed for patients with overt hypercortisolism because only 2/18 cases failed to show improved hypertension after the adrenalectomy.

bThe association was also observed after adjusting for baseline characteristics (eg, age, sex, body mass index, systolic blood pressure, serum potassium, estimated glomerular filtration rate, tumor size) and F 60 min after ACTH stimulation a year after the adrenalectomy (Supplementary Table S4).

Additional Analyses

Decreased PAC between before and after adrenalectomy was significantly associated with hypertension improvement (Supplementary Table S5) [22]. When we restricted samples to those without primary aldosteronism, PACs at baseline tended to be associated with systolic blood pressure but the 95% CI included the null (Supplementary Table S6) [22]. Decreased PAC after adrenalectomy was associated with hypertension improvement after the adrenalectomy, whereas PAC at baseline was not associated with that outcome (Supplementary Table S7) [22]. When we analyzed the entire sample (ie, both overt and subclinical hypercortisolism), PAC at baseline was associated with systolic blood pressure at baseline (Supplementary Table S8) [22] and hypertension improvement after the adrenalectomy (Supplementary Table S9) [22]. We also found the higher median value of PAC response to ACTH during adrenal venous sampling at the remained (ie, not resected by the adrenalectomy) side of adrenal gland among patients whose hypertension did not improve compared with those whose hypertension improved after the surgery, but the difference was not statistically significant (Supplementary Table S10) [22].

Discussion

In this retrospective cohort study, we found that higher aldosterone levels were associated with higher systolic blood pressure among patients with possible autonomous cortisol secretion and without clinical signs of overt Cushing syndrome (ie, subclinical hypercortisolism). In this group, higher aldosterone before the adrenalectomy was associated with the postoperative improvement of hypertension. Moreover, we found that patients with postoperative improvement of hypertension showed lower aldosterone response to ACTH after the adrenalectomy compared with those without the improvement of hypertension. Decrease in PACs after the adrenalectomy was associated with improved hypertension even among patients with subclinical hypercortisolism who did not have primary aldosteronism at baseline, whereas baseline PAC was not associated with that outcome. We found no evidence that aldosterone is associated with systolic blood pressure among patients with overt hypercortisolism. These findings indicate that elevated aldosterone may contribute to the presence of hypertension and its improvement rate after the adrenalectomy for patients with subclinical hypercortisolism.

To the best of our knowledge, this is one of the first studies to assess the potential role of aldosterone in hypertension among patients with overt and subclinical hypercortisolism, during both pre- and postoperative phases. Since aldosterone- and cortisol-producing adenoma was reported in 1979 [2324], several studies have assessed the cortisol production in aldosterone-producing adenoma clinically and histologically [8-1025] and showed the correlation between the degree of glucocorticoid excess levels and metabolic markers including BMI, waist circumference, blood pressure, insulin resistance, and high-density lipoprotein [12]. Prior research suggested that aldosterone-producing adenoma might produce cortisol as well as aldosterone even when serum cortisol levels after DST is less than 1.8 µg/dL (50 nmol/L) [11]. Although these studies have focused on cortisol synthesis among patients with aldosterone-producing adenoma, little is known about aldosterone synthesis among patients with cortisol-producing adenoma. Given that patients with hypercortisolism tend to have therapy-resistant hypertension and electrolyte disorders [8], our findings may generate the hypothesis that aldosterone contributes to the incidence and severity of hypertension in patients with possible autonomous cortisol secretion; this warrants further investigation.

There are several mechanisms by which cortisol excess leads to hypertension, such as regulating endothelial nitric oxide synthase expression modulated by 11β-hydroxysteroid dehydrogenases [26], activating the mineralocorticoid receptor [27] and upregulating vascular endothelin-1 [28]. Moreover, hypercortisolism impairs the production of endothelial vasodilators, including prostacyclin, prostaglandins, and kallikreins [29]. Despite these potential mechanisms, the direct effect of cortisol may not be sufficient to explain hypertension in patients with hypercortisolism, particularly subclinical hypercortisolism, and the presence of cortisol and aldosterone coproducing adenoma indicates another potential pathway to induce hypertension through aldosterone excess. Aldosterone is a steroid hormone not only promoting sodium reabsorption and volume expansion but also activating the mineralocorticoid receptor in the kidney and nonepithelial tissues (eg, adipose tissue, heart, endothelial cells, and vascular smooth muscle cells) [30]. It also induces oxidative stress, inflammation, fibrosis, vascular tone, and endothelial dysfunction [31]; therefore, aldosterone excess could induce hypertension even when it is slightly elevated [32]. A recent multiethnic study showed that aldosterone levels within the reference range were associated with subclinical atherosclerosis partially mediated through elevated blood pressure [33]. These mechanisms support our results indicating the potential contribution of aldosterone to hypertension among patients with subclinical hypercortisolism.

This study had several limitations. First, we did not have information on the duration of cortisol excess and therefore the estimated effect of cortisol on hypertension in our study might have been underestimated. The duration of exposure to mild hypercortisolism may be one of the important drivers of cardiovascular and metabolic disorders including irreversible vasculature remodeling in patients with subclinical hypercortisolism [2]. Second, we did not have the genetic information of adrenal tumors including aldosterone-producing adenoma. Given the heterogeneity of aldosterone responsiveness to ACTH [34] and postoperative hypertension resolution rate across genetic mutations (eg, KCNJ5, ATP1A1, ATP2B3, CACNA1D, CTNNB1) [35], such information might affect our findings. Third, because of the nature of an observational study, we cannot rule out the unmeasured confounding. Fourth, because aldosterone and cortisol levels were measured at a single point, we may have a risk of mismeasurement. Moreover, when evaluating aldosterone levels, we used dihydropyridine calcium channel blockers to control hypertension based on the clinical guideline of primary aldosteronism in Japan; this might lower serum aldosterone levels. Fifth, because the present study was conducted at a single center, selection bias is inevitable [13]. Given that primary aldosteronism—one of the major causes of secondary hypertension—has still been underdiagnosed, partially because of insufficient recognition of clinical guidelines [36], our findings may indicate the importance of considering aldosterone when evaluating patients with subclinical hypercortisolism accompanied by hypertension. However, we need to carefully interpret the observed “prevalence” in this study because individuals potentially having subclinical hypercortisolism were likely to come to our hospital, which specializes the adrenal disorders, and thus the numbers do not reflect the prevalence in general population. The small number of resected adrenal glands with the evaluation of CYP11B2 expression in this study cohort also limits the prevalence estimation of primary aldosteronism. Finally, as we only followed up 1 year after the adrenalectomy, we could not evaluate the long-term resolution rate of hypertension. To overcome these limitations and generalize our findings, future molecular studies and multicenter longitudinal studies with sufficient individual datasets and longer follow-up are required.

In conclusion, plasma aldosterone concentrations were associated with systolic blood pressure and improvement rate of hypertension after the adrenalectomy among patients with subclinical hypercortisolism—possible autonomous cortisol secretion without clinical signs of overt Cushing syndrome. Our findings underscore the importance of considering aldosterone when patients have an adrenal tumor with possible autonomous cortisol secretion complicated with hypertension. Future molecular and epidemiological studies are warranted to identify the potential role of aldosterone in hypertension among patients with subclinical hypercortisolism, clarify how often these patients also have primary aldosteronism, and examine the clinical effectiveness of the intervention targeting aldosterone for such patients.

Funding

K.I. was supported by the Japan Society for the Promotion of Science (JSPS; 21K20900 and 22K17392) and The Japan Endocrine Society. Study sponsors were not involved in study design, data interpretation, writing, or the decision to submit the article for publication. The funders had no role in the design and conduct of the study; collection, management, analysis, and interpretation of the data; preparation, review, or approval of the manuscript; and decision to submit the manuscript for publication.

Conflicts of Interest

All of authors confirm that there is no conflict of interest in relation to this work.

Data Availability

Restrictions apply to the availability of some data generated or analyzed during this study to preserve patient confidentiality or because they were used under license. The corresponding author will on request detail the restrictions and any conditions under which access to some data may be provided.

Abbreviations


  • ARR

    aldosterone-to-renin ratio

  • BMI

    body mass index

  • DST

    dexamethasone suppression test

  • F

    serum cortisol level

  • HPA

    hypothalamus-pituitary-adrenal

  • PAC

    plasma aldosterone concentration

  • PRA

    plasma renin activity

© The Author(s) 2022. Published by Oxford University Press on behalf of the Endocrine Society.
This is an Open Access article distributed under the terms of the Creative Commons Attribution-NonCommercial-NoDerivs licence (https://creativecommons.org/licenses/by-nc-nd/4.0/), which permits non-commercial reproduction and distribution of the work, in any medium, provided the original work is not altered or transformed in any way, and that the work is properly cited. For commercial re-use, please contact journals.permissions@oup.com
© The Author(s) 2022. Published by Oxford University Press on behalf of the Endocrine Society.

Characterization of Adrenal miRNA-Based Dysregulations in Cushing’s Syndrome

Abstract

MiRNAs are important epigenetic players with tissue- and disease-specific effects. In this study, our aim was to investigate the putative differential expression of miRNAs in adrenal tissues from different forms of Cushing’s syndrome (CS). For this, miRNA-based next-generation sequencing was performed in adrenal tissues taken from patients with ACTH-independent cortisol-producing adrenocortical adenomas (CPA), from patients with ACTH-dependent pituitary Cushing’s disease (CD) after bilateral adrenalectomy, and from control subjects. A confirmatory QPCR was also performed in adrenals from patients with other CS subtypes, such as primary bilateral macronodular hyperplasia and ectopic CS. Sequencing revealed significant differences in the miRNA profiles of CD and CPA. QPCR revealed the upregulated expression of miR-1247-5p in CPA and PBMAH (log2 fold change > 2.5, p < 0.05). MiR-379-5p was found to be upregulated in PBMAH and CD (log2 fold change > 1.8, p < 0.05). Analyses of miR-1247-5p and miR-379-5p expression in the adrenals of mice which had been exposed to short-term ACTH stimulation showed no influence on the adrenal miRNA expression profiles. For miRNA-specific target prediction, RNA-seq data from the adrenals of CPA, PBMAH, and control samples were analyzed with different bioinformatic platforms. The analyses revealed that both miR-1247-5p and miR-379-5p target specific genes in the WNT signaling pathway. In conclusion, this study identified distinct adrenal miRNAs as being associated with CS subtypes.

1. Introduction

Cushing’s syndrome (CS) results from the excessive secretion of cortisol, leading to visceral obesity, resistance to insulin, osteoporosis, and altered lipid and glucose metabolism [1,2]. Excessive production of cortisol by the adrenal glands can be either ACTH-dependent or -independent. In the majority of patients, hypercortisolism is due to ACTH secretion by corticotroph adenomas of the pituitary gland (Cushing’s disease, CD) or by ectopic tumors [3]. Approximately 20% of cases are ACTH-independent, where cortisol is secreted autonomously by the adrenal cortex. The pathology of ACTH-independent cases is diverse; they are most often caused by unilateral cortisol-producing adrenocortical adenomas (CPA). Rare causes are cortisol-secreting adrenocortical carcinomas (ACC), primary bilateral macronodular adrenocortical hyperplasia (PBMAH), bilateral CPAs, and primary pigmented nodular adrenal disease (PPNAD) [4,5]. Irrespective of the subtype, prolonged exposure to cortisol in CS is associated with increased mortality and cardiovascular morbidity in its patients [6]. Treatment is based on the underlying cause of hypercortisolism, with pituitary surgery or adrenalectomy being the preferred choice. Medical therapy options in CS are few and consist of pituitary-directed drugs, steroid synthesis inhibitors, and glucocorticoid receptor antagonists [7]. For the timely diagnosis and targeted management of CS and its subtypes, a comprehensive understanding of cortisol secretion, in terms of canonical signaling pathways as well as upstream epigenetic factors, is needed.
MiRNA molecules have emerged as key epigenetic players in the transcriptional regulation of cortisol production. Briefly, the deletion of Dicer in adrenals, a key miRNA processing enzyme, revealed diverse expression changes in miRNAs along with related changes in steroidogenic enzymes such as Cyp11b1 [8]. Furthermore, key enzymes in the cortisol biosynthesis pathway, namely Cyp11a1, Cyp21a1, Cyp17a1, Cyp11b1, and Cyp11b2, were also found to be regulated by various miRNAs (miRNA-24, miRNA-125a-5p, miRNA-125b-5p, and miRNA-320a-3p) in in vitro studies [9]. Consequently, various studies have also characterized miRNA expression profiles in CS subtypes. Importantly, miRNA expression in the corticotropinomas of CD patients was found to vary according to USP8 mutation status [10]. Other studies have also identified specific miRNA candidates and associated target genes in the adrenals of patients with PPNAD [11], PBMAH [12,13], and massive macronodular adrenocortical disease [14]. Interestingly, no common miRNA candidates were found among these studies, indicating the specificity of miRNAs to the different underlying pathologies in CS.
There are limited studies directly comparing miRNA expression profiles of ACTH-dependent and ACTH-independent CS patients. Consequently, in our previous study, we found differences in expression profiles when comparing circulating miRNAs in CD and CPA patients [15]. We hypothesized that the presence of ACTH possibly influences the miRNA profile in serum due to the upstream differential expression in the origin tissues. In this study, we aim to further explore this hypothesis by comparing the miRNA expression profile of adrenal tissues in ACTH-dependent and ACTH-independent CS. In brief, miRNA specific sequencing was performed in two prevalent subtypes of CS: in CD, the most prevalent ACTH-dependent form; and in CPA, the most prevalent ACTH-independent form. Specific miRNA candidates related to each subtype were further validated in other forms of CS. To further investigate our hypothesis, the response of miRNA candidates following ACTH stimulation was assessed in mice, and the expression of miRNAs in murine adrenals was subsequently investigated. Finally, an extensive targeted gene analysis was performed based on in silico predictions, RNA-seq data, and luciferase assays.

2. Results

2.1. Differentially Expressed miRNAs

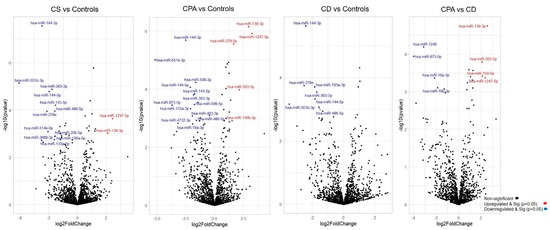
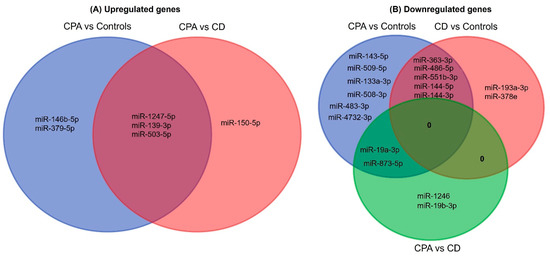
NGS revealed differentially expressed miRNAs between the different groups analyzed (Figure 1). CD and CPA taken together as CS showed a differentially expressed profile (42 significant miRNAs) in comparison to controls. Moreover, individually, CPA and CD were found to show a significantly different expression profile in comparison to controls (n = 38 and n = 17 miRNAs, respectively). Interestingly, there were no significantly upregulated genes in the adrenals of patients with CD in comparison to the control adrenals. A comparative analysis of the top significant miRNAs (log2 fold change (log2 FC) > 1.25 & p < 0.005) between the two groups was performed and the representative Venn diagrams are given in Figure 2. Briefly, miR-1247-5p, miR-139-3p, and miR-503-5p were significantly upregulated in CPA, in comparison to both CD and controls. Furthermore, miR-150-5p was specifically upregulated in CPA as compared to CD. Several miRNAs (miR-486-5p, miR-551b-3p, miR-144-5p, miR-144-3p, and miR-363-3p) were found to be significantly downregulated in the groups of CPA and CD in comparison to controls. MiR-19a-3p and miR-873-5p were found to be commonly downregulated in CPA in comparison to both CD and controls. Principal component analyses based on miRNA sequencing did not identify any major clusters among the samples. Furthermore, the miRNA profile was not different among the CPA samples based on the mutation status of PRKACA (Supplementary Materials Figure S1).
Ijms 23 07676 g001 550
Figure 1. Differentially expressed miRNAs from sequencing. Volcano plot showing the relationship between fold change (log2 fold change) and statistical significance (−log10 p value). The red points in the plot represent significantly upregulated miRNAs, while blue points represent significantly downregulated miRNAs. CPA, cortisol producing adenoma; CD, Cushing’s disease; Cushing’s syndrome represents CPA and CD, taken together.
Ijms 23 07676 g002 550
Figure 2. Venn analyses of the common significant miRNAs from each group. The significantly expressed miRNAs from each sequencing analysis were shortlisted and compared between the groups. CPA, cortisol producing adenoma; CD, Cushing’s disease.

2.2. Validation and Selection of Candidate miRNAs

For validation by QPCR, the most significant differentially expressed miRNAs (log2 FC > 1.25 & p < 0.005) among the groups were chosen (Table S1). According to the current knowledge, upregulated miRNAs are known to contribute more to pathology than downregulated miRNAs [16]. Since the total number of significantly upregulated miRNAs was six, all these miRNAs were chosen for validation. Contrarily, 25 miRNAs were significantly downregulated among the groups. In particular, miR-486-5p, miR-551b-3p, miR-144-5p, miR-144-3p, and miR-363-3p were found to be commonly downregulated in the CS group in comparison to controls; therefore, these miRNAs were chosen for validation.
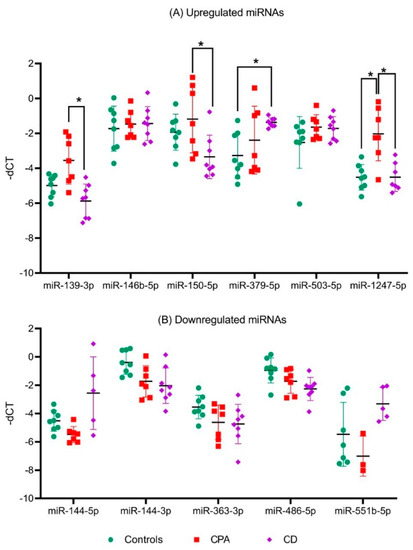
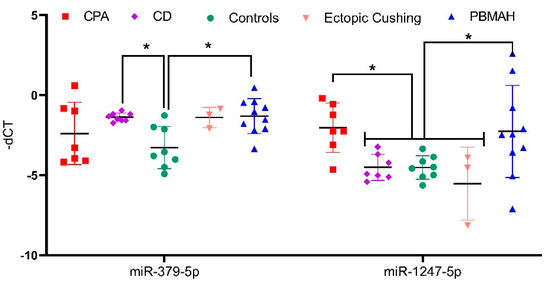
Among the upregulated miRNA candidates, miR-1247-5p QPCR expression confirmed the NGS data (Figure 3A, Table S1). Moreover, miR-150-5p and miR-139-3p were upregulated in CPA specifically in comparison to CD, and miR-379-5p was upregulated in CD in comparison to controls by QPCR. In the case of downregulated genes, none of the selected miRNAs could be confirmed by QPCR (Figure 3B). Thus, analysis of the six upregulated and five downregulated miRNAs from NGS yielded two significantly upregulated miRNA candidates, miR-1247-5p in CPA and miR-379-5p in CD, when compared to controls. These miRNA candidates were taken up for further QPCR validation in an independent cohort of other subtypes of CS (Figure 4), namely ACTH-dependent ectopic CS (n = 3) and ACTH-independent PBMAH (n = 10). The QPCR analysis in the other subtypes revealed miR-1247-5p to be consistently upregulated in ACTH-independent CS (PBMAH and CPA) in comparison to ACTH-dependent CS (CD and ectopic CS) and controls. On the other hand, miR-379-5p was upregulated in CD and PBMAH in comparison to controls.
Ijms 23 07676 g003 550
Figure 3. QPCR analyses of significant miRNAs from sequencing analyses. Data are represented as mean ± standard deviation (SD) of −dCT values: (A) Expression analysis of significantly upregulated miRNAs; (B) Expression analysis of common significantly downregulated miRNAs. Housekeeping gene: miR-16-5p. Statistics: ANOVA test with Bonferroni correction to detect significant differences between patient groups with at least a significance of p-value < 0.05 (*).
Ijms 23 07676 g004 550
Figure 4. QPCR analyses of significantly upregulated miRNAs from validation QPCR. Data are represented as mean ± standard deviation (SD) of −dCT values. Housekeeping gene: miR-16-5p. Statistics: ANOVA test with Bonferroni correction to detect significant differences between patient groups with at least a significance of p-value < 0.05 (*).

2.3. In Vivo Assessment of ACTH-Independent miR-1247-5p

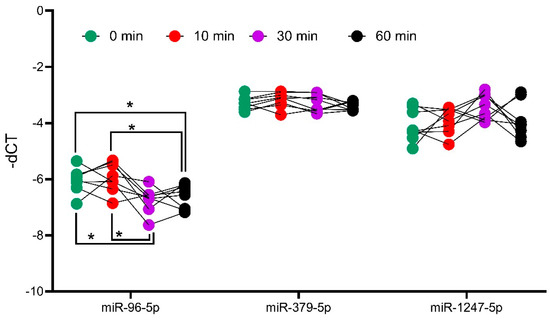
To analyze the influence of ACTH on miRNA expression, the expression of miR-1247-5p and miR-379-5p were assessed in the adrenal tissues of ACTH stimulated mice at different time points. For this analysis, miR-96-5p was taken as a positive control, as it has previously been reported to be differentially expressed in ACTH stimulated mice [17]. The analyses revealed that the expression of miR-1247-5p and miR-379-5p did not change at different timepoints of the ACTH stimulation (Figure 5). Meanwhile, the positive control of mir-96-5p showed a dynamic expression pattern with upregulation after 10 min, followed by downregulation at the subsequent 30 and 60 min time points, in concordance with previously reported findings [18].
Ijms 23 07676 g005 550
Figure 5. Analysis of miRNA expression in ACTH stimulated mice tissue. QPCR analyses of positive controls, miR-96-5p, and candidates miR-379-5p and miR-1247-5p. Mice were injected with ACTH, and adrenals were collected at different timepoints to assess the impact of ACTH on miRNA expression. Data are represented as mean ± standard deviation (SD) of −dCT values. Housekeeping gene: miR-26a-5p. Statistics: ANOVA test with Bonferroni correction to detect significant differences between patient groups with at least a significance of p-value < 0.05 (*).

2.4. In Silico Analyses of miRNA Targets

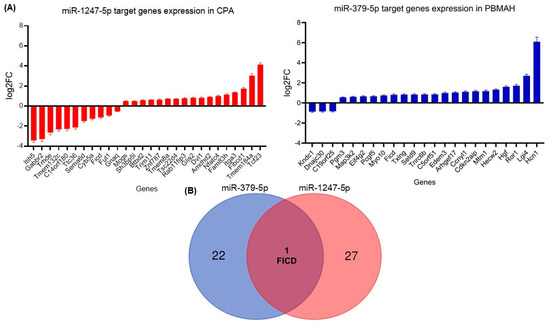
Two diverse approaches were employed for a comprehensive in silico analysis of the miRNA targets. First, the predicted targets of miR-1247-5p and miR-379-5p were taken from the TargetScan database, which identified miRNA–mRNA target pairs based on sequence analyses [19]. The expression status of these targets was then checked in the RNA sequencing data from CPA vs. controls (miR-1247-5p) and PBMAH vs. controls (miR-379-5p). Targets that showed significant expression changes in the sequencing data were shortlisted (Figure 6A). Among the 1061 predicted miR-1247-5p targets, 28 genes were found to show significant expression changes in CPA (20 upregulated, 8 downregulated). On the other hand, for 124 predicted miR-379-5p targets, 23 genes were found to show significant expression changes in PBMAH (20 upregulated, 3 downregulated). Interestingly, the selected targets were found to be unique for each miRNA, except for FICD (FIC domain protein adenylyltransferase) (Figure 6B).
Ijms 23 07676 g006 550
Figure 6. (A) Differentially expressed target genes of miRNAs from sequencing. Data are represented as log2 fold change in comparison to the controls. Statistics: ANOVA test with Bonferroni correction to detect significant differences between patient groups with at least a significance of p-value < 0.05. (B) Venn analyses of common significant miRNA target genes and related pathways. The significantly expressed targets from each sequencing analysis were shortlisted and compared between the groups. Predicted pathways of the targets from the Panther database were shortlisted and compared between the groups.

2.5. In Vitro Analyses of miR-1247-5p Targets

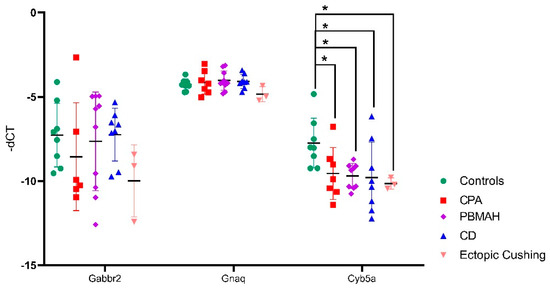
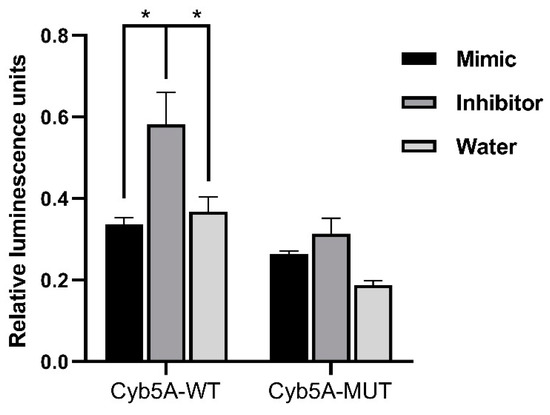
For in vitro analyses, we focused on downregulated targets, as we expect our upregulated miRNA candidates to cause a downregulation of the target mRNAs. For our downregulated mRNAs, only targets of miR-1247-5p were found to have published links to CS, namely Cyb5a, Gabbr2, and Gnaq (Table 1). Therefore, these three targets were then verified by QPCR in the groups of CPA, CD, PBMAH, ectopic CS, and controls (Figure 6). Only Cyb5A was found to be significantly downregulated in ACTH-dependent forms (ectopic CS and CD) as well as in ACTH-independent CS (PBMAH and CPA) in comparison to controls. Consequently, to assess whether Cyb5a is indeed regulated by miR-1247-5p, a dual luciferase assay was performed. To prove our hypothesis, treatment of Cyb5a-WT cells with miR-1247-5p mimic was expected to lead to a reduced luminescence, whereas no effects were expected in cells treated with the miR-1247-5p inhibitor or the Cyb5a-mutant (with a mutation in the miR-1247-5p binding site). As shown in Figure 7, transfection of miR-1247-5p significantly reduced luminescence from Cyb5a-WT in comparison to cells transfected with Cyb5a-WT and miR-1247-5p inhibitors. However, these predicted binding results were not found to be specific, as there were no significant differences when compared to wells transfected with Cyb5a-WT alone (Figure 8). Consecutively, when the mutated Cyb5a-Mut were transfected along with the mimics and inhibitors, no significant differences in luminescence were observed in the transfected population. Thus, direct interaction between miR-1247-5p and its predicted target gene Cyb5A could not be conclusively proven using this luciferase assay.
Ijms 23 07676 g007 550
Figure 7. QPCR analyses of the top predicted targets of miR-1247-5p. Data are represented as mean ± standard deviation (SD) of −dCT values. Housekeeping gene: PPIA. Statistics: ANOVA test with Bonferroni correction to detect significant differences between patient groups with at least a significance of p-value < 0.05 (*).
Ijms 23 07676 g008 550
Figure 8. Results of dual luminescence assay on cells transfected with miR-1247-5p mimics and related controls. Cells were transfected with plasmids containing either the WT or Mut miRNA binding sequence in Cyb5a. Either miR-1247-5p mimics or miR-1247-5p inhibitors were transfected together with the respective plasmids. Data are represented as mean ± standard error of mean (SEM) of relative luminescence unit values. Statistics: ANOVA test with Bonferroni correction to detect significant differences between patient groups with at least a significance of p value < 0.05 (*).
Table 1. Analysis of the predicted targets of miR-1247-5p and their expression levels in comparison to controls (log2 fold change). Published literature on target genes in reference to CS is highlighted in bold.
Table

2.6. Pathway Analyses of miRNA Targets

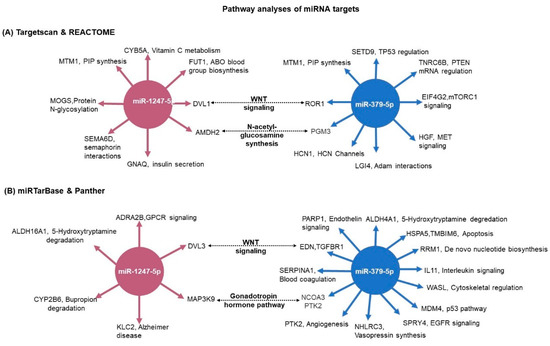
For the pathway analysis (Reactome) we used the 28 predicted miRNA-1247-5p targets and the 23 predicted miRNA-379-5p targets from TargetScan, which were significantly differently expressed in the RNA-seq (Figure 6). Concurrently, the pathways commonly enriched by both miRNAs included the WNT signaling pathway and N-acetyl-glucosamine synthesis (Figure 9A). As a complementary approach, in silico analyses were also performed based on the targets from miRTarBase. In this database, targets are shortlisted based on published experimental results. In this analysis, miR-1247-5p (n = 21) and miR-379-5p targets (n = 85) were unique. While the validated targets of miR-379-5p were found to show significant changes in expression in the RNA-seq data from PBMAH (n = 12), none of the validated miR-1247-5p targets were found to show significant expression changes in the RNA-seq data from CPA. Therefore, all the validated targets of the miRNAs were subjected to pathway analyses (Panther). Interestingly, the WNT signaling pathway was also found to be commonly regulated by both miRNAs using this approach (Figure 9B). Finally, the expression status of target genes related to WNT signaling pathways were checked in our RNA-seq data (Figure S2). Given the upregulated status of the miRNAs, a downregulated expression of its target genes was expected. However, a significantly upregulated expression was observed for DVL1 in CPA in comparison to controls and for ROR1 in PBMAH in comparison to controls.
Ijms 23 07676 g009 550
Figure 9. Pathway analyses of miRNA target genes. (A) The predicted targets were matched with the RNA-seq expression data. For miR-1247-5p, CPA vs. controls expression data; and for miR-379-5p, PBMAH vs. controls expression data. The significantly expressed target genes were then subjected to pathway analyses by Reactome. The significantly enriched pathway networks (p < 0.05) and their related genes are given. (B) The experimentally validated target genes from miRTarBase were analyzed for their role in pathways by the Panther database. The target genes and their related pathways are given. The commonly represented pathways are marked in bold.

3. Discussion

MiRNAs are fine regulators of both physiology and pathology and have diverse roles as diagnostic biomarkers as well as therapeutic targets. While circulating miRNAs have been investigated as potential biomarkers for hypercortisolism in CS subtypes (36), comprehensive analyses of their pathological role in CS subtypes have not yet been performed. This study hoped to uncover the pathological role of miRNAs in different CS subtypes as well as identify unique epigenetic targets contributing to hypercortisolism in these subtypes. As such, miRNA sequencing was performed in the ACTH-independent CPA and ACTH-dependent CD, with additional QPCR validation in PBMAH and ectopic CS. As expected, miRNA expression profiles in CD and CPA were very different.

3.1. ACTH-Independent Upregulated miRNAs in CS

Among the analyzed miRNAs, only miR-1247-5p and miR-379-5p showed the most prominent changes in expression levels. Briefly, miR-1247-5p was significantly upregulated in ACTH-independent forms of CS, CPA, and PBMAH (Figure 1 and Figure 3) while miR-379-5p was found to be upregulated in CD and PBMAH, in comparison to controls. Even though CD and PBMAH represent CS subtypes with different ACTH dependence, albeit both with hyperplastic tissue, it is interesting to find a shared miRNA expression status. Concurrently, miRNAs have been identified as dynamic players in regulating the acute effect of ACTH on adrenal steroidogenesis in in vivo murine studies [20,21]. Further diverse miRNAs have been characterized to regulate steroidogenesis in ACTH and dexamethasone treated rats [22] (suppressed ACTH) as well as in in vitro studies [20]. It is possible that miR-379-5p contributes to the adrenal hyperplasia present in both PBMAH and CD by targeting specific genes related to hyperplasia, and miR-1247-5p by contributing to cortisol production independent of ACTH regulation in CPA and PBMAH.
Interestingly, the miRNA candidates (mir-1247-5p and miR-379-5p) in our study have not been previously characterized in any of these studies. Furthermore, the expression of mir-1247-5p and miR-379-5p were found to be independent of ACTH stimulation, underlying their role in CS independently of the HPA axis control and postulating specific regulatory processes.

3.2. Target Genes of miRNAs in CS

Initially, we focused on the selection of known CS specific target genes that could be directly repressed by miRNAs, thereby contributing to pathology. The predicted target genes of miR-1247-5p and miR-379-5p were assessed for their downregulated expression status in the RNA-seq data. Among the selected target genes, only Cyb5a was found to be significantly downregulated in all forms of CS (Figure 6). Cytochrome b5 (CYB5A) is a marker of the zona reticularis and is an important regulator of androstenedione production [23,24]. Based on its role in adrenal steroidogenesis, it is possible that Cyb5a is downregulated by miR1247-5p. To prove our hypothesis, a dual luciferase assay was performed in HELA cell line to identify a direct interaction between Cyb5a and miR-1247-5p (Figure 7). Unfortunately, a direct interaction could not be proven, indicating that miR-1247-5p perhaps regulates its target genes in different ways.

3.3. Pathway Analyses of miRNA Targets

To identify miRNA specific regulatory processes, comprehensive target and pathway analyses were performed. Independent pathway analyses of the respective targets with two different databases of Reactome and Panther showed the WNT signaling pathway as a common targeted pathway of both mir-1247-5p and miR-379-5p (Figure 8). The WNT signaling pathway represents a crucial regulator in diverse developmental as well as pathological processes with tissue-specific effects [25,26]. Consequently, the WNT pathway has been largely characterized as one of the dysregulated pathophysiological mechanisms in CPA. Mutations in PRKACA, one of the WNT signaling proteins, are present in approximately 40% of CPA [27]. In the case of CD, dysregulated WNT signaling has been characterized as promoting proliferation in ACTH-secreting pituitary adenomas [28]. Moreover, activating mutations in beta catenin, one of the WNT signaling pathways, has been characterized as driving adrenal hyperplasia through both proliferation-dependent and -independent mechanisms [29]. Thus, it could be hypothesized that by targeting specific genes in the pathway, miRNAs drive specific pathophysiological processes in diverse CS subtypes.

3.4. MiRNA Target Genes in WNT Signaling

DVL1 (TargetScan) and DVL3 (miRTar) are the shortlisted target genes of miR-1247-5p in the WNT signaling pathway. These genes are members of canonical WNT pathways and, importantly, activation of the cytoplasmic effector Dishevelled (Dvl) is a critical step in WNT/β-catenin signaling initiation [30,31]. Interestingly, no difference in DVL1 and DVL3 gene expression was found in the analyses of ACTH-secreting pituitary adenomas [32]. Therefore, it could be possible that DVL1 and DVL3 are only targeted by miR-1247-5p specifically in the adrenal of CPA and PBMAH patients, leading to its characterized tumor progression. EDN1, TGFBR1 (TargetScan), and ROR1 (miRTar) were the target genes of miR-379-5p related to the WNT pathway. In epithelial ovarian cancer, Endothelin-1 (EDN-1) was found to regulate the epithelial–mesenchymal transition (EMT) and a chemoresistant phenotype [33]. In the case of receptor tyrosine kinase-like orphan receptor 1 (ROR1), higher expression of the gene was associated with a poor prognosis in ovarian cancer [34]. Concurrently, suppression of TGFBR1-mediated signaling by conditional knockout in mice was found to drive the pathogenesis of endometrial hyperplasia, independent of the influence of ovarian hormones [35]. Therefore, it could be hypothesized that the dysregulated expression of these factors in adrenals could trigger similar hyperplastic effects mediated by these factors, as in ovarian tissues.

3.5. Bottlenecks and Future Outlook

Interestingly, among these genes, only DVL1 and ROR1 were found to be significantly upregulated in the RNA-seq data (Figure S2). The major regulatory role of miRNAs in gene expression come from their ability to repress gene expression at the level of transcription and translation. There are also reports of miRNA-mediated gene upregulation; however, the physiological evidence of the role is still unresolved [36]. Therefore, it is interesting to see the selected targets of miR-1247-5p and miR-379-5p upregulated. Moreover, it should be noted that most of the experimentally validated miRNA targets were identified by CLIP methods [37]. Crosslinking immunoprecipitation (CLIP) are binding assays that provide genome-wide maps of potential miRNA-target gene interactions based on sequencing. Moreover, these assays do not make functional predictions on the outcome of miRNA binding, and neither do upregulation or downregulation [38,39]. Therefore, in our current experimental setting, we could only identify potential miRNA target genes and speculate on their pathological role based on the published literature and in silico analyses. Furthermore, extensive mechanistic analyses based on these potential targets could help in elaborating the specific epigenetic pathways that fine-tune CS pathology in different subtypes.

4. Materials and Methods

4.1. Sample Collection and Ethics Approval

All patients were registered in the German Cushing’s Registry, the ENS@T or/and NeoExNET databases (project number protocol code 379-10 and 152-10). The study was approved by the Ethics Committee of the University of Munich. All experiments were performed according to relevant guidelines and protocols, and written informed consent was obtained from all patients involved. The adrenal samples used in the sequencing (miRNA and RNA) belong to the same patient.
For miRNA-specific next-generation sequencing (NGS), a total of 19 adrenocortical tissue samples were used. The cohort consisted of the following patient groups: ACTH-independent CPA, n = 7; ACTH-dependent hypertrophic adrenals of CD patients after bilateral adrenalectomy, n = 8; normal adjacent adrenal tissue from patients with pheochromocytoma as controls, n = 8. For QPCR validation, the patient groups included adrenal tissue from ACTH-independent PBMAH, n = 10, and ACTH-dependent ectopic CS, n = 3.
In the case of mRNA sequencing, a total of 23 adrenocortical tissue samples were used. This includes the following patient groups: CPA, n = 7; PBMAH, n = 8; normal adjacent adrenal tissue from patients with pheochromocytoma as controls, n = 8.
The clinical characteristics of the patients are given in Table 2. Furthermore, of the eight CPA samples in the study, three of them carried known somatic driver mutations in the PRKACA gene and in the ten PBMAH samples, two carried germline mutations in the ARMC5 gene.
Table 2. Clinical characteristics of the patient groups. Data are given as median with 25th and 75th percentiles in brackets. CPA, cortisol producing adenoma; CD, Cushing’s disease.
Table
The adrenal tissues were stored at −80 °C. Total RNA isolation was carried out from all adrenal cortex samples by an RNeasy Tissue Kit (Qiagen, Hilden, Germany). The isolated RNA was kept frozen at −80 °C until further use.

4.2. MiRNA and RNA Sequencing

RNA integrity and the absence of contaminating DNA were confirmed by Bioanalyzer RNA Nano (Agilent Technologies, Santa Clara, CA, USA) and by Qubit DNA High sensitivity kits, respectively. Sequencing libraries were prepared using the Illumina TruSeq Small RNA Library Preparation Kit. NGS was performed on 2 lanes of an Illumina HiSeq2500 (Illumina, CA, USA) multiplexing all samples (paired end read, 50 bp). The quality of sequencing reads was verified using FastQC0.11.5 (http://www.bioinformatics.babraham.ac.uk/projects/fastqc, date last accessed: 13 March 2020) before and after trimming. Adapters were trimmed using cutadapt [40]. Reads with <15 bp and >40 bp insert sequences were discarded. An alignment of reads was performed using miRBase V21 [41,42] with sRNAbench [43]. EdgeR and DeSeq in R were used for further analyses [44,45]. MiRNAs with at least 5 raw counts per library were included. RNA-seq was performed by Qiagen, Hilden, Germany. For mRNA, sequencing was performed on Illumina NextSeq (single end read, 75 bp). Adapter and quality trimming were performed by the “Trim Reads” tool from CLC Genomics Workbench. Furthermore, reads were trimmed based on quality scores. The QC reports were generated by the “QC for Sequencing Reads” tool from CLC Genomics Workbench. Read mapping and gene quantification were performed by the “RNA-seq Analysis” tool from CLC Genomics Workbench [46]. The miRNA-seq data generated in this study have been submitted to the NCBI (PRJNA847385).

4.3. Validation of Individual miRNAs

MiRNAs and genes significantly differentially expressed by NGS were validated by QPCR. Reverse transcription of miRNA-specific cDNA was performed by using the TaqMan MicroRNA Reverse Transcription Kit (Thermo Fisher Scientific, Munich, Germany), and the reverse transcription of RNA genes was done by using the Superscript VILO cDNA synthesis Kit (Thermo Fisher Scientific, Munich, Germany). 50 ng of RNA was used for each of the reverse transcription reactions. Quantitative real-time PCR was performed using the TaqMan Fast Universal PCR Master Mix (2×) (Thermo Fisher Scientific, Munich, Germany) on a Quantstudio 7 Flex Real-Time PCR System (Thermo Fisher Scientific, Munich, Germany) in accordance with the manufacturer’s protocol. All QPCR reactions were performed in a final reaction volume of 20 μL and with 1 μL of 1:5 diluted cDNA. Negative control reactions contained no cDNA templates. Gene expression was quantified using the relative quantification method by normalization with reference gene [47]. Statistical analysis using the bestkeeper tool was used to compare and select the best reference gene with stable expression across the human adrenal samples [48]. Reference genes with significantly different Ct values (p-value < 0.01) between the samples were excluded. Furthermore, primer efficiency and the associated correlation coefficient R2 of the selected reference gene were determined by the standard curve method in serially diluted cDNA samples [49]. In the case of miRNA reference genes, miR-16-5p [48,50,51] and RNU6B [52] previously used in similar studies were compared. MiR-16-5p was found to show the most stable expression levels across the samples with a p-value of 0.452 in comparison to RNU6B which had a p-value of 0.001. In the case of RNA reference genes, PPIA [53] and GAPDH [54] were compared. Here, PPIA was found to show the most stable expression levels across the samples with a p-value of 0.019 in comparison to GAPDH which had a p-value of 0.003. Therefore, these genes were used for the normalization of miRNA and RNA expression in human adrenal samples.

4.4. Target Screening

In silico prediction of the possible miRNA targets was performed using the miRNA target database, TargetScan, and miRTarBase [19,37]. The top predicted targets were further screened based on their expression status in the RNA-seq data from the adrenocortical tissues of CPA, PBMAH, and controls (unpublished data). Pathway analyses of the targets were performed using Reactome [55] and Panther [56] online platforms. The selected downregulated targets were analyzed by QPCR in the adrenocortical samples to confirm their expression status. The successfully validated candidates were then analyzed for regulation by the miRNA using a dual luciferase assay [57].

4.5. Dual Luciferase Assay

The interaction between the predicted 3′-UTR region of Cyb5a and miR-1247-5p was detected using a luciferase activity assay. The 3′UTR sequences of Cyb5a (129 bp) containing the predicted miR-1247-5p binding sites (psiCHECK-2 Cyb5a 3′UTR WT) were cloned into the psiCHECK-2 vector (Promega, Fitchburg, WI, USA). A QuikChange Site-Directed Mutagenesis kit (Agilent Technologies, CA, USA) was used to mutate the miR-1247-5p binding site (psiCHECK-2 Cyb5a 3′UTR mutant) according to the manufacturer’s protocol. All the sequences were verified by Sanger sequencing. Then, 200 ng of the plasmid was used for each transfection. Synthetic miR-1247-5p mimics and specific oligonucleotides that inhibit endogenous miR-1247-5p (miR-1247-5p inhibitors) were purchased from Promega and 100 nmol of the molecules were used for each transfection according to the manufacturer’s protocol. For the assay, HeLa cells were seeded in 96-well plates and incubated for 24 h. The following day, cells were transfected using the following different conditions: (1) psiCHECK-2 Cyb5a 3′UTR WT + miR-1247-5p mimic; (2) psiCHECK-2 Cyb5a 3′UTR WT + miR-1247-5p inhibitor; (3) psiCHECK-2 Cyb5a 3′UTR WT + water; (4) psiCHECK-2 Cyb5a 3′UTR mutant + miR-1247-5p mimic; (5) psiCHECK-2 Cyb5a 3′UTR mutant + miR-1247-5p inhibitor; (6) psiCHECK-2 Cyb5a 3′UTR mutant + water. Forty-eight hours later, luciferase activity in the cells was measured using the dual luciferase assay system (Promega, Fitchburg, WI, USA) in accordance with the manufacturer’s instructions. Renilla luciferase activity was normalized to firefly luciferase activity. Each treatment was performed in triplicate. Any interaction between the cloned gene, Cyb5a (WT and mutant), and miR-1247-5p mimic is accompanied by a decrease in luminescence. This decrease in luminescence would not be observed when the plasmids are transfected with the miR-1247-5p inhibitor, indicating that observed luminescence differences are caused by specific interactions between the plasmid and the miR-1247-5p mimic. Transfection of the plasmid with water corrects any background interactions between the cloned gene and endogenous miRNAs in the culture.

4.6. In Vivo ACTH Stimulation

Experiments were performed on 13-week-old C57BL/6 J female mice (Janvier, Le Genest-Saint-Isle, France). Mice were intraperitoneally injected with 1 mg/kg of ACTH (Sigma Aldrich, Munich, Germany) and adrenals were collected after 10, 30, and 60 min of injections. In addition, control adrenals were collected from mice at baseline conditions (0 min). Mice were killed by cervical dislocation and adrenals were isolated, snap-frozen in liquid nitrogen, and stored at −80 °C for later RNA extraction. MiR-26a was taken as a housekeeping gene in the QPCR [58]. All mice were maintained in accordance with facility guidelines on animal welfare and approved by Landesdirektion Sachsen, Chemnitz, Germany.

4.7. Statistical Analysis and Software

R version 3.6.1 was used for the statistical analyses. To identify RNAs differentially expressed, a generalized linear model (GLM, a flexible generalization of ordinary linear regression that allows for variables that have distribution patterns other than a normal distribution) in the software package edgeR (Empirical Analysis of DGE in R) was employed to calculate p-values [45,59]. p-values were adjusted using the Benjamin–Hochberg false discovery rate (FDR) procedure [60]. Disease groups were compared using the unpaired Mann–Whitney test, and to decrease the false discovery rate a corrected p-value was calculated using the Benjamin–Hochberg method. p adjusted < 0.05 and log2 fold change >1.25 was applied as the cut-off for significance for NGS data. GraphPad Prism Version 8 was used for the statistical analysis of QPCR. To calculate differential gene expression, the dCt method (delta Ct (cycle threshold) value equals target miRNA’s Ct minus housekeeping miRNA’s Ct) was used (Microsoft Excel 2016, Microsoft, Redmond, WA, USA). For QPCR, an ANOVA test with Bonferroni correction was used [61] to assess significance; p-values < 0.05 were considered significant.

5. Conclusions

In conclusion, while comprehensive information regarding the role of miRNAs in acute and chronic phases of steroidogenesis is available, there is little known about the pathological independent role of miRNAs in the pathology of CS. In our study, we have described ACTH-independent miR-1247-5p and miR-379-5p expression in CS for the first time. Thus, by regulating different genes in the WNT signaling pathway, the miRNAs may individually contribute to the Cushing’s pathology in specific subtypes.

Supplementary Materials

The following supporting information can be downloaded at: https://www.mdpi.com/article/10.3390/ijms23147676/s1.

Author Contributions

Conceptualization, S.V., A.C. and A.R.; methodology, S.V., R.Z. and M.E.; software, S.V. and M.E.; validation, R.Z., A.O., D.W. and B.W.; formal analysis, S.V.; investigation, S.V., R.Z., M.E., A.O. and D.W.; resources, A.C., B.W., M.R. and A.R.; data curation, S.V. and R.Z.; writing—original draft preparation, S.V., R.Z. and A.R.; writing—review and editing, S.S., M.R. and A.R.; visualization, S.V.; supervision, A.R.; project administration, A.R.; funding acquisition, A.C., S.S., M.R. and A.R. All authors have read and agreed to the published version of the manuscript.

Funding

This work was supported by a grant from the Deutsche Forschungsgemeinschaft (DFG) (within the CRC/Transregio 205/1 “The Adrenal: Central Relay in Health and Disease”) to A.C., B.W., S.S., M.R. and A.R., and individual grant SB 52/1-1 to S.S. This work is part of the German Cushing’s Registry CUSTODES and has been supported by a grant from the Else Kröner-Fresenius Stiftung to MR (2012_A103 and 2015_A228). A.R. was supported by the FöFoLe Program of the Ludwig Maximilian University, Munich. We thank I. Shapiro, A. Parl, C. Kühne, and S. Zopp for their technical support.

Institutional Review Board Statement

The study was conducted according to the guidelines of the Declaration of Helsinki and approved by the Ethics Committee of the Ludwig Maximilian University, Munich (protocol code 379-10, 152-10 and 20 July2021).

Informed Consent Statement

Informed consent was obtained from all subjects involved in the study.

Data Availability Statement

The miRNA-seq data generated in this study have been submitted to the NCBI (PRJNA847385).

Conflicts of Interest

The authors declare no conflict of interest.

References

  1. Kotłowska, A.; Puzyn, T.; Sworczak, K.; Stepnowski, P.; Szefer, P. Metabolomic biomarkers in urine of cushing’s syndrome pa-tients. Int. J. Mol. Sci. 2017, 18, 294. [Google Scholar] [CrossRef] [PubMed][Green Version]
  2. Valassi, E.; Tabarin, A.; Brue, T.; Feelders, R.A.; Reincke, M.; Netea-Maier, R.; Toth, M.; Zacharieva, S.; Webb, S.M.; Tsagarakis, S.; et al. High mortality within 90 days of diagnosis in patients with Cushing’s syndrome: Results from the ERCUSYN registry. Eur. J. Endocrinol. 2019, 181, 461–472. [Google Scholar] [CrossRef]
  3. Stratakis, C. Cushing syndrome caused by adrenocortical tumors and hyperplasias (corticotropin-independent Cushing syn-drome). Endocr. Dev. 2008, 13, 117–132. [Google Scholar]
  4. Jarial, K.D.S.; Walia, R.; Nahar, U.; Bhansali, A. Primary bilateral adrenal nodular disease with Cushing’s syndrome: Varying aeti-ology. BMJ. Case. Rep. 2017, 2017, bcr2017220154. [Google Scholar] [CrossRef] [PubMed]
  5. Kamilaris, C.D.C.; Stratakis, C.A.; Hannah-Shmouni, F. Molecular Genetic and Genomic Alterations in Cushing’s Syndrome and Primary Aldosteronism. Front. Endocrinol. 2021, 12, 142. [Google Scholar] [CrossRef] [PubMed]
  6. Feelders, R.A.; Pulgar, S.J.; Kempel, A.; Pereira, A.M. The burden of Cushing’s disease: Clinical and health-related quality of life aspects. Eur. J. Endocrinol. 2012, 167, 311–326. [Google Scholar] [CrossRef] [PubMed][Green Version]
  7. Feelders, R.A.; Newell-Price, J.; Pivonello, R.; Nieman, L.K.; Hofland, L.J.; Lacroix, A. Advances in the medical treatment of Cush-ing’s syndrome. Lancet Diabetes Endocrinol. 2019, 7, 300–312. [Google Scholar] [CrossRef]
  8. Krill, K.T.; Gurdziel, K.; Heaton, J.H.; Simon, D.P.; Hammer, G.D. Dicer Deficiency Reveals MicroRNAs Predicted to Control Gene Expression in the Developing Adrenal Cortex. Mol. Endocrinol. 2013, 27, 754–768. [Google Scholar] [CrossRef]
  9. Robertson, S.; Diver, L.A.; Alvarez-Madrazo, S.; Livie, C.; Ejaz, A.; Fraser, R.; Connell, J.M.; MacKenzie, S.M.; Davies, E. Regulation of Corticosteroidogenic Genes by MicroRNAs. Int. J. Endocrinol. 2017, 2017, 2021903. [Google Scholar] [CrossRef][Green Version]
  10. Bujko, M.; Kober, P.; Boresowicz, J.; Rusetska, N.; Zeber-Lubecka, N.; Paziewska, A.; Pekul, M.; Zielinski, G.; Styk, A.; Kunicki, J.; et al. Differential microRNA Expression in USP8-Mutated and Wild-Type Corticotroph Pituitary Tumors Reflect the Difference in Protein Ubiquitination Processes. J. Clin. Med. 2021, 10, 375. [Google Scholar] [CrossRef]
  11. Iliopoulos, D.; Bimpaki, E.I.; Nesterova, M.; Stratakis, C.A. MicroRNA Signature of Primary Pigmented Nodular Adrenocortical Disease: Clinical Correlations and Regulation of Wnt Signaling. Cancer Res. 2009, 69, 3278–3282. [Google Scholar] [CrossRef] [PubMed][Green Version]
  12. Tan, X.-G.; Zhu, J.; Cui, L. MicroRNA expression signature and target prediction in familial and sporadic primary macronodular adrenal hyperplasia (PMAH). BMC Endocr. Disord. 2022, 22, 11. [Google Scholar] [CrossRef]
  13. Vaczlavik, A.; Bouys, L.; Violon, F.; Giannone, G.; Jouinot, A.; Armignacco, R.; Cavalcante, I.P.; Berthon, A.; Letouzé, E.; Vaduva, P.; et al. KDM1A inactivation causes hereditary food-dependent Cushing syndrome. Genet. Med. 2021, 24, 374–383. [Google Scholar] [CrossRef]
  14. Bimpaki, E.I.; Iliopoulos, D.; Moraitis, A.; Stratakis, C.A. MicroRNA signature in massive macronodular adrenocortical disease and implications for adrenocortical tumorigenesis. Clin. Endocrinol. 2010, 72, 744–751. [Google Scholar] [CrossRef]
  15. Vetrivel, S.; Zhang, R.; Engel, M.; Altieri, B.; Braun, L.; Osswald, A.; Bidlingmaier, M.; Fassnacht, M.; Beuschlein, F.; Reincke, M.; et al. Circulating microRNA Expression in Cushing’s Syndrome. Front. Endocrinol. 2021, 12, 10. [Google Scholar] [CrossRef] [PubMed]
  16. O’Brien, J.; Hayder, H.; Zayed, Y.; Peng, C. Overview of microRNA biogenesis, mechanisms of actions, and circulation. Front. Endocrinol. 2018, 9, 402. [Google Scholar] [CrossRef][Green Version]
  17. Butz, H.; Patócs, A. MicroRNAs in endocrine tumors. Electron. J. Int. Fed. Clin. Chem. Lab. Med. 2019, 30, 146–164. [Google Scholar]
  18. Riester, A.; Issler, O.; Spyroglou, A.; Rodrig, S.H.; Chen, A.; Beuschlein, F. ACTH-Dependent Regulation of MicroRNA As Endogenous Modulators of Glucocorticoid Receptor Expression in the Adrenal Gland. Endocrinology 2012, 153, 212–222. [Google Scholar] [CrossRef][Green Version]
  19. Huang, X.; Zhong, R.; He, X.; Deng, Q.; Peng, X.; Li, J.; Luo, X. Investigations on the mechanism of progesterone in inhibiting endo-metrial cancer cell cycle and viability via regulation of long noncoding RNA NEAT1/microRNA-146b-5p mediated Wnt/β-catenin signaling. IUBMB Life 2019, 71, 223–234. [Google Scholar] [CrossRef][Green Version]
  20. Azhar, S.; Dong, D.; Shen, W.-J.; Hu, Z.; Kraemer, F.B. The role of miRNAs in regulating adrenal and gonadal steroidogenesis. J. Mol. Endocrinol. 2020, 64, R21–R43. [Google Scholar] [CrossRef]
  21. Allen, M.J.; Sharma, S. Physiology, Adrenocorticotropic Hormone (ACTH). StatPearls 2021. Available online: https://www.ncbi.nlm.nih.gov/books/NBK500031/ (accessed on 8 December 2021).
  22. Hu, Z.; Shen, W.-J.; Cortez, Y.; Tang, X.; Liu, L.-F.; Kraemer, F.B.; Azhar, S. Hormonal Regulation of MicroRNA Expression in Steroid Producing Cells of the Ovary, Testis and Adrenal Gland. PLoS ONE 2013, 8, e78040. [Google Scholar] [CrossRef][Green Version]
  23. Ghayee, H.K.; Rege, J.; Watumull, L.M.; Nwariaku, F.E.; Carrick, K.S.; Rainey, W.E.; Miller, W.L.; Auchus, R.J. Clinical, biochemical, and molecular characterization of macronodular adrenocortical hyperplasia of the zona reticularis: A new syndrome. J. Clin. Endocrinol. Metab. 2011, 96, E243–E250. [Google Scholar] [CrossRef] [PubMed][Green Version]
  24. Nakamura, Y.; Fujishima, F.; Hui, X.-G.; Felizola, S.J.A.; Shibahara, Y.; Akahira, J.-I.; McNamara, K.M.; Rainey, W.E.; Sasano, H. 3βHSD and CYB5A double positive adrenocortical cells during adrenal development/aging. Endocr. Res. 2015, 40, 8–13. [Google Scholar] [CrossRef] [PubMed][Green Version]
  25. Ng, L.F.; Kaur, P.; Bunnag, N.; Suresh, J.; Sung, I.C.H.; Tan, Q.H.; Gruber, J.; Tolwinski, N.S. WNT Signaling in Disease. Cells 2019, 8, 826. [Google Scholar] [CrossRef][Green Version]
  26. Song, J.L.; Nigam, P.; Tektas, S.S.; Selva, E. microRNA regulation of Wnt signaling pathways in development and disease. Cell. Signal. 2015, 27, 1380–1391. [Google Scholar] [CrossRef][Green Version]
  27. Beuschlein, F.; Fassnacht, M.; Assié, G.; Calebiro, D.; Stratakis, C.A.; Osswald, A.; Ronchi, C.L.; Wieland, T.; Sbiera, S.; Faucz, F.R.; et al. Constitutive Activation of PKA Catalytic Subunit in Adrenal Cushing’s Syndrome. N. Engl. J. Med. 2014, 370, 1019–1028. [Google Scholar] [CrossRef][Green Version]
  28. Ren, J.; Jian, F.; Jiang, H.; Sun, Y.; Pan, S.; Gu, C.; Chen, X.; Wang, W.; Ning, G.; Bian, L.; et al. Decreased expression of SFRP2 promotes development of the pituitary corticotroph adenoma by upregulating Wnt signaling. Int. J. Oncol. 2018, 52, 1934–1946. [Google Scholar] [CrossRef][Green Version]
  29. Pignatti, E.; Leng, S.; Yuchi, Y.; Borges, K.S.; Guagliardo, N.A.; Shah, M.S.; Ruiz-Babot, G.; Kariyawasam, D.; Taketo, M.M.; Miao, J.; et al. Beta-Catenin Causes Adrenal Hyperplasia by Blocking Zonal Transdifferentiation. Cell Rep. 2020, 31, 107524. [Google Scholar] [CrossRef]
  30. Grumolato, L.; Liu, G.; Mong, P.; Mudbhary, R.; Biswas, R.; Arroyave, R.; Vijayakumar, S.; Economides, A.N.; Aaronson, S.A. Canonical and noncanonical Wnts use a common mechanism to activate completely unrelated coreceptors. Genes Dev. 2010, 24, 2517–2530. [Google Scholar] [CrossRef][Green Version]
  31. Tauriello, D.V.F.; Jordens, I.; Kirchner, K.; Slootstra, J.W.; Kruitwagen, T.; Bouwman, B.A.M.; Noutsou, M.; Rüdiger, S.G.D.; Schwamborn, K.; Schambony, A.; et al. Wnt/β-catenin signaling requires interaction of the Dishevelled DEP domain and C terminus with a discontinuous motif in Frizzled. Proc. Natl. Acad. Sci. USA 2012, 109, E812–E820. [Google Scholar] [CrossRef][Green Version]
  32. Colli, L.M.; Saggioro, F.; Neder Serafini, L.; Camargo, R.C.; Machado, H.; Moreira, A.C.; Antonini, S.R.; De Castro, M. Components of the Canonical and Non-Canonical Wnt Pathways Are Not Mis-Expressed in Pituitary Tumors. PLoS ONE 2013, 8, e62424. [Google Scholar] [CrossRef] [PubMed][Green Version]
  33. Rosanò, L.; Cianfrocca, R.; Tocci, P.; Spinella, F.; Di Castro, V.; Caprara, V.; Semprucci, E.; Ferrandina, G.; Natali, P.G.; Bagnato, A. En-dothelin A receptor/β-arrestin signaling to the Wnt pathway renders ovarian cancer cells resistant to chemotherapy. Cancer Res. 2014, 74, 7453–7464. [Google Scholar] [CrossRef] [PubMed][Green Version]
  34. Zhang, H.; Qiu, J.; Ye, C.; Yang, D.; Gao, L.; Su, Y.; Tang, X.; Xu, N.; Zhang, D.; Xiong, L.; et al. ROR1 expression correlated with poor clinical outcome in human ovarian cancer. Sci. Rep. 2014, 4, 5811. [Google Scholar] [CrossRef] [PubMed][Green Version]
  35. Gao, Y.; Li, S.; Li, Q. Uterine epithelial cell proliferation and endometrial hyperplasia: Evidence from a mouse model. Mol. Hum. Reprod. 2014, 20, 776–786. [Google Scholar] [CrossRef]
  36. Orang, A.V.; Safaralizadeh, R.; Kazemzadeh-Bavili, M. Mechanisms of miRNA-Mediated Gene Regulation from Common Downregulation to mRNA-Specific Upregulation. Int. J. Genom. 2014, 2014, 970607. [Google Scholar]
  37. Huang, H.Y.; Lin, Y.C.D.; Li, J.; Huang, K.Y.; Shrestha, S.; Hong, H.C.; Tang, Y.; Chen, Y.G.; Jin, C.N.; Yu, Y.; et al. miRTarBase 2020: Up-dates to the experimentally validated microRNA–target interaction database. Nucleic Acids Res. 2020, 48, D148–D154. [Google Scholar] [CrossRef] [PubMed][Green Version]
  38. Liu, W.; Wang, X. Prediction of functional microRNA targets by integrative modeling of microRNA binding and target expres-sion data. Genome Biol. 2019, 20, 18. [Google Scholar] [CrossRef] [PubMed]
  39. Wang, X. Improving microRNA target prediction by modeling with unambiguously identified microRNA-target pairs from CLIP-ligation studies. Bioinformatics 2016, 32, 1316–1322. [Google Scholar] [CrossRef]
  40. Martin, M. Cutadapt removes adapter sequences from high-throughput sequencing reads. EMBnet. J. 2011, 17, 10–12. [Google Scholar] [CrossRef]
  41. Kozomara, A.; Griffiths-Jones, S. miRBase: Annotating high confidence microRNAs using deep sequencing data. Nucleic Acids Res. 2014, 42, D68–D73. [Google Scholar] [CrossRef][Green Version]
  42. Griffiths-Jones, S. miRBase: The MicroRNA Sequence Database. Methods Mol. Biol. 2006, 342, 129–138. [Google Scholar] [PubMed]
  43. Aparicio-Puerta, E.; Lebrón, R.; Rueda, A.; Gómez-Martín, C.; Giannoukakos, S.; Jáspez, D.; Medina, J.M.; Zubković, A.; Jurak, I.; Fromm, B.; et al. sRNAbench and sRNAtoolbox 2019: Intuitive fast small RNA profiling and differential expression. Nucleic Acids Res. 2019, 47, W530–W535. [Google Scholar] [CrossRef] [PubMed][Green Version]
  44. Anders, S.; Huber, W. Differential expression analysis for sequence count data. Genome Biol. 2010, 11, R106. [Google Scholar] [CrossRef] [PubMed][Green Version]
  45. Robinson, M.D.; McCarthy, D.J.; Smyth, G.K. EdgeR: A Bioconductor package for differential expression analysis of digital gene expression data. Bioinformatics 2010, 26, 139–140. [Google Scholar] [CrossRef][Green Version]
  46. Liu, C.-H.; Di, Y.P. Analysis of RNA Sequencing Data Using CLC Genomics Workbench. Methods Mol. Biol. 2020, 2102, 61–113. [Google Scholar] [CrossRef]
  47. Pfaffl, M.W.; Tichopad, A.; Prgomet, C.; Neuvians, T.P. Determination of stable housekeeping genes, differentially regulated target genes and sample integrity: BestKeeper–Excel-based tool using pair-wise correlations. Biotechnol. Lett. 2004, 26, 509–515. [Google Scholar] [CrossRef]
  48. Wang, X.; Zhang, X.; Yuan, J.; Wu, J.; Deng, X.; Peng, J.; Wang, S.; Yang, C.; Ge, J.; Zou, Y. Evaluation of the performance of serum miRNAs as normalizers in microRNA studies focused on cardiovascular disease. J. Thorac. Dis. 2018, 10, 2599–2607. [Google Scholar] [CrossRef]
  49. Geigges, M.; Gubser, P.M.; Unterstab, G.; Lecoultre, Y.; Paro, R.; Hess, C. Reference Genes for Expression Studies in Human CD8 + Naïve and Effector Memory T Cells under Resting and Activating Conditions. Sci. Rep. 2021, 10, 9411. [Google Scholar] [CrossRef]
  50. Song, J.; Bai, Z.; Han, W.; Zhang, J.; Meng, H.; Bi, J.; Ma, X.; Han, S.; Zhang, Z. Identification of Suitable Reference Genes for qPCR Analysis of Serum microRNA in Gastric Cancer Patients. Dig. Dis. Sci. 2011, 57, 897–904. [Google Scholar] [CrossRef]
  51. Szabó, D.R.; Luconi, M.; Szabó, P.M.; Tóth, M.; Szücs, N.; Horányi, J.; Nagy, Z.; Mannelli, M.; Patócs, A.; Rácz, K.; et al. Analysis of cir-culating microRNAs in adrenocortical tumors. Lab. Investig. 2014, 94, 331–339. [Google Scholar] [CrossRef][Green Version]
  52. Butz, H.; Mészáros, K.; Likó, I.; Patocs, A. Wnt-Signaling Regulated by Glucocorticoid-Induced miRNAs. Int. J. Mol. Sci. 2021, 22, 11778. [Google Scholar] [CrossRef] [PubMed]
  53. Muñoz, J.J.; Anauate, A.C.; Amaral, A.G.; Ferreira, F.M.; Watanabe, E.H.; Meca, R.; Ormanji, M.S.; Boim, M.A.; Onuchic, L.F.; Heilberg, I.P. Ppia is the most stable housekeeping gene for qRT-PCR normalization in kidneys of three Pkd1-deficient mouse models. Sci. Rep. 2021, 11, 19798. [Google Scholar] [CrossRef] [PubMed]
  54. Xia, X.; Liu, Y.; Liu, L.; Chen, Y.; Wang, H. Selection and verification of the combination of reference genes for RT-qPCR analysis in rat adrenal gland development. J. Steroid. Biochem. Mol. Biol. 2021, 208, 105821. [Google Scholar] [CrossRef] [PubMed]
  55. Gillespie, M.; Jassal, B.; Stephan, R.; Milacic, M.; Rothfels, K.; Senff-Ribeiro, A.; Griss, J.; Sevilla, C.; Matthews, L.; Gong, C.; et al. The reactome pathway knowledgebase 2022. Nucleic Acids Res. 2022, 50, D687–D692. [Google Scholar] [CrossRef]
  56. Mi, H.; Ebert, D.; Muruganujan, A.; Mills, C.; Albou, L.-P.; Mushayamaha, T.; Thomas, P.D. PANTHER version 16: A revised family classification, tree-based classification tool, enhancer regions and extensive API. Nucleic Acids Res. 2021, 49, D394–D403. [Google Scholar] [CrossRef]
  57. Wu, T.; Lin, Y.; Xie, Z. MicroRNA-1247 inhibits cell proliferation by directly targeting ZNF346 in childhood neuroblastoma. Biol. Res. 2018, 51, 13. [Google Scholar] [CrossRef][Green Version]
  58. Muñoz, J.J.; Anauate, A.; Amaral, A.G.; Ferreira, F.M.; Meca, R.; Ormanji, M.S.; Boim, M.A.; Onuchic, L.F.; Heilberg, I.P. Identification of housekeeping genes for microRNA expression analysis in kidney tissues of Pkd1 deficient mouse models. Sci. Rep. 2020, 10, 231. [Google Scholar] [CrossRef][Green Version]
  59. Love, M.I.; Huber, W.; Anders, S. Moderated estimation of fold change and dispersion for RNA-seq data with DESeq2. Genome Biol. 2014, 15, 550. [Google Scholar] [CrossRef][Green Version]
  60. Hu, Z.; Gao, S.; Lindberg, D.; Panja, D.; Wakabayashi, Y.; Li, K.; Kleinman, J.E.; Zhu, J.; Li, Z. Temporal dynamics of miRNAs in human DLPFC and its association with miRNA dysregulation in schizophrenia. Transl. Psychiatry 2019, 9, 196. [Google Scholar] [CrossRef]
  61. Esteva-Socias, M.; Gómez-Romano, F.; Carrillo-Ávila, J.A.; Sánchez-Navarro, A.L.; Villena, C. Impact of different stabilization methods on RT-qPCR results using human lung tissue samples. Sci. Rep. 2020, 10, 3579. [Google Scholar] [CrossRef]
Publisher’s Note: MDPI stays neutral with regard to jurisdictional claims in published maps and institutional affiliations.

Association of Chronic Central Serous Chorioretinopathy with Subclinical Cushing’s Syndrome

https://doi.org/10.1016/j.ajoc.2022.101455

Abstract

Purpose

To report the clinical course of a patient with central serous chorioretinopathy (CSCR) secondary to subclinical hypercortisolism before and after adrenalectomy.

Observations

A 50-year-old female patient with multifocal, chronic CSCR was found to have an adrenal incidentaloma and was diagnosed with subclinical hypercortisolism. Patient elected to undergo minimally-invasive adrenalectomy and presented at 3 months after surgery without subretinal fluid.

Conclusions and Importance

Subclinical Cushing’s Syndrome (SCS) may present an underrecognized risk factor for developing chronic CSCR. Further investigation is needed to determine the threshold of visual comorbidity that may influence surgical management.

Keywords

Central serous chorioretinopathy
Subclinical Cushing’s syndrome
Hypercortisolism
Adrenalectomy
Retina
Surgical intervention

1. Introduction

Central serous chorioretinopathy (CSCR) is characterized by accumulation of fluid in the subretinal or sub-RPE space, often with consequential visual impairment. Chronic CSCR has been reported as a manifestation of hypercortisolism due to Cushing’s syndrome and subclinical hypercortisolism.1,2 However, the latter is often underrecognized owing to its inherently subtle nature and the optimal threshold for intervention based on associated comorbidities remains unclear. Herein we report the clinical course of a patient with CSCR secondary to subclinical hypercortisolism before and after adrenalectomy.

2. Case report

A 50-year-old female presented with blurred, discolored spots in the right eye for several months. Her past medical history included mild hypertension treated with amlodipine. Past ocular and family history were noncontributory.

On exam, Snellen visual acuity was 20/50 OD, 20/25 OS. Her pupils, intraocular pressure, and anterior segment exam were within normal limits. Dilated fundus exam revealed bilateral, multifocal areas of subretinal fluid and mottled pigmentary changes (Fig. 1A). Optical coherence tomography confirmed areas of subretinal fluid and other areas of outer retinal atrophy (Fig. 1B). Fundus autofluorescence revealed areas of hyperautofluorescence that highlighted the fundoscopic findings (Fig. 1C). Fluorescein angiography showed multifocal areas of expansile dot leakage (Fig. 1D). Altogether these findings were consistent with multifocal, chronic CSCR.

Fig. 1

  1. Download : Download high-res image (1MB)
  2. Download : Download full-size image

Fig. 1. Multimodal imaging of bilateral multifocal central serous chorioretinopathy. Fundus photographs reveal multifocal subretinal fluid and pigmentary changes (Fig. 1A). Optical coherence tomography demonstrates subretinal fluid and outer retinal atrophy (Fig. 1B). Areas of hyperautofluorescence highlight the fundoscopic findings of subretinal fluid (Fig. 1C). Fluorescein angiography showing multiple areas of expansile dot leakage (Fig. 1D).

On further clinical follow-up, an adrenal incidentaloma (AI) was detected when the patient underwent imaging for back pain. Subsequently she saw an endocrinologist; she had a normal serum cortisol, but low ACTH and an abnormal dexamethasone suppression test. This led to a diagnosis of subclinical hypercortisolism and provided a reason for her hypertension and chronic CSCR.

Since the blur and relative scotomata interfered with her daily activities, she elected to try eplerenone, which yielded a moderate but suboptimal therapeutic response at 50 mg daily. While contemplating photodynamic therapy, in discussion with her endocrinologist, the patient opted to undergo minimally-invasive adrenalectomy. At last follow-up 3 months after surgery and 6 years after her initial presentation, she has been off eplerenone and without subretinal fluid (Fig. 2).

Fig. 2

  1. Download : Download high-res image (1MB)
  2. Download : Download full-size image

Fig. 2. Optical coherence tomography imaging at presentation and at last follow-up 3 months after adrenalectomy. There is a significant improvement in subretinal fluid in both eyes, though outer retinal irregularity remains.

3. Discussion

CSCR has previously been associated with many risk factors including exposure to excess steroid. A recent study analyzing a nationally representative dataset of 35,000 patients found that patients with CSCR had a higher odds of Cushing’s syndrome (OR 2.19, 95% CI 1.33 to 3.59, p = 0.002) than exposure to exogenous steroids (OR 1.14, 95% CI 1.09 to 1.19, p < 0.001)1 Our case highlights the importance of thorough medication reconciliation and careful consideration of comorbid conditions in patients with chronic CSCR.

In recent years, subtle endogenous hypercortisolism, termed subclinical Cushing’s syndrome (SCS), has been of particular interest in the endocrinology literature because it can be a challenging diagnosis and the most appropriate management remains controversial.3 In general, SCS is comprised of: 1) the presence of an adrenal incidentaloma or mass, 2) biochemical confirmation of cortisol excess, and 3) no classic phenotypic manifestations of Cushing’s syndrome.4 Since adrenal incidentaloma has an estimated prevalence of 1–8% of the population,5 it is quite possible that SCS is an underrecognized risk factor for CSCR.

SCS may potentiate metabolic syndrome and osteoporosis; studies have found that surgical resection of adrenal incidentalomas improve weight, blood pressure, and glucose control. Consequently, some authors recommend those with SCS-associated comorbidities be considered for resection.6 An important consideration in these patients is how visual comorbidity factors into intervention. In our patient’s case, the recurrent CSCR, hypertension, and increased risk of metabolic syndrome were sufficient reasons to elect to have surgery.

4. Conclusion

In summary, SCS is a condition of subtle cortisol dysregulation that may represent an underrecognized risk factor for chronic CSCR. Further investigation is needed to determine the threshold of visual comorbidity that may influence surgical management.

Patient consent

Consent to publish the case report was not obtained. This report does not contain any personal information that could lead to the identification of the patient.

Acknowledgments and Disclosures

Grant support was from the J. Arch McNamara Retina Research Fund. The following authors have no financial disclosures: RRS, AS, AC All authors attest that they meet the current ICMJE criteria for Authorship. No other contributions to acknowledge.

References

© 2022 The Authors. Published by Elsevier Inc.