This is the first study with real world data focused on evaluating the efficacy and safety of osilodrostat in patients with ECS in Spain. In addition, it represents the second largest series of patients with ECS treated with osilodrostat after the Dormoy study [6]. The main results of our study reveal that: (i) osilodrostat therapy is usually initiated as second or even third line therapy in patients with ECS, despite the fact that most of these patients present with severe hypercortisolism; (ii) its efficacy is high, leading to UFC normalization in approximately 90% of the cases and (iii) overall, it is a well-tolerated drug although AI is a relatively frequent AE.
In relation to the etiologies of ECS in our series, we found that aggressive lung carcinomas and pancreatic NET were the most frequent ACTH/CRH-secreting tumors. This distribution is quite different than the global epidemiology reported in other series where bronchial carcinoids are the most frequent cause [19]. The higher prevalence of aggressive tumors in our series is probable explained by a selection bias since in general patients who received osilodrostat had a more severe CS, and it is known that in general metastatic and malignant tumors are associated with higher UFC and a more severe CS phenotype [20].
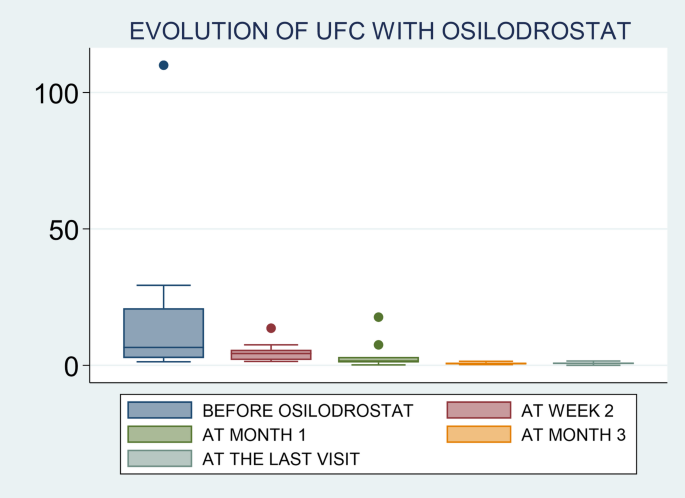
Osilodrostat is an oral imididazole derivate that inhibits 11β-hydroxylase, the enzyme that catalyzes the final step of cortisol synthesis in the adrenal cortex [9]. It has been approved by the FDA and the EMA in 2020 for CD (CS in Europe) treatment in adults not cured by pituitary surgery or in whom pituitary surgery is not appropriate. There are several clinical trials in patients with CD that have demonstrated a rapid and sustained reduction in cortisol levels and a significant improvement of the cardiometabolic profile and quality of life in these patients [13,14,15, 21]. Nevertheless, only few data exist on the efficacy of this therapy in real-world setting. One of the largest studies was conducted by Dormoy A et al. [6] and included 33 patients with severe CS due to an ECS. In this study, osilodrostat led to control of hypercortisolism in 82% of cases when used as first-line monotherapy, 100% when used as second-line monotherapy, and in 68% in the group receiving combination therapy. Another very recent real-world study (ILLUSTRATE) focused on evaluating the efficacy of osilodrostat use in patients with various etiologies of CS in the United States, with 42 patients included of whom three had ECS, described normalization of UFC in 70% of the cases [22]. Thus, our results (88% of complete UFC normalization) are in line with the reported in previous series, and in fact, they are even slightly better than the described by other authors [22]. In this regard, it is important to highlight that although we were not able to identify predictors of response (probably due to the low number of non-complete responders patients, only 2 cases), we observed that the initial employed doses of osilodrostat were associated with the time to achieve normalization of UFC. It means, as higher initial doses of osilodrostat, shorter time to normalize UFC would be needed. In this regard, it is important to individualize the management of patients with CS, not only in the selection of the most appropriate drug, but also in the doses of the treatment and approach (titration or B&R). For example, if a patient was previously treated with high doses of other steroidogenesis inhibitors or has intense hypercortisolism, we should start osilodrostat at doses of at least 4–10 mg/day, or even higher. For example, in our study the most commonly used initial dose was 4 mg/day (in 12 out of the 17 patients; 70%), but 9 out of these 12 patients (65%) had to increase the dose to achieve proper hypercortisolism control. In fact, we observed that the final dose that controlled hypercortisolism was 4 mg/day only in 3 patients. Thus, we should consider higher starting doses in these patients with ECS and severe hypercortisolism. In the ILLUSTRATE study, the proportion of patients treated with 2 mg twice daily was 64.3% [22], however, most of the cases (34 out of 42) in these study had CD with a less severe hypercortisolism. Nonetheless, it is possible that if higher doses were employed from the beginning the proportion of response would have been higher, or at least a faster control of hypercortisolism would have been reached as stipulated in the algorithm proposed by Dormoy et al. [6]. Nonetheless, we found that there is wide heterogeneity of the initiation doses and the time to UFC normalization across the patients. For example, the two patients with the shortest time of normalization (patients 10 & 12) had relatively low doses compared to some other patients (notably patient 2 who did not reach complete response, and patient 4 who normalized UFC after 2 weeks). In this regard, in general it seems that the response to osilodrostat is quite unpredictable.
It is important to highlight that patients with ECS had a higher mortality when compared with CS of other etiologies [23]. For example, in our study 35% of the patients died after a short follow-up period and 88% of the patients had severe hypercortisolism. Severe hypercortisolism is a life-threatening medical condition requiring immediate systemic assessment and urgent therapy [24]. For this reason, the control of hypercortisolism should be prioritized over etiological investigation. For this purpose, the first-line treatment for rapidly reducing cortisol levels includes adrenal steroidogenesis inhibitors such as etomidate and osilodrostat that have a rapid onset of action [5, 6]. Despite these recommendations and the high UFC levels in our cohort, we can see that due to the current prescription conditions in Spain, most of the patients were treated with osilodrostat as second or even third line-therapy. In fact, only two of the 17 patients received osilodrostat as first line therapy and the time from the diagnosis of ECS for the initiation of osilodrostat was longer than 5 months in ten out of the 17 patients. In this regard we have to take into account that in these patients the time to achieve control of hypercortisolism is especially important because the risk of severe complications such as thromboembolism or intercurrent infections is very high [25]. Supporting the use of osilodrostat in this scenario, a recent Phase II study in Japan reported that osilodrostat effectively reduced UFC levels in all nine patients with severe endogenous CS, with over 80% reduction in 6 out of 7 patients by week 12 [26]. Another very potent steroidogenesis inhibitor, with a very rapid onset of action is etomidate, but this treatment should be administered intravenously; thus, it is usually reserved for patients with severe CS who require urgent control of hypercortisolism and in whom oral administration is not feasible (e.g., severe psychosis, sepsis, or ileus) [8].
Osilodrostat was overall well tolerated in our study population, with a low incidence of AEs. The most notable AE observed was AI, reported in 17.6% of the treated patients. This rate is considerably lower than that reported in the LINC 3 clinical trial, where approximately 54% of participants experienced AEs related to hypocortisolism, including both cortisol withdrawal syndrome (CWS) and AI.
However, it is important to recognize the challenges associated with evaluating CWS, particularly in patients undergoing active oncological treatment. These overlapping clinical presentations may have contributed to an underestimation of CWS in our cohort. Only one patient was explicitly reported to have experienced CWS, resulting in a total hypocortisolism-related AE incidence of 23.5%. The escalation of osilodrostat dosing was highly variable among patients, and no consistent correlation was identified between dosage levels and the risk of AEs.
Given this potential hypocortisolism due to its high efficacy and quick onset of action, initiation of education and counseling of patients receiving osilodrostat is essential is recommended to be performed at treatment initiation. Patients should be trained to recognize early signs and symptoms of hypocortisolism to ensure timely intervention. Some centers are recommending stress dose of corticoids at treatment initiation. Anyway, nonspecific direct cortisol immunoassays may overestimate cortisol levels, potentially masking the diagnosis of adrenal insufficiency in patients with CS receiving an 11β-hydroxylase inhibitor [9]. In this context, the B&R regimen appears to be a particularly safe and effective therapeutic approach, especially considering the dynamic and often unpredictable fluctuations in cortisol secretion by ectopic tumors and the presumed positive effect of the oncologic antitumoral treatment. What is more, given its high potency, osilodrostat can be used as monotherapy without needing combination with other agents. This reduces the potential for increased side effects and minimizes polypharmacy compared to other oral inhibitors of steroidogenesis.
Nevertheless, case reports of prolonged adrenal AI has been reported following discontinuation of osilodrostat, reinforcing the need for sustained, close monitoring on long term after therapy cessation [27,28,29].
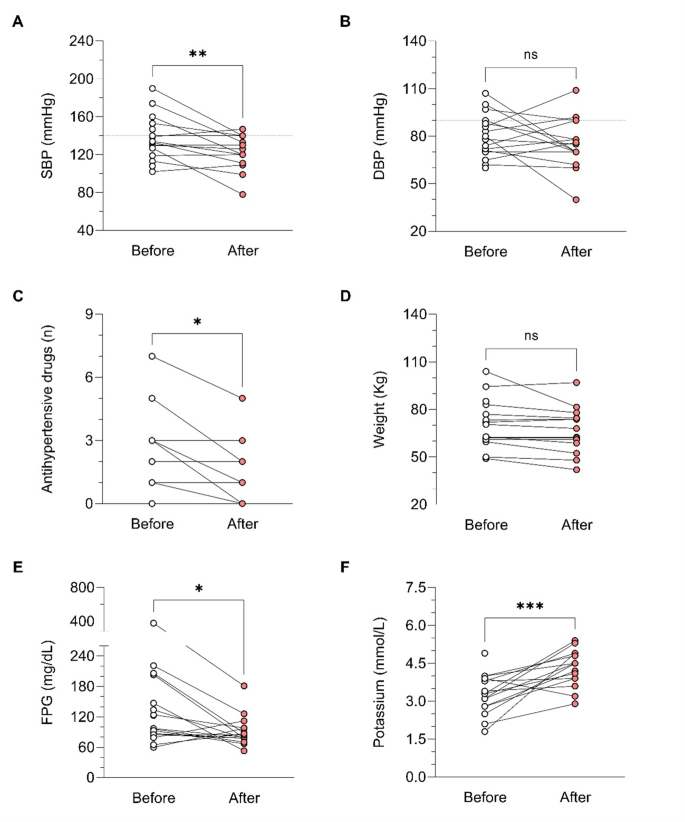
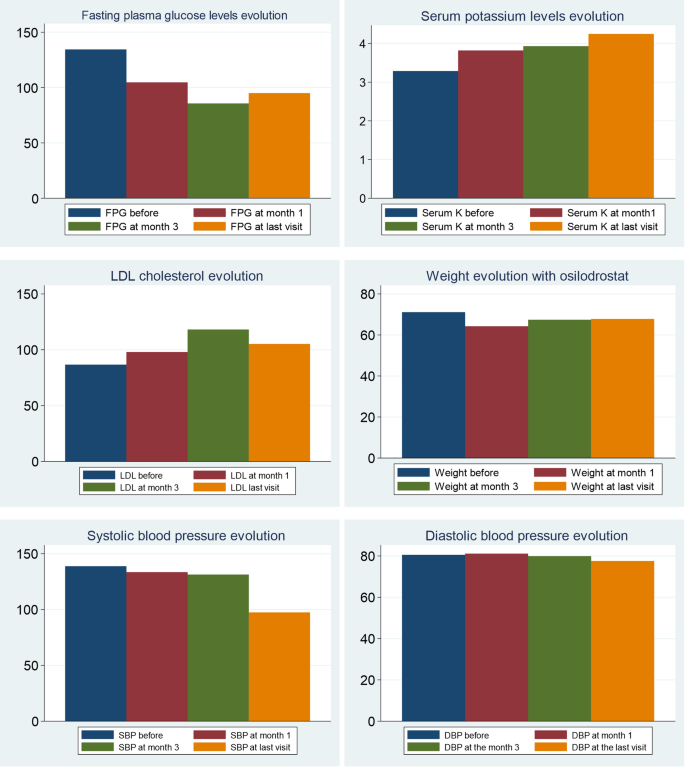
During osilodrostat therapy, gradual improvements in cardiovascular, metabolic parameters including blood pressure, glycemia, weight and normalization of potassium levels. As in Spain osilodrostat have been majorly prescribed in the second line previous treatment of severe hypokaliemia by potassium supplementation and treatment with mineralocorticoid antagonists (MRA) have been already initiated and sever hypopotassemia remitted. Anyway, during osilodrostat treatment as described by other authors potassium improved rapidly permitting the reduction of potassium and MRA therapy. These effects reflect also the dual inhibitory action of osilodrostat on both CYP11B1 and even in a lower degree also on CYP11B2 enzymes. Except for a single case of QT interval prolongation, no major cardiovascular events, electrolyte imbalances or liver function or increase in lipids were reported in our patient group, which aligns with the safety profiles of all other adrenal steroidogenesis inhibitors.
We are aware that our study has some limitations. One of them is the reduced number of patients included. Nevertheless, this is still the second largest series of cases reported in the literature. One of the main limitations is the retrospective nature of the study, and the variability of the protocols used in every participant centers, including different starting doses, no available information on UFC and on cardiometabolic parameters in all the evaluation times. In addition, we are aware that the classification of CS as severe based only on UFC has some limitations as the association with severe complications should also be considered. In this regard, a patient may have a severe CS due to the development of these complications (severe hypokalemia and complications such as uncontrolled hypertension, sepsis, heart failure or acute psychosis, among others) and maintain UFC < 5 the ULN [30]. Moreover, it is not uncommon that patients with severe CS have deteriorated kidney function that may also underestimate UFC levels [31]. Nonetheless, despite these limitations, the results provide invaluable information on the real-world use of osilodrostate in patients with ECS Spain, supporting the results of the clinical trials.


 Accepted manuscripts