Cell culture and reagents
A Mycoplasma Stain Assay kit (C0296, Beyotime, China) was used to test all cell lines for mycoplasma contamination prior to use. HEK-293T and AtT-20 cells were kindly provided by the Cell Bank, Chinese Academy of Sciences. In cell culture, the HEK293T cells (Passage number < 20) were cultivated in Dulbecco’s Modified Eagle Medium (DMEM; Basal Media, L110KJ) supplemented with 10% (v/v) fetal bovine serum (FBS; Basal Media, S660JY). The AtT-20 cells (Passage number < 20) were cultured in Ham’s F-12K (Kaighn’s) medium (Basal Media, L450KJ) supplemented with 2.5% FBS and 15% horse serum (Absin, abs989). All cell lines were maintained in a humidified atmosphere with 5% CO 2 at 37 ℃.
Isolation and cultivation of pituitary tumor cells
Freshly obtained corticotroph tissues were rinsed with Hank’s Balanced Salt Solution (HBSS, Gibco, 14,025,092) and cut into small pieces with a sterile scalpel. The fragments were digested in HBSS supplemented with 100 U/ml collagenase, type IV (Gibco, 17104019) at 37 ℃ for 6–8 h. Following digestion, the dispersed cells were filtered using a 100 μm cell strainer (Beyotime Biotechnology, FSTR100) and resuspended in ACK Lysing Buffer (Gibco, A1049201) for 5 min. The cells were subsequently resuspended in DMEM supplemented with 10% FBS and plated in a cell culture dish (BIOFIL, TCD010100). After 48 h of incubation, the floating tumor cells were utilized for subsequent experiments.
Plasmids
Supplementary Table 1 provides additional details. The pLVshRNA-EGFP(2A)Puro cloning vector was used to generate the shRNAs targeting genes at various regions. The sequences of the shRNAs can be found in Supplementary Table 2.
Transfection
To prepare the polyethyleneimine (PEI) transfection reagent, 1 g of Polyethylenimine Linear (PEI) with a molecular weight of 40,000 (Yeasen, 40816ES03) was precisely weighed and dissolved in 900 mL of ultrapure water within a 1 L glass beaker. The pH of the solution was carefully adjusted to a range of 6.80 to 6.90 using a sodium hydroxide solution. Subsequently, the solution was diluted to a final volume of 1 L. Finally, the solution was filtered through a 0.22 µm filter to obtain a clear and sterile 1 mg/mL PEI solution.
For cell transfection, HEK293T cells were seeded in culture dishes one day prior to transfection, with a target cell confluency of 70% to 90% at the time of transfection. For the PEI transfection procedure, a 1.5 mL centrifuge tube was prepared. Into this tube, 200 µL of Opti-MEM serum-free medium (Gibico, 31,985,070), 6 µg of plasmid DNA, and 18 µL of the PEI reagent were added, thereby maintaining a 1:3 mass/volume ratio of plasmid to PEI. The components were thoroughly mixed by vortexing for 30 s, followed by a brief centrifugation to collect the liquid at the bottom of the tube. The mixture was then incubated at room temperature for 15 min before being added dropwise to a 6 cm culture dish (BIOFIL, TCD010060). Subsequent experimental operations can be performed 24 to 48 h later.
Mass spectrometry (MS)
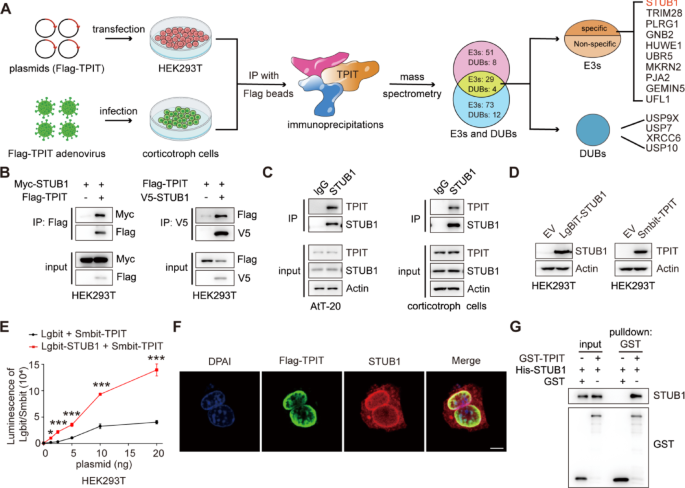
Approximately 10 million primary corticotroph tumor cells were infected with Flag-TPIT adenovirus at a multiplicity of infection (MOI) of 10. The cells were lysed using a Triton X-100 lysis buffer (150 mM NaCl, 50 mM Tris, and 1% Triton X-100, pH 7.5), and the immunoprecipitation complex was isolated utilizing anti-DYKDDDDK affinity beads (Smart-lifesciences Biotechnology). The beads were washed four times with Triton X-100 lysis buffer and the proteins were eluted with elution buffer (8 M urea, 100 mM Tris, pH 8.0). The eluted proteins were subsequently identified using MS.
The 10 million HEK-293T cells were transfected with Flag-TPIT for 48 h, followed by lysis. Immunoprecipitation of Flag-TPIT and its bound proteins was performed using 100 μL DYKDDDDK affinity beads. The beads were then washed using lysis buffer and boiled in SDS-PAGE sample buffer for 5 min at 95 ℃. The interacting proteins in the gel were identified by immunoblotting and MS.
Proteomic data analysis was done by Shanghai Luming Biological Technology Co., Ltd. using an Easy-NLC1200 nano-HPLC system. Peptide samples were re-dissolved in Buffer A (0.1% formic acid aqueous solution) and separated on a 75 μm × 150 mm RP-C18 column at 300 nL/min. They were cleaned by a gradient with blank solvent for 30 min. The eluates were analyzed by Q-Exactive MS in DDA mode, scanning 300–1600 m/z. The 20 strongest fragment profiles were collected after each full scan using HCD with an NCE of 28 and dynamic exclusion of 25 s. MS1 resolution was 45,000 at m/z 200, AGC target 1E6, and max injection time 50 ms. MS2 resolution was 15,000, AGC target 1E5, and max injection time 50 ms.
Co-immunoprecipitation (Co-IP)
The cells in 6 cm dish were lysed with 800 μL Triton X-100 lysis buffer containing a protease inhibitor cocktail and sonicated. 100 μL of the lysate was used as input, and the remaining 700 μL lysates were then incubated overnight with antibody (1–2 μg), followed by incubation with 30 μL rProtein A/G Beads (Smart-lifesciences Biotechnology, SA032025) for 1 h at room temperature. The immunoprecipitates were then washed five times with lysis buffer and analyzed by immunoblotting.
Immunoblotting
The total proteins were extracted with Triton X-100 lysis buffer supplemented with protease inhibitors (NCM Biotech, P003) and subsequently sonicated with a Qsonica Q700 Sonicator. The protein concentrations were measured using a BCA protein assay kit (Yoche Biotech, YSD-500T), with absorbances at 562 nm measured using a Biotek 800 TS microplate reader. Aliquots of whole-cell lysates were mixed with SDS-PAGE loading buffer and separated on SDS-PAGE, followed by transfer onto polyvinylidene difluoride membranes (Millipore, ISEQ10100). The antibodies used for probing the blots are listed in Supplementary Table 3.
Ubiquitination assay
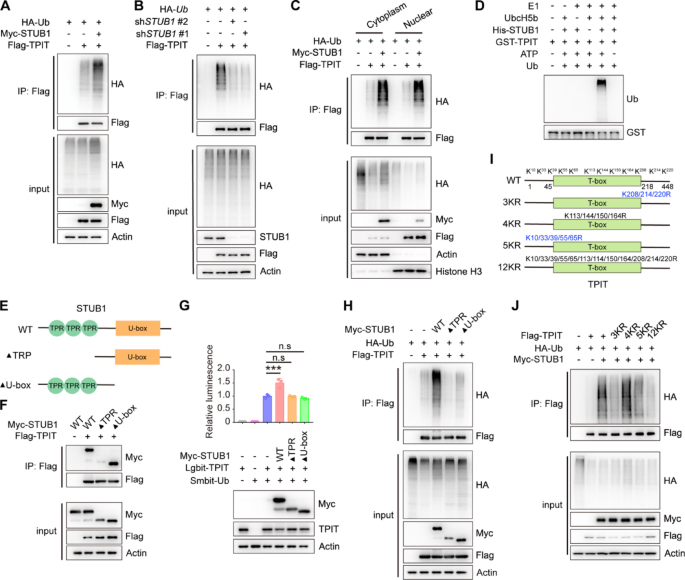
HEK-293T cells were cultured in 6 cm plates and co-transfected with the total 6 μg plasmids for 24 h and then lysed with RIPA lysis buffer (50 mM Tris–HCl, 150 mM NaCl, 5 mM EDTA, 1% Triton X-100, 0.5% sodium pyrophosphate, 0.1% SDS, pH 7.4) containing a protease inhibitor cocktail. The whole-cell lysates were then incubated overnight with 30 μL anti-DYKDDDDK affinity beads. The beads were washed five times with lysis buffer and analyzed by immunoblotting using the specified antibodies.
NanoBiT assay
HEK-293T cells were cultured in 6-well plates and transfected with plasmids containing LgBiT and SmBiT. The cells were lysed using cell lysis buffer (Vazyme, DL101–01), and centrifuged, and the proteins in the supernatant were quantified using a BCA protein assay kit. Equal volumes and amounts of protein were added to a white 96-well plate (Absin, abs7016), followed by the addition of the same volume of 20 μM luminescent substrate Furimazine (Topscience, T15359). The luminescence was measured using the BioTek Synergy Neo2 Hybrid Multimode Reader.
Immunofluorescence microscopy
The AtT-20 cells were infected with lentivirus containing Flag-TPIT. Subsequently, 100,000 of the infected cells were seeded in a 12-well plate that had been pre-coated with Matrigel (Absin, abs9410). The cells were fixed with 4% formaldehyde (Beyotime, P0099) for 20 min and then washed with PBS (Servicebio, G4202). Following this, the cells were permeabilized using a cold 0.2% Triton X-100 solution for 15 min and incubated overnight at 4 ℃ with anti-STUB1 and Flag antibodies after blocking with 3% BSA. The cells were then incubated with secondary antibodies conjugated with Alexa 488 (Cell Signaling Technology, 4412S) or Alexa 555 (Cell Signaling Technology, 4409S) for 1 h at 37 ℃. Nuclei were stained using DAPI (Beyotime, C1002), and the stained sections were evaluated and imaged using a Zeiss LSM880 lightning confocal microscope (Carl Zeiss AG, Oberkochen, Germany).
GST pulldown assay
The GST or His-tagged proteins were purified and GST pull-down assays were performed as previously described [21].
Nuclear-cytoplasmic separation
Nuclear and cytoplasmic proteins were separated using the Nuclear and Cytoplasmic Protein Extraction Kit (Beyotime, P0027).
In vitro ubiquitination assay
The GST-TPIT and STUB1-His proteins were purified, and subsequently subjected to an in vitro ubiquitination assay using the Ubiquitinylation kit (Enzo Life Sciences, BML-UW992).
Stable cell lines
The HEK-293T cells were cultured in 10 cm plates. For transfection, 6 μg of psPAX2, 3 μg of pMD2.G, 9 μg of the targeting plasmid, and 54 μL of PEI transfection reagent were added to 1 mL of Opti-MEM medium. The mixture was vortexed and incubated at room temperature for 15 min before being added to the cell culture dishes. After 6-8 h of infection, the cell supernatant was removed and replaced with fresh cell culture medium. After 48 of transfection, media containing the virus were collected and filtered through 0.45μm nitrocellulose filters (Millipore, SLHV033RS). The virus was then concentrated using PEG8000 (5 × PEG8000: 150 mm NaCl; 25% PEG8000) and used to infect AtT-20 cells. After 6-8 h of infection, the cell supernatant containing the lentivirus was removed and replaced with fresh cell culture medium. After 48 h of infection, the medium was changed to one containing puromycin to select the infected cells. The stably transfected cells were selected using puromycin at 1 μg/ml for 1 week (Beyotime, ST551).
Cycloheximide (CHX) Chase Assay
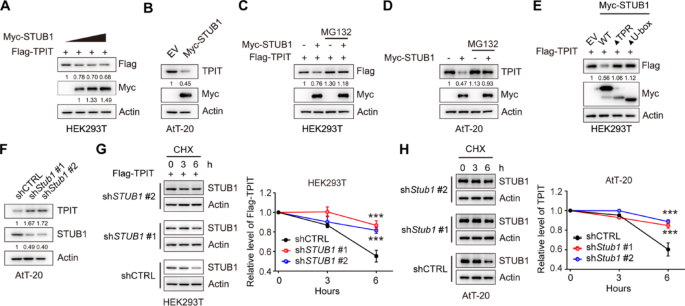
The 500,000 stable cells were seeded into a 6-well plate with 3 mL of culture medium. The cells were treated with 100 μg/ml CHX (ApexBio, A8244), collected at specified time intervals, and analyzed by immunoblotting.
Dual-luciferase gene reporter assays
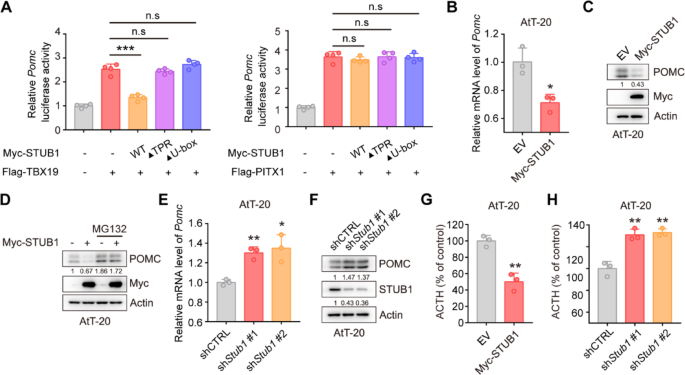
The pGL4.15 vector was utilized to create the luciferase reporter vector Pomc-Luc by inserting the mouse Pomc promoter sequence (–646 to + 65). HEK-293T cells were transfected with pGL4.15-Pomc-Luc, pRL-TK, Flag-TPIT, and Myc-STUB1 (wild-type or mutants). The dual-luciferase reporter assay was conducted using the Dual Luciferase Reporter Assay Kit (Vazyme, DL101-01).
Quantitative real-time PCR (qRT-PCR)
Prepare 100,000–200,000 cells, and total RNA was extracted from cells using a total RNA extraction kit (NCM Biotech, M5105). The concentration of RNA was determined using a DS-11 microphotometer. Subsequently, cDNA synthesis was carried out using the cDNA synthesis kit (ABclonal, RK20429). qRT-PCR amplification was performed using a SYBR Green qPCR kit (ABclonal, RK21203) in accordance with the manufacturer’s instructions. The qRT-PCR was conducted using an ABI 7500 Real-Time PCR System (Applied Biosystems). The primer sequences used for qRT-PCR are listed in Supplementary Table 4.
Luminescent cell viability assay
The numbers of AtT-20 cells were measured using a Beckman Coulter Z2 cell counter. Following this, a total of three thousand cells in 100 μL media were plated per well in white 96-well plates (Absin, abs7016). Subsequently, the cell viability was assessed using the CellCounting-Lite 2.0 Luminescent Cell Viability Assay (Vazyme, DD1101-03) with the BioTek Synergy Neo2 Hybrid Multimode Reader.
Enzyme-linked immunosorbent assay (ELISA)
A total of 40,000 AtT-20 cells in 1 mL of culture medium were seeded into 12-well plates. The supernatants were collected after 24 h and then centrifuged at 4 ℃ at 2000 g for 20 min. The ACTH levels were measured by an ELISA kit (Immunoway, KE1520).
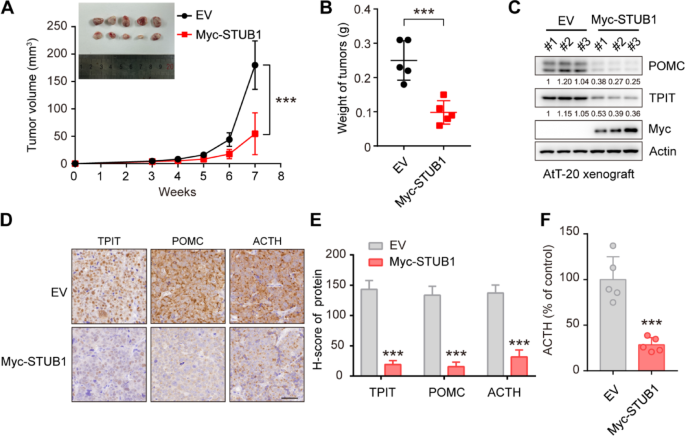
Xenograft model
The Ethical Review Board at Shanghai Jiao Tong University School of Medicine’s Ruijin Hospital approved of the study’s animal experimentation. The protocols followed the Institutional Animal Care and Use Committee’s (IACUC) guidelines. Four-week-old nu/nu female mice (The number of mice in each group was 5) were procured and maintained in a controlled specific pathogen-free environment. One million AtT-20 cells were combined with Matrigel (Yeasen, 40187) in a 100-μL volume and then injected subcutaneously. Xenograft tumor volumes were assessed by measuring two perpendicular diameters with calipers and individually calculated using the formula: volume = a × b2/2 (where a denotes length and b denotes width). The weights of the mice and the dimensions of the tumors were measured twice a week. Subsequently, the mice were euthanized, and the tumors were excised, measured, and photographed.
Patient and tissue samples
Samples of pituitary adenomas (PAs) were obtained from patients undergoing surgical procedures at Ruijin Hospital between 2016 and 2023. The study received ethical approval from the Ethical Review Board of Ruijin Hospital, affiliated with Shanghai Jiao Tong University School of Medicine. All patients whose tumor tissues were utilized in this study provided written informed consent. Information on the patients is provided in Supplementary Table 5.
RNA sequencing and GTEx data analysis
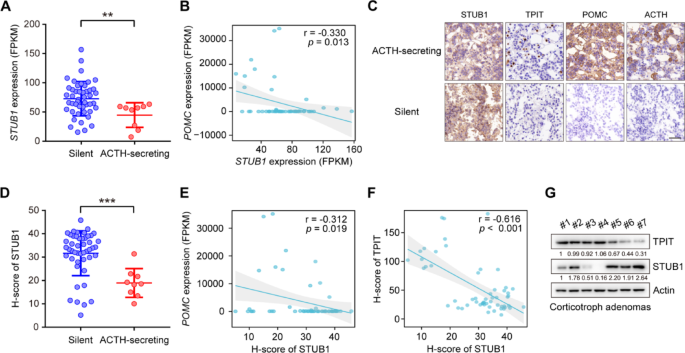
The raw mRNA read counts were normalized using Fragments Per Kilobase of exon model per Million mapped fragments (FPKM). Specifically, read counts from 107 normal pituitary samples obtained from the GTEx V8 database were normalized by FPKM. To address batch effects between our data and the GTEx normal data, the normalizeBetweenArrays function in the limma package in R, a tool commonly utilized for powering differential expression analyses in RNA-sequencing and microarray studies, was used. The information on the expression of the genes (TPIT, POMC, and STUB1) is shown in Supplementary Table 5.
Immunohistochemistry (IHC)
The immunohistochemistry was performed as previously described [21]. For IHC staining of FFPE tumor tissue sections, dewax and rehydrate sections sequentially in dewaxing solutions (Ⅰ, Ⅱ, Ⅲ, 10 min each), anhydrous ethanol (Ⅰ, Ⅱ, Ⅲ, 5 min each), and distilled water (5 min). Perform antigen retrieval by boiling in sodium citrate buffer (pH 6.0) for 30 min using a microwave histoprocessor, then cool and wash in PBS (pH 7.4, 3 × 5 min). Block endogenous peroxidase with 3% hydrogen peroxide (25 min, RT, dark), then wash in PBS (3 × 5 min). Block with 3% BSA (or rabbit serum for goat primary antibodies, 30 min, RT). Incubate with primary antibody in PBS overnight at 4 ℃. Wash in PBS (3 × 5 min), then incubate with HRP-labeled secondary antibody (50 min, RT). Wash again in PBS (3 × 5 min), add DAB solution, and monitor under a microscope until brownish-yellow color appears, then rinse with tap water. Restain nuclei with Gill’s hematoxylin (3 min), wash, differentiate, and rinse with running water. Dehydrate in 75% alcohol, 85% alcohol, anhydrous ethanol (twice), n-butanol, and xylene (each for 5 min), then seal with mounting medium. Examine under a white light microscope.The expression of STUB1 and TPIT was assessed using the H-Score method [H-SCORE = ∑ (PI × I) = (percentage of cells with weak intensity × 1) + (percentage of cells with moderate intensity × 2) + (percentage of cells with strong intensity × 3)], using QuantCenter 2.3 software. The quantification of expression in each sample was conducted in 10 randomly selected fields (at a magnification of 400×) for each case, by two impartial observers who were unaware of the participants’ medical characteristics. The information on the H-Scores (TPIT and STUB1) is shown in Supplementary Table 5.
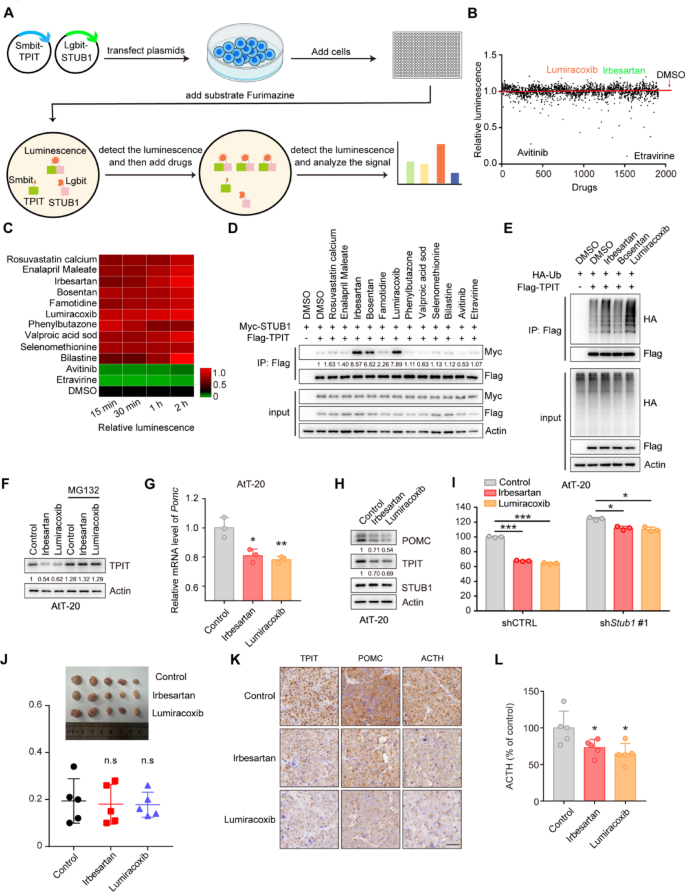
High-throughput Nanobit drug screening
The HEK-293T cells in a 10 cm dish were transfected with 3 µg of Smibt-TPIT and 3 µg of Lgibt-STUB1 plasmids for 24 h. Then, 25 μL of media containing 5000 cells were seeded into CulturPlate-384 (PerkinElmer, 6007680) using the Multidrop Combi (Thermo Fisher Scientific). Subsequently, an equal volume of media containing the luminescent substrate furimazine (20 μM) was added to each well of the 384-well plate. The luminescence emitted by Lgbit-Smbit was quantified using the Explorer high-throughput screening platform (PerkinElmer). The drugs, including 1913 compounds from the Approved Drug Library, were then introduced at final concentrations of 1 μM. The luminescence was measured at 15, 30, 60, and 120 min. The data can be found in Supplementary Table 6. This procedure was conducted at the National Center for Translational Medicine,·Shanghai.
Surface plasmon resonance (SPR)
Surface Plasmon Resonance (SPR) binding assays were performed on a Biacore system (Cytiva) at 25 ℃. The ligand protein was immobilized onto a CM5 sensor chip via amine coupling: chip surface activation with NHS/EDC (10 μL/min, 420 s), protein coupling (30 and 50 μg/mL in pH 4.0 acetate buffer, 5 μL/min, 600 s + 300 s), and blocking with ethanolamine (10 μL/min, 420 s), achieving 8000 RU immobilization. Small molecule analytes (in PBST buffer) were injected using the LMW Kinetics method (flow rate: 30 μL/min; contact: 60 s; dissociation: 300 s) across flow cells 4 (reference) and 3 (ligand). Real-time binding responses were recorded in resonance units (RU).
Statistical analysis
The data were analyzed using GraphPad Prism version 7 (GraphPad Software, La Jolla, CA, USA) and are presented as means ± standard deviation (SD). Statistical analyses encompassed two-tailed t-tests, one-way analysis of variance (ANOVA), two-way ANOVA, and Pearson’s correlation coefficient (r). Statistical significance was denoted by p < 0.05 and is visually represented in the figures by one asterisk (p < 0.05), two asterisks (p < 0.01), or three asterisks (p < 0.001).


).png.48192db5e890311a03c4684cd13eebf5.png)