Important steps in planning tumor surgery include identifying borders between tumor and healthy tissue and assessing the tumor stiffness, e.g. hard and calcified or soft and pliant. For decades, tumors near the surface of the body have been evaluated for stiffness by simple palpation—the physician pressing on the tissue. Because tumors within the skull cannot be palpated, researchers used Magnetic Resonance Elastography (MRE) to assess pituitary tumor stiffness by measuring waves transmitted through the skull into pituitary macroadenomas (PMAs). MRE reliably identified tumors that were soft enough for removal with a minimally-invasive suction technique versus harder tumors requiring more invasive surgery.
“The group developed brain MRE several years ago and is now successfully applying it to clinical diagnosis and treatment,” explained Guoying Liu, Ph.D., Director of the NIBIB Program in Magnetic Resonance Imaging. “This development of a new imaging technique followed by its practical application in surgical planning for better patient outcomes is an outstanding example of one of the main objectives of NIBIB-funded research.”
MRE is a special magnetic resonance imaging technique that captures snapshots of shear waves that move through the tissue and create elastograms—images that show tissue stiffness. John Huston III, M.D., Professor of Radiology at the Mayo Clinic in Rochester, MN, and senior author of the study, explains how MRE works. “MRE is similar to a drop of water hitting a still pond to create the ripples that move out in all directions. We generate tiny, harmless ripples, or shear waves, that travel through the brain of the patient. Our instruments measure how the ripples change as they move through the brain and those changes give us an extremely accurate measure–and a color-coded picture–of the stiffness of the tissue.”
MRE data enables non-invasive surgical planning
Ninety percent of PMAs are soft—nearly the consistency of toothpaste. Therefore, without MRE, surgeons would routinely plan for a procedure called transphenoidal resection that employs very thin instruments that are threaded through the nasal cavity to the pituitary gland at the base of the skull, where suction is used to remove the tumor. However, in about 10% of the cases, the surgeon will encounter a hard tumor. At that point an attempt is made to break-up the tumor—essentially chipping away at it with sharp instruments. If that is not successful, the surgeon must perform a fully-invasive craniotomy that involves removing a piece of the skull bone in order to fully expose the tumor.
The more extensive procedure means added risk and discomfort for patients, and up to a week-long recovery in the hospital compared to the transphenoidal approach that allows patients to leave the hospital in a day or two. Using MRE, hard PMAs can be identified and the more extensive craniotomy can be planned before starting the surgery, which makes the more invasive procedure less taxing for both the surgeon and patient. Similarly, MRE showing a soft PMA gives surgeons confidence that the nasal entry and removal by suction will be successful-eliminating the likelihood that the surgeon may need to perform a second fully-invasive craniotomy.
In the study of PMA reported in the January 2016 issue of the journal Pituitary, the group performed pre-surgical MRE evaluation of the PMAs of 10 patients.The MRE measurements were compared to tumor classifications made by inspection of the tumor during surgery. The surgeons categorized six tumors as soft and four tumors as medium. No tumors were deemed to be hard. The comparison of the MRE results and reports of stiffness by the surgeons when the tumor was removed and inspected were in close agreement, which was confirmed by statistical analysis.
Future plans
Although brain MRE is not yet widely available, Huston explained that the surgeons at the Mayo Clinic are now routinely using MRE to plan the best procedure for the removal of PMAs as well as several other types of brain tumor. And, even though this study of the 10 PMA patients is a very small set, Huston believes that as Mayo surgeons continue to use MRE in planning, the technique will likely begin to be adopted by other surgical centers.
Huston explained that an important aspect of some of the other brain tumor types, which the surgeons are finding extremely useful, is the ability of MRE to identify tumor adhesion to the brain. Adhesion refers to whether the brain tumor and healthy brain tissue are connected by an extensive network of blood vessels and connective tissue. This is in comparison with a tumor that is in the brain but is isolated from healthy tissue.
When MRE is used to analyze this aspect of the tumor, it clearly identifies those that are non-adhered, showing a border around the tumor through which there are no vascular connections. Conversely, MRE of adhered tumors show no border between the tumor and healthy brain, indicating extensive vascular and soft tissue connections between brain and tumor. Mutual blood vessels make removal of adherent tumors much more difficult, with a much higher chance of damage to healthy tissue and potential loss of function for the patient.
Huston and his colleagues are continuing to apply MRE, often called “palpating by imaging” to diagnosis of other brain disorders. In addition to characterizing focal brain disorders such as tumors, the group is testing the potential for MRE to provide diagnostic information about diffuse brain disease, and are currently using MRE brain stiffness patterns to identify different types of neural disorders including dementia.
This research was funded by the National Institutes of Health through the National Institute of Biomedical Imaging and Bioengineering grant EB001981.
Magnetic resonance elastography detects tumoral consistency in pituitary macroadenomas. Hughes JD, Fattahi N, Van Gompel J, Arani A, Ehman R, Huston J 3rd. Pituitary. 2016 Jun;19(3):286-92
“I haven’t had a proper night’s sleep in 19 months,” Aleksa Diaz told Newsweek. “Even if I’m physically exhausted, I can’t fall asleep. I wake up more than ten times a night—fully conscious. I only get about two to four hours of broken sleep.”
The 30-year-old from Austin, Texas, has shared her experience on TikTok (@aleksaheals) earning 94,000 views. During the video, she points out that she has not “crashed” once and wonders how her body is continuing to function.
Diaz says that her insomnia began in January 2024 and is linked to a benign tumor in her pituitary gland—a small, hormone-producing gland at the base of the brain—known as a pituitary adenoma.
According to the American Brain Tumor Association (ABTA), about 13,770 pituitary tumors are diagnosed each year in the U.S., accounting for roughly 17 percent of all primary tumors in the central nervous system (CNS).
Symptoms of Pituitary Tumors
Pituitary tumors and cysts typically arise from two main causes: pressure on the gland and surrounding structures, or overproduction of hormones. The severity and type of symptoms depend on the tumor’s size and the specific hormones involved.
The ABTA notes that when the tumor presses on the pituitary gland or nearby structures, it can lead to:
Headaches
Visual loss
Hair loss
Diminished libido
Weight fluctuations
Skin changes
Fatigue or low energy
Symptoms Caused by Excess Hormone Production
Approximately 70 percent of pituitary tumors are “secreting,” meaning they release excess hormones. These include:
Growth hormone: Overproduction can cause localized excess growth (‘acromegaly’) in adults and gigantism in children.
Prolactin: Leads to menstrual changes and abnormal milk production.
Sex hormones: Can cause menstrual irregularities and sexual dysfunction.
Thyroid hormones: Can trigger hyperthyroidism, with symptoms such as weight loss, heart rhythm changes, anxiety, bowel changes, fatigue, thinning skin and sleep problems.
Adrenal hormones: Excess can lead to Cushing’s disease, characterized by a moon-shaped face, excess body hair, easy bruising, menstrual irregularities and high blood pressure.
A Long Road to Diagnosis
Diaz told Newsweek that she has experienced many of these symptoms, beginning with severe hair loss at just 18.
“I started to feel off and suddenly began losing hair,” she recalled. “I was shedding over 300 hairs a day—just brushing my hair or running my fingers through it.”
Initially, doctors diagnosed her with polycystic ovary syndrome (PCOS). “I didn’t have any other symptoms, but I just thought it must be what they said,” Diaz explained.
By the time she turned 22, the hair loss was severe and unrelenting.
“It wasn’t stopping,” she said. “I went to a dermatologist and had a brain MRI—then they found a 5mm tumor on my pituitary gland.”
Around the same time, Diaz began gaining weight that wouldn’t budge despite dieting and regular exercise.
“I developed depression and always had a puffy, inflamed face,” she said. “The hair loss was causing me a lot of self-esteem issues.”
Over the years, Diaz’s symptoms multiplied—dry skin, dry eyes, low libido, anxiety, twitching legs and hip pain after exercise. She estimates she has consulted around 40 doctors and spent 500–600 hours researching her condition.
In 2018, she was formally diagnosed with a pituitary adenoma and prescribed metformin to lower hormone levels. “They told me to wait and see,” she said. When her insomnia worsened, Diaz suspected the tumor was causing multiple hormone-related conditions, but doctors did not confirm it.
By January 2024, she noticed new symptoms: vaginal dryness, hip pain and worsening sleep. Tests revealed her estrogen was abnormally low for her age.
“I take medication for that now and progesterone too,” she said. After years of trying everything—dermatologists, supplements and expensive hair treatments—she finally saw some hair regrowth.
Still, Diaz’s diagnosis of hypopituitarism means her pituitary gland underproduces several critical hormones.
The ABTA notes that doctors often recommend monitoring small tumors, since they typically grow slowly and cause no symptoms. But Diaz, whose tumor is 5 mm, disagrees.
She said: “Doctors believe that because the tumor is under 1 cm it can’t possibly be causing enough symptoms to risk doing surgery. The main risk is developing another hormone deficiency post-op.
“However, surgeons who do this surgery say it’s routine and not super risky, so it’s confusing as a patient.
“Cases like mine of mild hypopituitarism are often ignored, leading to a slow progression of hormone deficiencies—the very thing that is a risk of surgery.”
When she was 29, Diaz started taking hormone replacement therapy (HRT)—a treatment that replaces female hormones, mainly estrogen and progesterone, which fall to low levels during menopause.
She told Newsweek: “Doctors don’t understand why I’m basically in menopause. We don’t know the risks of long-term HRT. The medications make me feel better, but it’s not safe as a long-term solution.”
Living with the Emotional Toll
Alongside her physical symptoms, Diaz has developed severe depression and feels “literally running on empty.”
“I feel like I have hope for the future only when I manage a decent night’s sleep,” she said. “I don’t want to see anyone or socialize. I haven’t gone out in six months. It’s affected my job—I was almost fired in March.
“I’ve become very forgetful, I miss meetings and tasks and I sometimes can’t remember what I did yesterday. It’s like I have severe ADHD, but it’s not.”
A Call for Change in Treatment
Now financially and emotionally exhausted, Diaz fears what will happen if she continues to be denied further testing or surgical treatment.
“I’m worried something will happen to me,” she said. “I’ve reached my limit financially. My physical and mental health are exhausted.”
Diaz believes her struggle is far from unique. “From the time you have symptoms to when you get a diagnosis it can take 10 years,” she said.
“A lot of women have expressed they don’t feel like they are being taken seriously—and that has been my experience. Being young is a disadvantage. I’m on six medications now to manage my hormones. I’ve lost weight and my hair is growing back, so doctors think I must be fine. But they don’t see what’s really going on.”
Do you have a tip on a health story that Newsweek should be covering? Do you have a question about pituitary tumors? Let us know via health@newsweek.com.
Older age was tied to a higher prevalence of 10 comorbidities among a group of 608 people with Cushing’s disease.
Younger age was associated with most hallmark features of Cushing’s disease.
The presentation of Cushing’s disease varies by age, with older adults having fewer hallmark features of the condition and more comorbidities, according to study findings published in The Journal of Clinical Endocrinology & Metabolism.
Researchers assessed data from 608 people diagnosed with Cushing’s disease and treated with a transsphenoidal tumor resection at 11 academic pituitary centers in the U.S. from 2003 to 2023 (82% women; 77.3% white). Patients were divided into 10-year age interval groups, with the youngest group consisting of those aged 10 to 19 years and the oldest containing adults aged 70 to 79 years. Researchers found Cushing’s disease presents differently as adults age, with older adults experiencing more comorbidities and complications, but fewer hallmark features such as weight gain, facial rounding and hirsutism.
“The diagnosis of Cushing’s disease remains challenging, particularly with age,” Won Kim, MD, associate clinical professor of neurosurgery and radiation oncology at the David Geffen School of Medicine at UCLA, told Healio. “The older a patient is, the more likely that he or she may have a slower-growing tumor with fewer classic manifestations of the disease.”
Kim and colleagues obtained data from the Registry of Adenomas of the Pituitary and Related Disorders. Hallmark features of Cushing’s disease were identified by consensus opinion.
The number of comorbidities increased with patient age (beta = 0.0466; P < .001), according to the researchers.
Older age was associated with several comorbidities for patients with Cushing’s disease, including hypertension (P < .001), diabetes (P < .001), hyperlipidemia (P < .001), cancer (P < .001), coronary artery disease (P < .001), chronic obstructive pulmonary disease (P = .044), cardiac arrhythmia (P = .023), hepatitis (P = .038), anxiety (P = .039) and osteopenia (P = .024). The most common comorbidity was hypertension, which was prevalent in 67.2% of participants.
In an analysis of presenting hallmark features of Cushing’s disease, younger age was positively associated with weight gain (P < .001), facial rounding (P < .001), abdominal striae (P < .001), hirsutism (P < .001), menstrual irregularities (P < .001) and acne (P < .001). Older age was positively tied to obstructive sleep apnea (P = .007). The most common hallmark feature of Cushing’s disease was weight gain, prevalent in 80.2% of patients.
“Our work highlights that we must lower our threshold for suspecting Cushing’s disease in patients without the classic physical manifestations as the age of the patient increases,” Kim said in an interview. “Subtle clues, such as increasingly difficult to control medical conditions such as hypertension and diabetes, may be the only things we see.”
Older age was associated with lower preoperative 24-hour urinary free cortisol levels (beta = –0.0256; P = 6.89 x 10⁻⁷), but higher postoperative nadir cortisol (beta = 0.0342; P = 1.03 x 10⁻⁴) and higher adrenocorticotropin (beta = 0.0204; P = 5.22 x 10⁻⁴).
In an assessment of tumor characteristics, older age was tied to having a higher Knosp grade tumor (beta = 0.011; P = .00435), greater tumor volume (beta = 0.0261; P = .0233) and higher maximum tumor dimension (beta = 0.009; P = 3.82 x 10⁻⁴). Older age was inversely associated with Ki-67 index, which is a measure of tumor’s proliferation (beta = –0.0459; P = 1.39 x 10⁻⁴).
Age was not associated with a patient’s number of surgical complications. Older age was linked to a greater prevalence of deep vein thrombosis or venous thromboembolism (beta = 0.07; P = .014). Younger age was tied to a higher prevalence of postoperative arginine vasopressin (beta = –0.02; P = .048).
Kim said the study’s findings should encourage health care professionals to adjust their methods for screening for Cushing’s disease in older adults.
“Improving our diagnostic sensitivity through our standardized assessments for the disease should account for these new findings,” Kim told Healio.
Little is known about presenting clinical characteristics, tumor biology, and surgical morbidity of Cushing disease (CD) with aging.
Objective
Using a large multi-institutional data set, we assessed diagnostic and prognostic significance of age in CD through differences in presentation, laboratory results, tumor characteristics, and postoperative outcomes.
Methods
Data from the Registry of Adenomas of the Pituitary and Related Disorders (RAPID) were reviewed for patients with CD treated with transsphenoidal tumor resection at 11 centers between 2003 and 2023. Outcomes assessed included comorbidities, presenting features, preoperative endocrine evaluations, perioperative characteristics, postoperative endocrine laboratory values, and complications.
Results
Of the 608 patients evaluated, 496 (81.6%) were female; median age at surgery was 44 years (range, 10-78 years). Increasing age was associated with increasing comorbidities, frailty, rates of postoperative thromboembolic disease, Knosp grade, tumor size, and postoperative cortisol and adrenocorticotropin nadirs. Conversely, increasing age was associated with decreased hallmark CD features, preoperative 24-hour urinary free cortisol, Ki-67 indices, and arginine vasopressin deficiency. Younger patients presented more frequently with weight gain, facial rounding/plethora, abdominal striae, hirsutism, menstrual irregularities, dorsocervical fat pad, and acne. Obstructive sleep apnea and infections were more common with increasing age.
Conclusion
There are age-dependent differences in clinical presentation, tumor behavior, and postoperative outcomes in patients with CD. Compared to younger patients, older patients present with a less classic phenotype characterized by fewer hallmark features, more medical comorbidities, and larger tumors. Notably, age-related differences suggest a more indolent tumor behavior in older patients, potentially contributing to delayed diagnosis and increased perioperative risk. These findings underscore the need for tailored diagnostic and therapeutic approaches across age groups, with a focus on managing long-term comorbidities and optimizing surgical outcomes.
18Fluorine-Fluoro-deoxy-glucose (18F-FDG) positron emission tomography (PET) is widely used for diagnosing various malignant tumors and evaluating metabolic activities. Although the usefulness of 18F-FDG PET has been reported in several endocrine diseases, studies on pituitary disease are extremely limited. To evaluate whether dexamethasone (DEX) suppression can improve 18F-FDG PET for the localization of adrenocorticotropic hormone-secreting adenomas in the pituitary gland in Cushing’s disease (CD).
Methods
We included 22 patients with CD who underwent PET imaging before and after DEX administration. We compared the success rates of PET before and after DEX suppression, magnetic resonance imaging (MRI), and bilateral inferior petrosal sinus sampling (BIPSS). We determined the final locations of adenomas based on intraoperative multiple-staged resection and tumor tissue identification using frozen sections. Standardized uptake value (SUV) were analyzed to confirm the change of intensity of adenomas on PET.
Results
Twenty-two patients were included (age at diagnosis: 37 [13–56] years), and most were women (90.91%). Pituitary adenomas compared to normal pituitaries showed increased maximum SUV after DEX suppression but without statistical significance (1.13 versus. 1.21, z=-0.765, P = 0.444). After DEX suppression, the mean and maximum SUV of adenomas showed a positive correlation with nadir cortisol levels in high-dose DEX suppression test (Rho = 0.554, P = 0.007 and Rho = 0.503, P = 0.017, respectively). In reference sites, mean SUV of cerebellum was significantly decreased (7.65 vs. 6.40, P = 0.006*), but those of the thalamus and gray matter was increased after DEX suppression (thalamus, 8.70 vs. 11.20, P = 0.010*; gray matter, 6.25 vs. 7.95, P = 0.010*).
Conclusion
DEX suppression did not improve 18F-FDG PET/CT localization in patients with CD.
Introduction
Cushing’s disease (CD) is a rare endocrine disease that results from chronic exposure to high cortisol levels because of adrenocorticotropic hormone (ACTH)-secreting pituitary tumors and is associated with increased morbidity and mortality. It represents approximately 80% of all cases of endogenous hypercortisolism [1,2,3]. Accurate localization of primary lesions in CD leads to improved remission rates and reduced adverse events following surgery [4, 5]. A biochemical remission rate of 90–100% has been reported when tumors are localized before surgery, but it can decrease to 50–60% when surgery is performed when the location of the tumor is unknown in patients with CD [6,7,8].
Currently, magnetic resonance imaging (MRI) is the gold standard for detecting pituitary adenomas. Nevertheless, modern MRI modalities, including dynamic or volumetric sequences, can reliably detect corticotrophic adenomas in 50–90% cases of CD [9,10,11,12]. This indicates that complementary imaging strategies are required to improve the localization of primary lesions in CD.
One of the most characteristic features of corticotrophic adenomas is a compromised response to negative glucocorticoid feedback, which defines glucocorticoid resistance [13]. ACTH activates the adrenal glands to synthesize and secrete cortisol, which in turn negatively modulates the release of ACTH from the pituitary gland and corticotrophin-releasing hormone (CRH) and vasopressin from the hypothalamus [1]. In CD, a corticotrophic tumor is only partially sensitive to the inhibitory feedback exerted by cortisol, which in turn is not regulating its own production and secretion of ACTH, resulting in both excessive ACTH and cortisol levels. Glucocorticoid resistance is caused by multiple factors including glucocorticoid receptor availability, splice variant expression and affinity, and imbalanced glucocorticoid receptor signaling [14, 15].
Radioactive 18 F-fluorodeoxyglucose positron emission tomography/computed tomography (18F-FDG PET/CT) often demonstrates increased fluorodeoxyglucose (FDG) uptake in nonfunctioning and hormone-secreting pituitary adenomas [16,17,18]. In large observational studies of whole-body 18F-FDG positron emission tomography (PET) scans, incidental sellar 18F-FDG uptake was found in < 1% of cases, and this sign is highly specific for pituitary adenomas [19,20,21]. 18F-FDG PET imaging can detect up to 40% of corticotropinomas, some as small as 3 mm, and the rate of PET detection of corticotropinomas can be increased by CRH stimulation [9, 22].
Here, we evaluated whether DEX suppression could improve the localization of ACTH-secreting adenomas using 18F-FDG PET/CT in patients with CD. The rationale for this is as follows. FDG uptake of corticotrophic adenomas is less suppressed than that of normal pituitary glands after DEX suppression due to glucocorticosteroid resistance.
Materials and methods
Study design and population
In this retrospective cohort study, we enrolled all patients with CD who underwent two rounds of 18F-FDG-PET/CT before and after 8-mg DEX suppression and pituitary MRI before surgery. Total 22 patients were included in this study, of which thirteen had bilateral inferior petrosal sinus sampling (BIPSS) results. All patients were diagnosed with CD by staff of the Department of Endocrinology and/or Neurosurgery at Severance Hospital between 2014 and 2015. The diagnosis of CD was confirmed based on biochemical test results, including the cortisol, 24-hour urine free cortisol (24 h UFC), and serum ACTH levels, overnight dexamethasone suppression test (ON DST) results, and high-dose dexamethasone suppression test (HD DST) results.
Immediate remission was defined as hypocortisolism (serum cortisol level < 1.8 µg/dL) within the first 7 days after surgery. Delayed remission was defined as the achievement of hypocortisolism within 6 months, although immediate remission was not confirmed. If patients showed elevated postoperative cortisol levels and needed additional treatment within 6 months after surgery, we defined them as having persistent disease [23,24,25].
A serum cortisol concentration > 1.8 µg/dL for 8 h in the morning after 1 mg of DEX was given at midnight was considered to be a positive result in the ON DST [26]. Suppression of the serum cortisol level by > 50% for 6 h after 2 mg of DEX was administered for 2 days was defined as the suppression on the HD DST [26]. The final diagnosis was confirmed using surgical pathology and clinical follow-up.
Endocrinological evaluation
All laboratory analyses were performed at the Department of Laboratory Medicine, Severance Hospital. Preoperative cortisol and 24 h UFC were measured by chemiluminescence immunoassay using an automated UniCel DXC880i Synchron analyzer (Beckman Coulter, Pasadena, CA, USA; coefficient of variation [CV] ± 15 nmol/L at < 100 nmol/L and ± 15% at > 100 nmol/L). Preoperative ACTH levels were analyzed by electrochemiluminescence immunoassay using the Roche Cobas 6000 analyzer (Roche Diagnostics GmbH, Mannheim, Germany; CV ± 2.0 pmol/L at < 20 pmol/L and ± 10% at > 20 pmol/L).
The serum cortisol concentration at 8:00 am the following day after 1 mg of DEX was administered at midnight was considered positive on the ON DST. We determined the result as “suppression” by the cortisol level of < 1.8 µg/dL. A serum cortisol level suppressed by > 50% of the original level after 6 hourly administrations of 2 mg of DEX for 48 h was defined as suppression on the HD DST [27].
18F-FDG PET/CT evaluation
PET/CT was performed using a GEADVANCE PET scanner (GE, Milwaukee, WI, USA) after the intravenous injection of 7–9 mCi of 18F-FDG. All patients fasted for at least 6 h before the test. Emission scanning was continued for 15 min (4.25-mm axial spatial resolution, 4.8-mm transaxial spatial resolution). Transmission scans were performed for 8 min using triple Ge-68 rod sources to correct attenuation. Gathered data were reconstructed in a 128 × 128 × 35 matrix with a pixel size of 1.95 × 1.95 × 4.25 mm by means of a filtered back-projection algorithm employing a transaxial 8.5-mm Hanning filter and 8.5-mm axial ramp filter. Two specialists independently interpreted the encoded baseline PET images, and after a two-week period, they interpreted the encoded post DEX suppression PET images. Each specialist was blinded to MRI imaging, clinical characteristics, and surgical outcomes of these subjects. Each was tasked with determining whether the PET image indicated a “negative” or “positive” result for pituitary adenoma and its location on a high-resolution computer screen.
The scan after DEX suppression was performed 24 h after the oral administration of 8 mg of DEX using the same procedures as for the baseline PET/CT scan.
18F-FDG uptake analysis
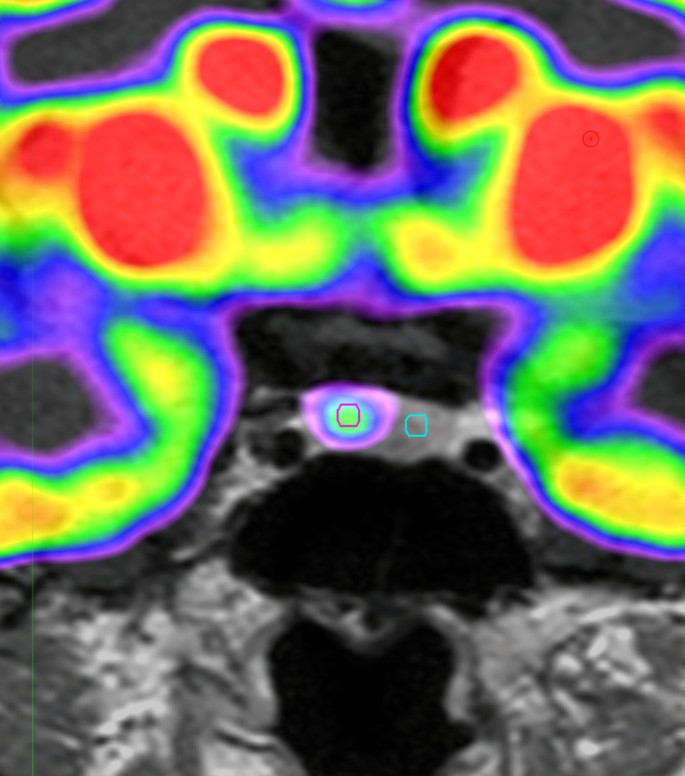
The Region of interest (ROI) was drawn using MIM software (version 6.5, Software INc., Cleveland, OH, USA) (Fig. 1). PET images were reviewed by experienced by an experienced specialist. The pituitary gland was identified and a circular ROI was drawn. A fixed ROI with a 3-mm diameter was used for all patients. The ROI was placed on the lesion with the highest FDG uptake. If there was no significantly increased FDG uptake, the same sized circular ROI was drawn on the suspected adenoma location. For the normal pituitary gland, the same sized 3 mm ROI was used.
Fig. 1
Images of ROI for pituitary adenoma on18F-FDG PET scan
Example of ROI definition in pituitary adenomas of 18F-FDG PET scan of the patients with CD. We draw the fixed circular ROI with a 3-mm diameter for pituitary adenomas (red circle) and normal pituitary gland (green circle)
The mean standardized uptake value (SUVmean) and maximum SUV (SUVmax) for pituitary adenomas and normal pituitary glands were automatically measured using MIM, version 6.5 (Software Inc., Cleveland, OH, USA). The standardized uptake value (SUV) of the volume of interest was calculated as follows: (decoy-corrected activity (kBq) / volume (mL)) / (injected dose (kBq) / body weight (g)).
SUVmean and SUVmax of pituitary adenomas were divided into the SUVmean of normal pituitary glands for adjustment. We used the ratio of SUVmax to SUVmean to analyze the homogeneity of the pituitary adenomas.
MRI evaluation
All patients underwent pituitary MRI with a 3.0-Tesla scanner (Achieva, Philips Medical Systems, Best, the Netherlands). Imaging protocols included T1-weighted imaging, T2-weighted imaging, and delayed gadolinium-enhanced T1-weighted imaging. The extent, location, and sizes of the pituitary tumors were reviewed based on official records determined by radiologists.
Pituitary tumors were classified based on radiological findings using MRI of the sellar and parasellar regions. Type I refers to tumors < 1 cm in diameter limited to the sella. Type II tumors extend into the suprasellar space, < 1 cm from the diaphragm. Type III includes tumors extending into the suprasellar space > 1 cm from the diaphragm or sphenoid sinus and encroaching on the internal carotid arteries. Lastly, type IV refers to adenomas with obvious invasion into the cavernous sinus, as shown on MRI, and into the medial dural wall of the cavernous sinus, as confirmed during surgery.
BIPSS
Before surgery, BIPSS was performed to confirm the cause of CD and lateralize the tumors. A catheter was placed in patients using a unilateral femoral venous approach and 3 cc of blood was collected from the peripheral (P) and both inferior petrosal sinuses (IPS) [28]. CRH at a dose of 1 µg/kg was administered, and peripheral and petrosal samples were drawn after 5 and 10 min, respectively. The catheters and sheath were removed, and the groin was compressed under pressure until venous hemostasis was achieved.
The IPS:P prolactin ratio was calculated at each time point to confirm the accuracy of the inferior petrosal venous sampling. A value of ≥1.8 was considered successful IPS catheterization. The prolactin-normalized ACTH ratio was calculated by dividing the dominant ACTH IPS:P ratio by the concurrent and ipsilateral IPS:P prolactin ratio. A value of ≥1.3 was considered diagnostic of CD. An intersinus ACTH ratio of ≥1.4 either at baseline or after stimulation was used for lateralization of the pituitary adenoma [29].
Location of the adenoma
The final assignment of the true location of the pituitary adenoma was based on intraoperative multiple stage resection and tumor tissue identification using frozen sections. Surgically identified adenomas were histologically evaluated and stained for ACTH immunoreactivity. In cases of multiple specimens obtained during the procedure, the true location of the adenoma was assigned based on the original site of the specimen containing the adenoma [30].
Statistical analysis
Data are presented as medians (ranges) or numbers (percentages). The baseline characteristics of the patients were compared using Kruskal–Wallis’ test with Dunn’s procedure for nonparametric continuous variables. Categorical variables were compared using Fisher’s exact test. Spearman’s correlation coefficients were used to determine the correlation between FDG uptake and hormone levels. Wilcoxon’s signed-rank test was used to identify changes in the SUV after DEX administration.
The interobserver agreement for image analysis was assessed using κ statistics. κ values were categorized as follows: κ < 0.20 indicated poor agreement, κ of 0.21–0.40 indicated fair agreement, κ of 0.41–0.60 indicated moderate agreement, κ of 0.61–0.80 indicated good agreement, and κ > 0.81 indicated excellent agreement [31].
Statistical significance was set at a two-sided P < 0.05. All statistical analyses were performed using SPSS software (IBM Corp., Armonk, NY, USA).
Results
Patient characteristics
We enrolled all patients with CD who underwent two rounds of the 18F-FDG PET/CT with or without DEX suppression and sellar MRI before transsphenoidal adenectomy (TSA). Twenty-two patients were included (age at diagnosis: 37 [13–56] years), and most were women (90.91%). Patients’ baseline characteristics are shown in Table 1. There were 16 microadenomas and 6 macroadenomas. Immediate remission was achieved in 81.82% of the patients and delayed remission in 13.64%; one patient showed persistent disease after TSA. The median preoperative 24 h UFC, serum ACTH, and cortisol levels were 443.35 (93.00–4452.00) µg/day, 36.16 (6.00–92.00) pg/mL, and 18.55 (6.00–40.00) µg/dL. The size of pituitary adenomas on MRI was 7.85 (2.00–28.00) mm. The Ki-67 index of 47.06% of adenomas ranged from 1 to 2, that of 35.29% was below 1, and that of 17.65% was 2 or higher. Overall, 75.00% of the adenomas were classified as Knosp grade 0, 5.00% as grade 1, 5.00% as grade 3b, and 15.00% as grade 4. In total, 77.27% (17/22) of patients had an ACTH-staining adenoma. Only one patient showed unsuppressed cortisol levels on the HD DST.
Table 1 Patients’ imaging and clinical characteristics
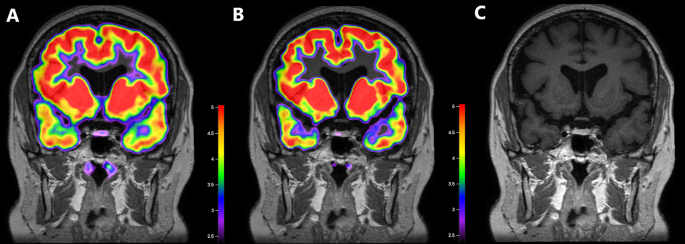
Two patients showed negative MRI results, and one of them showed FDG uptakes on both 18F-FDG PET scans at baseline and after DEX suppression. A 26-year-old man visited our hospital complaining of weight gain and was diagnosed with ACTH-dependent CD. Cortisol secretion was suppressed on the HD DST; however, sellar MRI did not reveal any suspicious lesions. BIPSS revealed a central tumor (central/peripheral ACTH level of 36.25 after CRH stimulation) lateralized to the right side of the pituitary gland. The patient underwent 18F-FDG-PET/CT before and after DEX suppression to identify the primary lesions. Baseline PET/CT showed diffused FDG uptake with an SUVmax of 1.03 at the pituitary fossa but failed to localize the tumor. After DEX treatment, focal FDG uptake with an SUVmax of 1.06 remained at the right side of the pituitary fossa, which resulted in the successful localization of the corticotrophic adenoma. The MRI and PET/CT images of this case are presented in Fig. 2A–C. During TSA, the surgeon identified solid tumor-like tissues on the right side of the pituitary gland and successfully removed them. Results of pathology and ACTH immunohistochemistry were negative, but the patient achieved immediate biochemical remission and CD-related symptoms were relieved after surgery. We followed the patient for 98 months after the surgery and confirmed that he had lived without recurrence.
Fig. 2
Images of a corticotroph with negative MRI but positive18 F-FDG PET/CT after DEX suppression
An MRI-negative adenoma was detected on 18F-FDG PET/CT at baseline and after DEX suppression. In this patient, the pituitary adenoma was visible on PET scans at baseline (B) and after DEX suppression (C) at the same location, as confirmed by the surgeon
A. Co-registered baseline 18F-FDG PET/CT and MRI images. Diffuse 18F-FDG uptake is detected in the pituitary fossa with an SUVmean of 0.86 and SUVmax of 1.03, but there was failure to localize the adenoma on baseline 18F-FDG PET/CT.
B. Co-registered 18F-FDG PET/CT and MRI images after DEX suppression. 18F-FDG uptake is not suppressed in the right side of the pituitary gland with an SUVmean of 1.03 and SUVmax of 1.06. 18F-FDG PET/CT after DEX suppression was successful in localizing the right-sided corticotrophic adenoma
C. MRI image. There is no suspicious lesion in the pituitary gland
ACTH, adrenocorticotropic hormone; MRI, magnetic resonance imaging; 18F-FDG, 18 F-fluorodeoxyglucose; PET/CT, positron emission tomography/computed tomography; DEX, dexamethasone; SUVmean, mean standardized uptake value; SUVmax, maximum standardized uptake value
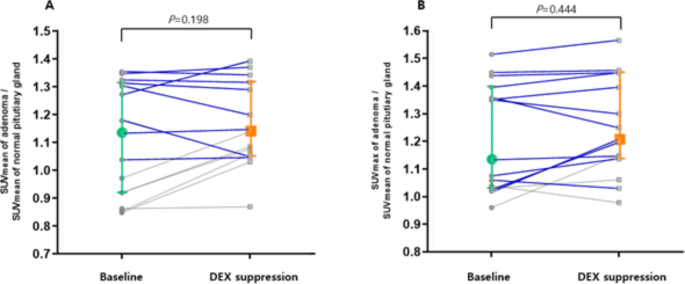
We included 18 pituitary adenomas that were successfully localized using PET/CT after DEX suppression, and analyzed the change of SUV for 15 adenomas, excluding outliers with SUV over 2.00. The results are presented in Fig. 3A and B. The SUVmean of adenomas did not changed after DEX suppression compared to normal pituitary glands (SUVmean of adenoma/SUVmean of normal pituitary glands: 1.13 [0.85–1.35] vs. 1.14 [0.87–1.39], z=-1.288, P = 0.198). DEX suppression increased SUVmax of adenomas compared to normal pituitary glands but without statistical significance (SUVmax of adenoma/SUVmean of normal pituitary glands: 1.13 [0.96–1.52] vs. 1.21 [0.97–1.56], z=-0.765, P = 0.444).
Fig. 3
Changes in the SUVs of corticotrophs between18F-FDG PET/CT before and after DEX suppression
The SUVmean (A) and SUVmax (B) of corticotrophic adenomas are shown in this pairwise analysis. The SUVmean did not changed after DEX suppression from (z=-1.288, P = 0.198). The SUVmax of the corticotrophic adenoma increased from 1.13 to 1.21 (z=-0.765, P = 0.444). In this analysis, the SUVmean and SUVmax of pituitary adenomas were adjusted using the SUVmean of the normal pituitary gland. Colored plots and bars presented median and interquartile range in this figure. We presented the tumors with size larger than 5 mm and SUV adjusted by normal pituitary>1 for blue line
SUVmean, mean standardized uptake value; SUVmax, maximum standardized uptake value; DEX, dexamethasone; 18F-FDG, 18 F-fluorodeoxyglucose; PET/CT, positron emission tomography/computed tomography
In Fig. 3, the blue line indicates change in SUV of adenomas larger than 5 mm with higher FDG uptake than the surrounding pituitary parenchyma. For these adenomas, DEX suppression did not change the SUV (SUVmean of adenoma/SUVmean of normal pituitary glands: 1.31 [1.04–2.52] vs. 1.33 [1.05–2.38], z=-0.784, P = 0.433; SUVmax of adenoma/SUVmean of normal pituitary glands: 1.36 [1.02–2.61] vs. 1.40 [1.03–2.65], z=-1.022, P = 0.307).
The value of SUV increased in 73.33% adenomas, while the SUVmax increased in 66.67% compared with normal pituitary glands after DEX treatment.
Correlation between the hormone level and 18F-FDG uptake
Table 2 shows the results of the Spearman correlation analysis of the SUV with preoperative cortisol, ACTH, and nadir cortisol levels on the HD DST. On the baseline 18F-FDG PET scan, the SUVmax of the adenomas did not show any correlation with the levels of three hormones. The SUVmean of adenomas showed a positive correlation with nadir cortisol levels on the HD DST (P = 0.014) and preoperative ACTH levels, with marginal significance (P = 0.062). After DEX suppression, the SUVmax and SUVmean of adenomas had a positive correlation with moderate degrees of nadir cortisol on the HD DST (SUVmax: Spearman Rho = 503, P = 0.017; SUVmean: Spearman Rho = 0.554, P = 0.007).
Table 2 Correlation between FDG uptakes and hormone levels
FDG uptake of reference sites after DEX suppression
We evaluated the FDG uptake for five types of reference areas (normal pituitary gland, cerebellum, thalamus, white matter, and gray matter) (Table 3). Normal pituitary gland and white matter did not affect the unadjusted SUVmean by DEX suppression (all P >0.05). DEX significantly increased SUVmean of the thalamus and gray matter (thalamus, 8.70 [4.40–22.70] vs. 11.20 [6.40–17.5], P = 0.010*; gray matter, 6.25 [2.50–15.00] vs. 7.95 [5.00–11.90], P = 0.010*). However, SUVmean of the cerebellum significantly decreased after DEX administration (7.65 [4.50–10.80] vs. 6.40 [2.60–12.00], P = 0.006*).
Table 3 The change of FDG uptake for reference sites after DEX suppression in the patients with CD
Qualitative analysis by diagnostic modalities for CD
The qualitative results of localizing pituitary adenomas in CD patients are shown in Table 4 and Fig. 4. Only 13 patients had BIPSS results. The success rates were 90.91% for MRI and 84.62% for BIPSS.
Table 4 Qualitative analysis by diagnostic modalities for CD
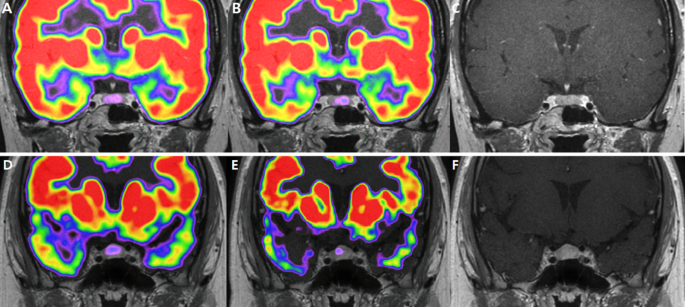
Images for corticotroph adenomas that appear different for localization in18F-FDG PET/CT.
9 mm sized adenoma in the left lateral wing of pituitary gland. It was found in the left lateral wing of the pituitary gland, showing an 18F-FDG uptake in the pituitary fossa with an SUVmean of 1.04 and SUVmax of 1.07. However, after DEX suppression, the left side of the pituitary gland did not exhibit suppressed 18F-FDG uptake, with SUVmean 1.05 SUVmax 1.14
(A). Co-registered baseline 18F-FDG PET/CT and MRI images. (B). Co-registered 18F-FDG PET/CT and MRI images after DEX suppression. (C). MRI image
2 mm pituitary adenoma was detected at the left lateral wing, showing diffuse FDG uptake in the pituitary fossa with an SUVmean of 0.86 and SUVmax of 1.04. After DEX suppression, focal FDG uptake was observed, with SUVmean 0.87 and SUVmax 0.98. (D). Co-registered baseline 18F-FDG PET/CT and MRI images. (E). Co-registered 18F-FDG PET/CT and MRI images after DEX suppression. (F). MRI image
In baseline PET scans, the specialists agreed that pituitary adenomas were visible in 17 scans and not visible in 5 scans. They reached a consensus that the tumor was evident in two scans, but there was a discrepancy in their assessments of its location.
After DEX suppression, pituitary adenomas showed positive results in 16 scans and negative results in 5 scans. Specialists disagreed on the presence of pituitary adenomas in one case only.
Interobserver agreement for localizing adenomas was 0.872 (95%CI: 0.711, 1.033) for baseline PET/CT and 0.938 (95%CI: 0.762, 1.056) for post dexamethasone suppression PET/CT, confirming excellent interobserver agreements, and the result was judged reliable. Among the instances where both opinions agreed, there were no lesions that showed differences in visibility between scans before and after DEX administration. This meant that lesions were either consistently visible or invisible in both scenarios.
Discussion
We found that DEX suppression did not improve localization of ACTH-secreting pituitary adenomas using 18F-FDG PET/CT. Further, it did not significantly affect FDG uptakes in adrenocorticotrophic adenomas or normal pituitaries in patients with CD. The decision to administer 8 mg dexamethasone was based on the standard high-dose DST, which is internationally recommended for differentiating between ectopic ACTH secretion and CD [26]. This test involved comparing serum cortisol levels at 8 am before and after a single dose of 8 mg dexamethasone administered at 11 pm. Suppression of the serum cortisol level to less than 50% of the baseline value indicated a diagnosis of CD [32, 33]. Previous studies have reported that the 8-mg DST has a sensitivity of 90%, specificity of 100%, accuracy of 96.8%, positive predictive value of 100%, and negative predictive value of 95.5% [34, 35]. Our use of 8 mg dexamethasone was based on the theory that orally administering dexamethasone at this dose can effectively suppress cortisol levels in ACTH-secreting pituitary tumors.
We expected that FDG uptake by corticotrophic adenomas would not decrease after DEX administration in patients with CD, and this change may improve the ability to discriminate the tumor location from surrounding tissues on 18F-FDG PET. The SUVmax of pituitary adenomas adjusted for the normal pituitary gland increased from 1.13 to 1.21. However, this change was not statistically significant, and the success rate of localizing corticotrophic adenomas using 18F-FDG PET was not significantly improved after DEX suppression. If the FDG uptake of adenomas changed lesser compared to that of surrounding normal tissues after DEX suppression, the tumor could be more easily visualized because of the difference.
In addition, we attempted to evaluate FDG uptakes in other brain areas (cerebellum, thalamus, white matter, and gray matter) according to DEX administration in CD patients. SUVmean of the cerebellum decreased significantly, but that of the thalamus and gray matter increased after DEX suppression. DEX did not change FDG uptake in pituitary adenoma, normal pituitary, or white matter. In a previous study analyzing FDG PET in CD patients, researchers observed varying correlations between FDG uptake and blood cortisol concentration across different brain regions [35, 36]. Nevertheless, the examination did not include an analysis of FDG uptake in the pituitary gland. Additionally, no previous studies have explored the effects of high-dose dexamethasone suppression on brain glucose metabolism in individuals with CD. Further studies are needed to explain the change in FDG uptake after DEX administration in patients with CD.
18F-FDG PET/CT provides information regarding glucose metabolism in the brain in vivo and has been widely used to evaluate brain metabolism in clinical and research settings [37]. Here, the nadir cortisol level on the HD DST correlated with the SUVmean and SUVmax of pituitary adenomas on PET scans after DEX suppression. Cortisol secretion activity is thought to be associated with metabolic activity, and DEX administration altered this. Cortisol levels and FDG uptake in other regions of the brain are correlated in patients with CD, but the correlation between cortisol and FDG uptake in the pituitary glands and/or corticotrophic adenomas themselves has not been discussed [35, 36]. In our study, cortisol levels did not show a correlation with FDG uptake of corticotrophic adenomas, but after DEX suppression FDG uptake showed a correlation with the nadir cortisol level on the HD DST. This indicated that tumors in which cortisol secretion was less suppressed by on the HD DST showed higher FDG uptake than tumors with lower cortisol levels on the HD DST.
Although many studies have analyzed FDG uptake of brain tumors, reference sites defined in each study varied without a uniform standard. Gray matter, white matter, or adjacent tumor tissue was defined as a reference site [38,39,40]. We measured SUVmean of normal pituitary tissues, gray matter, white matter, thalamus, and cerebellum as possible references. We defined the SUVmean of normal pituitary tissues as a reference because the localization of adenomas requires an apparent difference between the adenoma and surrounding tissues.
Use of fixed ROI to measure FDG uptake caused partial volume effect in this study. However, lesions smaller than 5 mm with intense FDG uptake may still show increased FDG uptake, especially in tumors, albeit with lower SUV values compared with the actual values [41]. This study was performed because pituitary adenomas smaller than 5 mm with higher FDG uptake than the surrounding pituitary parenchyma have been observed in routine clinical practice. To control for the partial volume effect, the analysis was performed again for tumors which were larger than 5 mm and had higher FDG uptake than the surrounding pituitary parenchyma, and the results remained unchanged.
PET/CT has been explored as an alternative to or combined with MRI for the localization of corticotrophic adenomas. 18F-FDG PET/CT has a limited role in CD diagnosis, but CRH stimulation can increase its success rate [22, 42]. This study is important for increasing the effectiveness of PET using DEX. In addition, data on DEX effect on brain metabolism in patients with CD will be important for future studies.
Conclusions
DEX suppression did not improve the localization of 18F-FDG PET/CT in patients with CD. This is considered to have sufficient significance in an effort to increase the diagnostic value of 18F-FDG PET/CT.
Data Availability
All datasets generated and/or analyzed during the current study are not publicly available but are available from the corresponding author upon reasonable request.
Bochicchio D, Losa M, Buchfelder M. Factors influencing the immediate and late outcome of Cushing’s disease treated by transsphenoidal surgery: a retrospective study by the european Cushing’s Disease Survey Group. J Clin Endocrinol Metab. 1995;80:3114–20.
Prevedello DM, Pouratian N, Sherman J, Jane JA, Vance ML, Lopes MB, et al. Management of Cushing’s disease: outcome in patients with microadenoma detected on pituitary magnetic resonance imaging: clinical article. J Neurosurg. 2008;109:751–9.
Rees DA, Hanna FWF, Davies JS, Mills RG, Vafidis J, Scanlon MF. Long-term follow-up results of transsphenoidal surgery for Cushing’s disease in a single centre using strict criteria for remission. Clin Endocrinol (Oxf). 2002;56:541–51.
Semple PL, Vance ML, Findling J, Laws ER. Transsphenoidal surgery for Cushing’s disease: outcome in patients with a normal magnetic resonance imaging scan. Neurosurgery. 2000;46:553–8. discussion 558–559.
Chowdhury IN, Sinaii N, Oldfield EH, Patronas N, Nieman LK. A change in pituitary magnetic resonance imaging protocol detects ACTH-secreting tumours in patients with previously negative results. Clin Endocrinol (Oxf). 2010;72:502–6.
Fukuoka H, Shichi H, Yamamoto M, Takahashi Y. The Mechanisms Underlying Autonomous adrenocorticotropic hormone secretion in Cushing’s Disease. Int J Mol Sci. 2020;21:9132.
van Rossum EFC, Lamberts SWJ. Glucocorticoid resistance syndrome: a diagnostic and therapeutic approach. Best Pract Res Clin Endocrinol Metab. 2006;20:611–26.
Alzahrani AS, Farhat R, Al-Arifi A, Al-Kahtani N, Kanaan I, Abouzied M. The diagnostic value of fused positron emission tomography/computed tomography in the localization of adrenocorticotropin-secreting pituitary adenoma in Cushing’s disease. Pituitary. 2009;12:309–14.
Campeau RJ, David O, Dowling AM. Pituitary adenoma detected on FDG positron emission tomography in a patient with mucosa-associated lymphoid tissue lymphoma. Clin Nucl Med. 2003;28:296–8.
Jeong SY, Lee S-W, Lee HJ, Kang S, Seo J-H, Chun KA, et al. Incidental pituitary uptake on whole-body 18F-FDG PET/CT: a multicentre study. Eur J Nucl Med Mol Imaging. 2010;37:2334–43.
Valassi E, Biller BMK, Swearingen B, Pecori Giraldi F, Losa M, Mortini P, et al. Delayed remission after transsphenoidal surgery in patients with Cushing’s disease. J Clin Endocrinol Metab. 2010;95:601–10.
Dai C, Feng M, Sun B, Bao X, Yao Y, Deng K, et al. Surgical outcome of transsphenoidal surgery in Cushing’s disease: a case series of 1106 patients from a single center over 30 years. Endocrine. 2022;75:219–27.
Hinojosa-Amaya JM, Cuevas-Ramos D. The definition of remission and recurrence of Cushing’s disease. Best Pract Res Clin Endocrinol Metab. 2021;35:101485.
Fleseriu M, Auchus R, Bancos I, Ben-Shlomo A, Bertherat J, Biermasz NR, et al. Consensus on diagnosis and management of Cushing’s disease: a guideline update. Lancet Diabetes Endocrinol. 2021;9:847–75.
Nieman LK, Biller BMK, Findling JW, Newell-Price J, Savage MO, Stewart PM, et al. The diagnosis of Cushing’s syndrome: an endocrine Society Clinical Practice Guideline. J Clin Endocrinol Metab. 2008;93:1526–40.
Park JW, Park S, Kim JL, Lee HY, Shin JE, Hyun DH, et al. Bilateral inferior petrosal sinus sampling by unilateral femoral venous approach. Neurointervention. 2011;6:23–6.
Sharma ST, Raff H, Nieman LK. Prolactin as a marker of successful catheterization during IPSS in patients with ACTH-Dependent Cushing’s syndrome. J Clin Endocrinol Metab. 2011;96:3687–94.
Lim JS, Lee SK, Kim SH, Lee EJ, Kim SH. Intraoperative multiple-staged resection and tumor tissue identification using frozen sections provide the best result for the accurate localization and complete resection of tumors in Cushing’s disease. Endocrine. 2011;40:452–61.
Dichek HL, Nieman LK, Oldfield EH, Pass HI, Malley JD, Cutler GB. A comparison of the standard high dose dexamethasone suppression test and the overnight 8-mg dexamethasone suppression test for the differential diagnosis of adrenocorticotropin-dependent Cushing’s syndrome. J Clin Endocrinol Metab. 1994;78:418–22.
Aytug S, Laws ER, Vance ML. Assessment of the utility of the high-dose dexamethasone suppression test in confirming the diagnosis of cushing disease. Endocr Pract Off J Am Coll Endocrinol Am Assoc Clin Endocrinol. 2012;18:152–7.
Sriussadaporn S, Ploybutr S, Peerapatdit T, Plengvidhya N, Nitiyanant W, Vannasaeng S, et al. Nocturnal 8 mg dexamethasone suppression test: a practical and accurate test for identification of the cause of endogenous Cushing’s syndrome. Br J Clin Pract. 1996;50:9–13.
Liu S, Wang Y, Xu K, Ping F, Li F, Wang R, et al. Voxel-based comparison of brain glucose metabolism between patients with Cushing’s disease and healthy subjects. NeuroImage Clin. 2018;17:354–8.
Liu S, Wang Y, Xu K, Ping F, Wang R, Li F, et al. Brain glucose metabolism is associated with hormone level in Cushing’s disease: a voxel-based study using FDG-PET. NeuroImage Clin. 2016;12:415–9.
Sokoloff L, Reivich M, Kennedy C, Rosiers MHD, Patlak CS, Pettigrew KD, et al. The [14c]deoxyglucose method for the measurement of local cerebral glucose utilization: Theory, Procedure, and normal values in the conscious and anesthetized albino Rat1. J Neurochem. 1977;28:897–916.
Delbeke D, Meyerowitz C, Lapidus RL, Maciunas RJ, Jennings MT, Moots PL, et al. Optimal cutoff levels of F-18 fluorodeoxyglucose uptake in the differentiation of low-grade from high-grade brain tumors with PET. Radiology. 1995;195:47–52.
Meric K, Killeen RP, Abi-Ghanem AS, Soliman F, Novruzov F, Cakan E, et al. The use of 18F-FDG PET ratios in the differential diagnosis of common malignant brain tumors. Clin Imaging. 2015;39:970–4.
Xin C, Rui-xue C, Hui P, Tao Y, Hui-Juan Z, Fang L. Value of [18F] fluoro-2-deoxy-D-glucose positron emission tomography/computed tomography in diagnosis and localization of Cushing’s disease. Zhongguo Yi Xue Ke Xue Yuan Xue Bao. 2011;33:107–10.
We would like to thank Editage (www.editage.co.kr) for English language editing.
Funding
The study was supported by the “Team Science Award” of Yonsei University College of Medicine (6-2022-0150).
Author information
Authors and Affiliations
Endocrinology, Institute of Endocrine Research, Department of Internal Medicine, Yonsei University College of Medicine, Seoul, Republic of Korea
Kyungwon Kim, Cheol Ryong Ku & Eun Jig Lee
Department of Radiology, Severance Hospital, Yonsei University College of Medicine, Seoul, Republic of Korea
Dong Kyu Kim
Department of Neurosurgery, Severance Hospital, Yonsei University College of Medicine, Seoul, Republic of Korea
Ju Hyung Moon, Eui Hyun Kim & Sun Ho Kim
Contributions
Conception and design: EJL, CRK, KK. Acquisition of data: KK, DKK. Analysis and interpretation of data: KK. Drafting the article: KK. Administrative/technical/material support: JHM, EHK, SHK. Study supervision: EJL, CRK. Writing, review, and revision of the manuscript: KK, DKK, SHK, CRK. Final approval of the manuscript: CRK, EJL.
The data were collected under the conditions of regular clinical care with approval from the ethics committee of our hospital, and the requirement for written informed consent was waived owing to its retrospective design (institutional review board number: 2023-0110-001).
Consent for publication
Not applicable.
Competing interests
The authors declare no conflicts of interest that could be perceived as prejudicing the impartiality of this study.
Additional information
Publisher’s Note
Springer Nature remains neutral with regard to jurisdictional claims in published maps and institutional affiliations.
Electronic supplementary material
Additional file 1 of Dexamethasone suppression for 18F-FDG PET/CT to localize ACTH-secreting pituitary tumors
Additional file 1
Below is the link to the electronic supplementary material.
Open Access This article is licensed under a Creative Commons Attribution 4.0 International License, which permits use, sharing, adaptation, distribution and reproduction in any medium or format, as long as you give appropriate credit to the original author(s) and the source, provide a link to the Creative Commons licence, and indicate if changes were made. The images or other third party material in this article are included in the article’s Creative Commons licence, unless indicated otherwise in a credit line to the material. If material is not included in the article’s Creative Commons licence and your intended use is not permitted by statutory regulation or exceeds the permitted use, you will need to obtain permission directly from the copyright holder. To view a copy of this licence, visit http://creativecommons.org/licenses/by/4.0/. The Creative Commons Public Domain Dedication waiver (http://creativecommons.org/publicdomain/zero/1.0/) applies to the data made available in this article, unless otherwise stated in a credit line to the data.
Kim, K., Kim, D.K., Moon, J.H. et al. Dexamethasone suppression for 18F-FDG PET/CT to localize ACTH-secreting pituitary tumors. Cancer Imaging23, 85 (2023). https://doi.org/10.1186/s40644-023-00600-8