The Outcome of Abnormal Glucose Metabolism and Its Clinical Features in Patients With Cushing’s Disease After Curative Surgery

Abstract

Objective

To investigate the outcomes of abnormal glucose metabolism and its clinical characteristics in patients with Cushing’s disease (CD) who achieved biochemical remission after surgery.

Methods

Patients diagnosed with CD who achieved biochemical remission and underwent regular follow-up after surgery were enrolled. Pre- and postoperative clinical data were collected and analyzed.

Result

151CD patients were included, of whom 80 (53 %) had preoperative abnormal glucose metabolism, including 56 with diabetes mellitus (DM) and 24 with impaired glucose regulation (IGR). At one year after surgery, 57 patients exhibited improved glucose metabolism, accompanied by a significant reduction in the homeostasis model assessment of insulin resistance (HOMA-IR). Improvements were mainly observed at 3 and 6 months after surgery. At one-year after surgery, there were 20 patients with diabetes and 16 with IGR. Compared to those with NGT, these individuals exhibited a higher prevalence of hypertension, hyperlipidemia, fatty liver, and abnormal bone metabolism.

Conclusion

CD patients demonstrated a high incidence of abnormal glucose metabolism. Notably, approximately two-thirds demonstrated improved glucose metabolism one year after curative surgery, with the greatest improvements observed at 3- to 6-month postoperative follow-up.

Introduction

Cushing’s disease (CD) is characterized by excessive endogenous cortisol production caused by pituitary adrenocorticotropic hormone adenoma and is the main cause of Cushing’s syndrome (CS). Surgical resection of the tumor is the preferred treatment. Prolonged exposure to hypercortisolism increases the risk of metabolic abnormalities, including obesity, hypertension, glucose and lipid abnormalities, osteoporosis, etc. Additionally, it significantly elevates the risk of infection, thrombosis, and hypokalemia. Abnormal glucose metabolism is a common complication of CS, with an incidence ranging from 13.1 % to 47 %[1], and diabetes is an independent risk factor for mortality in CD patients[2].
Previous clinical studies have found that metabolic abnormalities such as diabetes, hypertension, and hyperlipidemia improve in CS patients who achieve biochemical remission after surgical treatment. However, the concept of improvement in glucose metabolism, the incidence of improvement, and its related factors are inconsistent in various reports. Previous studies primarily assessed the outcome of glucose metabolism based on plasma glucose results at a single fixed follow-up time after surgery. The lack of regular follow-up data makes it difficult to clearly understand the trend of postoperative plasma glucose changes, and there are no clinical data on when glucose metabolism begins to improve or change. Therefore, this study retrospectively analyzed the follow-up data of patients with Cushing’s disease in our hospital before and after surgery, and monitored the changes in glucose metabolism, to explore the characteristics and clinical features of such changes in patients with Cushing’s disease who achieved remission from CD following surgery..

Access through your organization

Check access to the full text by signing in through your organization.

Access through your organization

Section snippets

Subjects

This study enrolled hospitalized patients with Cushing’s disease at Huashan Hospital, Fudan University from January 2014 to February 2020. Inclusion criteria were as follows: (1) Age ≥ 18 years; (2) diagnosis of Cushing’s disease according to the 2021 Consensus on the Diagnosis and Management of Cushing’s Disease, confirmed by pathology[3]; (3) biochemical remission after transsphenoidal surgery; (4) complete preoperative data and regular follow-up visits (including visits at 1, 3, 6, and

Patients’ baseline characteristics

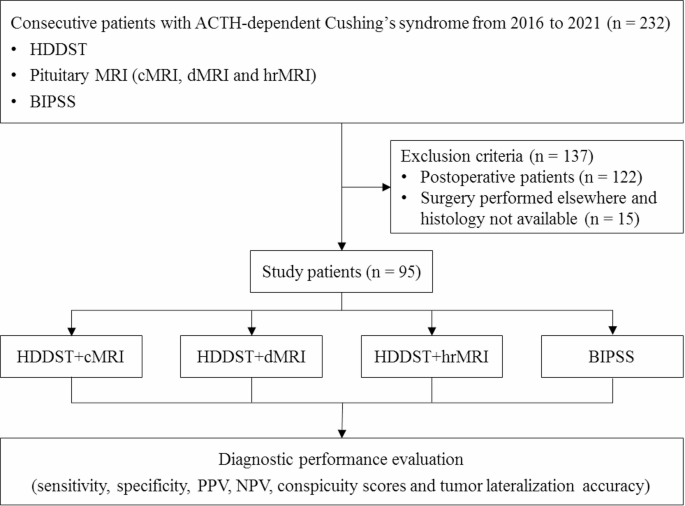
A total of 168 patients with CD were admitted to Huashan Hospital from 2014 to 2020 with pathological diagnosis and regular postoperative follow-up; however, 17 patients were excluded due to no biochemical remission after surgery or relapse during follow-up (Fig. 1). Ultimately, 151 patients (32 males and 119 females) were included in this study. The baseline characteristics of the included patients were shown in Table 1. There were 80 cases (53 %) complicated with abnormal glucose metabolism

Discussion

CD was a rare disease often associated with abnormal glucose metabolism. Based on medical history and OGTT screening, we found that over half (53 %) of CD patients exhibited abnormal glucose metabolism before surgery, with 37.1 % being diagnosed with diabetes. Previous studies have shown that the prevalence of diabetes in CS patients ranged from 13.1 % to 47 %, and most reports falling between 35 % and 45 %, which is consistent with our findings [1,12,13]. However, it should be noted that CD

Author contributions

Q.C. analyzed the data and wrote the manuscript. Q.C., Y.L., X.L., Q.S., W.S., and H.Z. collected the data. Y.L., Z.Z., M.H., S.Z., and H.Y. recruited patients. J.Z., Y.S., and S.Z. conducted the study design and revised the manuscript. All authors read and approved the final manuscript.

CRediT authorship contribution statement

Qiaoli Cui: Writing – review & editing, Writing – original draft, Methodology, Investigation, Formal analysis, Data curation, Conceptualization. Yujia Li: Writing – original draft, Investigation, Formal analysis, Data curation. Xiaoyu Liu: Investigation, Formal analysis, Data curation. Quanya Sun: Investigation, Data curation. Wanwan Sun: Investigation, Formal analysis, Data curation. Min He: Project administration, Investigation. Jie Zhang: Writing – review & editing, Supervision, Funding

Declaration of competing interest

The authors declare that they have no known competing financial interests or personal relationships that could have appeared to influence the work reported in this paper.

Acknowledgments

We are indebted to the patients who participated in this study and all the doctors who contributed to the diagnosis and treatment of these patients. This work was supported by grants from the Multidisciplinary Diagnosis and Treatment (MDT) demonstration project in research hospitals (Shanghai Medical College, Fudan University, NO: DGF501069/017), National Science and Technology Major Project (NO: 2023ZD0506800,2023ZD0506802), 2023 Ningbo International Cooperation Program (NO: 2023H024).

References (16)

  • R.N. Clayton et al.

    Mortality in patients with Cushing’s disease more than 10 years after remission: a multicentre, multinational, retrospective cohort study

    Lancet Diabetes Endocrinol

    (2016)
  • M. Fleseriu et al.

    Consensus on diagnosis and management of Cushing’s disease: a guideline update

    Lancet Diabetes Endocrinol

    (2021)
  • C. Scaroni et al.

    Glucose Metabolism Abnormalities in Cushing Syndrome: from Molecular Basis to Clinical Management

    Endocr Rev

    (2017)
  • C. Dai et al.

    Surgical outcome of transsphenoidal surgery in Cushing’s disease: a case series of 1106 patients from a single center over 30 years

    Endocrine

    (2022)
  • E. Valassi et al.

    Delayed remission after transsphenoidal surgery in patients with Cushing’s disease

    J Clin Endocrinol Metab

    (2010)
  • X. He et al.

    Glucocorticoid Withdrawal Syndrome following treatment of endogenous Cushing Syndrome

    (2022)
  • E.V. Varlamov et al.

    Perioperative Management of a Patient with Cushing Disease

    J Endocr Soc

    (2022)
  • Q. Cui et al.

    The recovery time of hypothalamic-pituitary-adrenal axis after curative surgery in Cushing’s disease and its related factor

    Endocrine

    (2023)
There are more references available in the full text version of this article.

Improved Noninvasive Diagnostic Evaluations in Treatment-Naïve Adrenocorticotropic Hormone (ACTH)-Dependent Cushing’s Syndrome

Abstract

Background

Bilateral inferior petrosal sinus sampling (BIPSS) is important in the differential diagnosis of adrenocorticotropic hormone (ACTH)-dependent Cushing’s syndrome, but BIPSS is invasive and is not reliable on tumor lateralization. Thus, we evaluated the noninvasive diagnostic evaluations, high-dose dexamethasone suppression test (HDDST) combined with different pituitary MRI scans (conventional contrast-enhanced MRI [cMRI], dynamic contrast-enhanced MRI [dMRI], and high-resolution contrast-enhanced MRI [hrMRI]), by comparison with BIPSS.

Methods

We retrospectively analyzed 95 patients with ACTH-dependent Cushing’s syndrome who underwent HDDST, preoperative MRI scans (cMRI, dMRI and hrMRI) and BIPSS in our hospital between January 2016 and December 2021. The diagnostic performance of HDDST combined with cMRI (HDDST + cMRI), HDDST + dMRI and HDDST + hrMRI, and BIPSS was evaluated, including the sensitivity of identifying pituitary adenomas and the tumor lateralization accuracy.

Results

Compared with BIPSS (AUC, 0.98; 95%CI: 0.93, 1.00), the diagnostic performance of HDDST + hrMRI was comparable in both neuroradiologist 1 (AUC, 0.95; 95%CI: 0.89, 0.99; P = 0.129) and neuroradiologist 2 (AUC, 0.98; 95%CI: 0.92, 1.00; P = 0.707). For tumor lateralization accuracy, HDDST + hrMRI (90.6-95.3%) were significantly higher than that of BIPSS (24.7%, P < 0.001).

Conclusions

In patients with ACTH-dependent Cushing’s syndrome, HDDST + hrMRI, as noninvasive diagnostic evaluations, achieves high diagnostic performance comparable with gold standard (BIPSS), and it is superior to BIPSS in terms of tumor lateralization accuracy.

Peer Review reports

Background

Cushing’s syndrome is associated with debilitating morbidity and increased mortality [1]. Adrenocorticotropic hormone (ACTH)-dependent Cushing’s syndrome is characterized by ACTH hypersecretion. Bilateral inferior petrosal sinus sampling (BIPSS) is regarded as the gold standard to distinguish pituitary ACTH secretion (also known as Cushing’s disease) from ectopic ACTH syndrome (EAS) [12]. However, BIPSS is invasive and is not reliable on tumor lateralization [34]. Thus, it is important to improve the diagnostic performance of noninvasive evaluations with high sensitivity and tumor lateralization accuracy.

Current noninvasive evaluations in the differential diagnosis of ACTH-dependent Cushing’s syndrome include high-dose dexamethasone suppression test (HDDST), the CRH stimulation test and pituitary MRI. However, due to the non-availability of CRH for testing, the sensitivities of current available noninvasive evaluations in identifying ACTH-secreting pituitary adenomas cannot satisfy the clinical needs. Conventional contrast-enhanced MRI (cMRI) and dynamic contrast-enhanced MRI (dMRI) with two-dimensional (2D) fast spin echo (FSE) sequence is routinely used, and only 50–66% of the ACTH-secreting pituitary adenomas can be correctly detected [56]. Recently, by using 3D spoiled gradient recalled (SPGR) sequence, high-resolution contrast-enhanced MRI (hrMRI) has increased the sensitivity to up to 80% [7,8,9]. However, these noninvasive evaluations are still inferior to BIPSS, the sensitivity and specificity of which is about 90–95% [10,11,12,13]. With the development of 3D FSE sequence, superior image quality with diminished artifact has been achieved, providing a reliable alternative to detect pituitary adenomas [14]. Previous studies have shown that hrMRI using 3D FSE sequence has high diagnostic performance for identifying pituitary adenomas [1516]. To our knowledge, no study has investigated the diagnostic performance of HDDST combined with hrMRI using 3D FSE sequence (HDDST + hrMRI) in patients with Cushing’s syndrome, and whether it can avoid unnecessary BIPSS procedure.

The aim of this study is to evaluate the diagnostic performance of HDDST + hrMRI by comparison with BIPSS in patients with ACTH-dependent Cushing’s syndrome.

Methods

This study was performed in line with the principles of the Declaration of Helsinki. Approval was granted by the Institutional Review Board of Peking Union Medical College Hospital. Informed consent was waived in this study because it was a retrospective, non-interventional, and observational study. Clinical trial number is not applicable.

Study design and patient population

We retrospectively reviewed the medical records and imaging studies from January 2016 to December 2021, and 232 consecutive patients with ACTH-dependent Cushing’s syndrome, who underwent HDDST, cMRI, dMRI, hrMRI and BIPSS, were enrolled in the current study. A total of 137 patients were excluded from the study because of prior pituitary surgery (n = 122) or lack of histopathology due to no pituitary surgery in our hospital (n = 15). Finally, 95 patients were included in the current study (Fig. 1) and all the patients included were confirmed by histopathology or by clinical remission after surgical resection of the ACTH-secreting lesion. In the current study, all the patients with Cushing’s disease achieved clinical remission after surgical resection of the ACTH-secreting lesion. All the patients with EAS underwent contrast-enhanced thoracic and abdominal CT to identify the ACTH-secreting lesion. The clinical decision-making process was consistent with the previous study [1].

Fig. 1
figure 1

Flowchart of patient inclusion/exclusion process. ACTH = adrenocorticotropic hormone, BIPSS = bilateral inferior petrosal sinus sampling; cMRI = conventional contrast-enhanced MRI, dMRI = dynamic enhanced MRI, HDDST = high-dose dexamethasone suppression test, hrMRI = high-resolution contrast-enhanced MRI, NPV = negative predictive value, PPV = positive predictive value

HDDST

As previously described [17], the average 24-hour urinary free cortisol (24hUFC) level of 2 days before HDDST was recorded as baseline. Then, 2 mg dexamethasone was administered orally every 6 h for 2 days, and the 24hUFC level of the second day was measured. When the ratio of 24hUFC on the second day after HDDST to 24hUFC at baseline was less than 50%, the suppression in HDDST was marked as positive in the current study.

BIPSS

BIPSS was performed according to Doppman et al. [18]. Blood samples were collected from peripheral veins and bilateral inferior petrosal sinuses (IPSs) at multiple time points (0, 3, 5 and 10 min) after the introduction of 10 µg desmopressin [19]. An IPS to peripheral ACTH ratio of ≥ 2.0 at baseline or ≥ 3.0 after desmopressin stimulation at any time point [20] was marked as positive in the current study. Furthermore, tumor lateralization was predicted by an intersinus ratio of ≥ 1.4 [20].

Imaging

All the images were acquired on a 3.0 Tesla MR scanner (Discovery MR750w, GE Healthcare) using an 8-channel head coil. Detailed acquisition parameters and sequence order before and after contrast injection (gadopentetate dimeglumine [Gd-DTPA] at 0.05 mmol/kg [0.1 mL/kg] with a flow rate of 2 mL/s followed by a 10-mL saline solution flush) were as follows: coronal 2D FSE T2WI (field of view [FOV] = 20 cm × 20 cm, slice thickness = 4 mm, slice spacing = 1 mm, repetition time/echo time [TR/TE] = 4100/90 ms, number of excitation [NEX] = 1.2, matrix = 320 × 320, scan time = 49s), coronal 2D FSE T1WI (FOV = 18 cm × 16.2 cm, slice thickness = 3 mm, slice spacing = 0.6 mm, TR/TE = 400/12 ms, NEX = 2, matrix = 256 × 192, scan time = 49s), sagittal fat-saturated 3D FSE T1WI (FOV = 16.5 cm × 16.5 cm, slice thickness = 3 mm, slice spacing = 0, TR/TE = 460/16 ms, NEX = 2, matrix = 256 × 224, scan time = 60s), dynamic contrast-enhanced coronal 2D FSE T1WI (FOV = 19 cm × 17.1 cm, slice thickness = 2 mm, slice spacing = 0.5 mm, TR/TE = 375/14 ms, NEX = 1, matrix = 288 × 192, scan time = 23s/phase × 6 phases), contrast-enhanced coronal 2D FSE T1WI, contrast-enhanced sagittal fat-saturated 3D FSE T1WI, and contrast-enhanced coronal fat-saturated 3D FSE T1WI (FOV = 15.2 cm × 15.2 cm, slice thickness = 1.2 mm, slice spacing = -0.6 mm, TR/TE = 390/15 ms, NEX = 6, matrix = 256 × 256, scan time = 4 min 30s).

Images were independently evaluated by two experienced neuroradiologists (with 25 and 16 years of experience in neuroradiology, respectively). Both neuroradiologists were blinded to the clinical information of the patients. The image order of cMRI, dMRI and hrMRI was randomized. The detection of pituitary adenomas was scored using a 3-point scale (0 = poor, 1 = fair, 2 = excellent). Scores of 1 or 2 represented a successful pituitary adenoma detection. The gold standard was the histopathology, and the diameter and the location of lesions were recorded on the sequence where identified.

The signal-to-noise ratio (SNR) and contrast-to-noise ratio (CNR) were calculated as follows: SNR = SIadenoma / SDbackground, CNR = |SIpituitary – SIadenoma| / SDbackground. SIpituitary and SIadenoma were defined as the mean signal intensity of the pituitary gland and the pituitary adenoma, respectively. SDbackground was defined as the standard deviation of the signal intensity of the background. CNR was recorded as 0 when no pituitary adenoma was identified. Figure 2 showed the calculation of SNR and CNR using an operator defined region of interest.

Fig. 2

figure 2

The calculation of SNR and CNR using an operator defined region of interest. CNR = contrast-to-noise ratio, SD = standard deviation, SI = signal intensity, SNR = signal-to-noise ratio

Statistical analysis

The κ analysis was conducted to assess the interobserver agreements. The κ value was interpreted as follows: below 0.20, slight agreement; 0.21–0.40, fair agreement; 0.41–0.60, moderate agreement; 0.61–0.80, substantial agreement; greater than 0.80, almost perfect agreement.

To assess the diagnostic performance of different evaluations, the receiver operating characteristic curves were plotted and the area under curves (AUCs) were compared between noninvasive and invasive evaluations for each neuroradiologist by using the DeLong test. Sensitivity, specificity, positive predictive value, and negative predictive value were calculated. The Friedman’s test was used to evaluate the SNR and CNR measurements as well as conspicuity scores of pituitary adenomas between MR protocols, and the Wilcoxon signed-rank test was used for pairwise comparison. The McNemar’s test was used to evaluate the tumor lateralization accuracy. A P value of less than 0.05 was considered statistically significant. A stricter P value of less than 0.017 was considered statistically significant after Bonferroni correction. Statistical analysis was performed using MedCalc Statistical Software (version 23.0.2) and SPSS Statistics (version 22.0).

Results

Clinical characteristics

The clinical characteristics of the 95 patients with Cushing’s syndrome were shown in Table 1. There were 85 patients (median age, 38 years; interquartile range [IQR], 29–51 years; 55 females [65%]) with Cushing’s disease and 10 patients (median age, 39 years; IQR, 30–47 years; 5 females [50%]) with EAS. Of the 85 patients with Cushing’s disease, the median diameter of pituitary adenomas was 5 mm (IQR, 4–5 mm), ranging from 3 to 28 mm. Among them, 80 patients had microadenomas (less than 10 mm in size). Of the ten patients with EAS, one patient had an ovarian carcinoid tumor found by abdominal CT, others had pulmonary carcinoid tumors found by thoracic CT as the cause of Cushing’s syndrome. None of the patients with EAS had a lesion in the pituitary.

Table 1 Clinical characteristics of the patients

Diagnostic performance noninvasive and invasive evaluations

The inter-observer agreements between two neuroradiologists were moderate on cMRI (κ = 0.597), moderate on dMRI (κ = 0.595), and almost perfect on hrMRI (κ = 0.850), respectively.

The diagnostic performance of noninvasive and invasive evaluations was shown in Table 2. Compared with BIPSS (AUC, 0.98; 95%CI: 0.93, 1.00), the diagnostic performance of HDDST + hrMRI was comparable in both neuroradiologist 1 (AUC, 0.95; 95%CI: 0.89, 0.99; P = 0.129) and neuroradiologist 2 (AUC, 0.98; 95%CI: 0.92, 1.00; P = 0.707). However, the diagnostic performance of HDDST + cMRI and HDDST + dMRI was inferior to BIPSS (P ≤ 0.001 for all). No difference was found between HDDST + cMRI and HDDST + dMRI in neuroradiologist 1 (P = 0.050) and neuroradiologist 2 (P = 0.353).

Table 2 The diagnostic performance of noninvasive and invasive evaluations

Figures 3 and 4 showed that microadenomas were correctly diagnosed on hrMRI, but missed on cMRI or dMRI.

Fig. 3

figure 3

Images in a patient with Cushing’s disease. The lesion is missed on (a) coronal contrast-enhanced T1-weighted image and (b) coronal dynamic contrast-enhanced T1-weighted image obtained with two-dimensional (2D) fast spin echo (FSE) sequence. (c) Coronal contrast-enhanced T1-weighted image on high-resolution MRI obtained with 3D FSE sequence shows a round pituitary microadenoma measuring approximately 4 mm with delayed enhancement on the left side of the pituitary gland

Fig. 4

figure 4

Images in a patient with Cushing’s disease. The lesion is missed on (a) coronal contrast-enhanced T1-weighted image and (b) coronal dynamic contrast-enhanced T1-weighted image obtained with two-dimensional (2D) fast spin echo (FSE) sequence. (c) Coronal contrast-enhanced T1-weighted image on high-resolution MRI obtained with 3D FSE sequence shows a round pituitary microadenoma measuring approximately 5 mm with delayed enhancement on the left side of the pituitary gland

Further, subgroup analysis was conducted in 85 patients with Cushing’s disease. The conspicuity scores of pituitary adenomas on cMRI, dMRI and hrMRI were shown in Table 3. Significant differences between three MR protocols were found in neuroradiologist 1 and neuroradiologist 2 (P < 0.001 for both). Pairwise comparison showed no difference between cMRI and dMRI in neuroradiologist 1 (P = 0.732) and neuroradiologist 2 (P = 0.130). However, hrMRI had significantly higher scores than cMRI and dMRI in neuroradiologist 1 and neuroradiologist 2 (P < 0.001 for all). The SNR on cMRI, dMRI and hrMRI were 64.8 (IQR, 50.8–97.0), 42.4 (IQR, 30.2–57.0) and 65.1 (IQR, 51.9–92.4), respectively. The SNR on cMRI and hrMRI were similar (P = 0.759), but they were higher than that of dMRI (P < 0.001 for both). The CNR on cMRI, dMRI and hrMRI were27.0 (IQR, 17.8–43.8), 26.4 (IQR, 17.7–37.5), and 29.7 (IQR, 21.1–45.1), respectively. The CNR were comparable (P = 0.159).

Table 3 Conspicuity scores of pituitary adenomas on MRI

The comparison of tumor lateralization accuracy was shown in Table 4. Because HDDST has no role to identify the tumor lateralization, the tumor lateralization of noninvasive evaluations was only based on MRI. The sensitivity of BIPSS was 96.5% (82/85), comparable to those of hrMRI in neuroradiologist 1 (90.6%, P = 0.227) and neuroradiologist 2 (95.3%, P > 0.99). However, for tumor lateralization accuracy, 36 patients had BIPSS lateralization predicted by an intersinus ratio of ≥ 1.4 [20], and 21 patients had BIPSS lateralization that were concordant in laterality with surgery. The tumor lateralization accuracy was 58.3% (21/36).

Table 4 Tumor lateralization accuracy comparison

In the whole population, the tumor lateralization accuracy of BIPSS in total was 24.7% (21/85), which is significantly lower than those of hrMRI in neuroradiologist 1 (90.6%, P < 0.001) and neuroradiologist 2 (95.3%, P < 0.001).

Discussion

In patients with ACTH-dependent Cushing’s syndrome, it is crucial but challenging to distinguish pituitary secretion from ectopic ACTH secretion. In the current study, the diagnostic performance of noninvasive evaluations, HDDST + hrMRI, is comparable to BIPSS. Moreover, it is superior to BIPSS in terms of tumor lateralization.

No consensus agreement has been made that whether BIPSS should be performed in all the patients with suspected Cushing’s disease, although BIPSS is the gold standard with high sensitivity and specificity, which is about 90–95% [10,11,12,13]. On the one hand, about 10–40% of the population harbor nonfunctioning pituitary adenomas [1321], which may lead to false-positive results without centralizing BIPSS results. On the other hand, BIPSS is invasive and is not reliable on tumor lateralization. BIPSS will be bypassed when the tumor is greater than 6 mm in pituitary MRI and the patient has a classical presentation and dynamic biochemical results consistent with Cushing’s disease [13].

Noninvasive evaluations have comparable sensitivity to BIPSS for identifying pituitary adenomas in patients with Cushing’s disease. With the development of MRI technology, 3D FSE sequence provides a reliable alternative to detect pituitary adenomas [14]. The 3D FSE sequence overcomes the disadvantages of 3D SPGR sequence, such as bright blood and magnetic susceptibility [2223]. By using black blood in 3D FSE sequence, an obvious contrast between the pituitary and the cavernous sinus can be observed. By using fat saturation after enhancement, the hyperintensity of adjacent fat-containing tissue can be suppressed. All these mentioned above can facilitating the identification of pituitary adenomas. The sensitivity of hrMRI using 3D FSE sequence ranges from 87.7 to 93.8%, depending on radiologists with different experience levels [16]. Compared with traditional 2D FSE sequence acquiring images with 2- to 3-mm slice thickness, hrMRI using 3D FSE sequence acquiring images with 1.2-mm slice thickness can dramatically reduce the partial volume averaging effect, improving the identification of the microadenomas [15]. The trade-off between spatial resolution and image noise is challenging in pituitary MRI [24]. Previous studies have proved that hrMRI has high signal-to-noise ratio and contrast-to-noise ratio [1516], and sufficient contrast between pituitary adenomas and the pituitary gland could help to improve the identification of pituitary adenomas. In the current study, the conspicuity scores of hrMRI are significantly higher than those of cMRI and dMRI, supporting that hrMRI is reliable on identifying pituitary lesions. Besides, the diagnosis of Cushing’s disease cannot be made depending on the results of hrMRI alone. Given that there is a population with accidental adenomas when imaging, most of which are nonfunctioning pituitary adenomas, the results of HDDST will help rule out. In the current study, all the patients who underwent surgery had positive histopathology results, which means that no pituitary incidentalomas were found in this population. This might be caused by the relatively small sample size. Eighty patients with Cushing’s disease have microadenomas, and the median diameter at surgery is about 5 mm, consistent with previous studies [2526]. All these mentioned above makes it more difficult to identify the lesions in the current study. However, the sensitivity of HDDST + hrMRI in the current study is up to 95.3%, comparable to the gold standard.

Noninvasive evaluations have significantly higher tumor lateralization accuracy than BIPSS. According to the guideline, surgery is the first-line treatment [3]. Precise location of the pituitary adenoma before surgery can dramatically improve the postoperative remission rate [27]. However, the tumor lateralization accuracy of BIPSS, less than 80% in previous studies [192829], cannot satisfy the clinical need. According to previous studies, the cut-off value for tumor lateralization was set as an intersinus ratio of ≥ 1.4 [20], and the accuracy of lateralization by BIPSS ranged from 48.0 to 78.7% [192829]. In the current study, 36 patients had BIPSS lateralization and 21 patients had BIPSS lateralization that were concordant in laterality with surgery. The tumor lateralization accuracy was 58.3%, consistent with previous studies [192829]. However, the aim of our study is to evaluate the diagnostic performance of BIPSS in all the patients underwent BIPSS, therefore, the tumor lateralization accuracy of BIPSS in total was only 24.7% (21/85). In our study, many patients have positive BIPSS results with an intersinus ratio of < 1.4, resulting in the low tumor lateralization accuracy of BIPSS. One possible reason might be that desmopressin is not so effective. Another possible reason for low tumor lateralization accuracy of BIPSS is that IPSs have considerable anatomy variations. A previous study suggests that BIPSS results are much improved when venous drainage is symmetric [30]. Patients with asymmetric IPSs have dominant venous drainage, and when the dominant side of venous drainage is discordant with the side of the lesion, BIPSS will fail in tumor lateralization [30]. Failure in tumor lateralization will result in multiple incisions into the pituitary in search of adenoma or hemi- or subtotal hypophysectomy, increasing the risk of complications and reducing the remission rate [31]. In total, only 24.7% of the patients have a BIPSS lateralization that were concordant in laterality with surgery, whereas the tumor lateralization accuracy of HDDST + hrMRI is superior to BIPSS with statistical significance.

Limitations of the study included its retrospective nature. The bias may be introduced during the patient inclusion/exclusion process. Patients lack of any of preoperative MRI scans, HDDST, or BIPSS have not been included in the current study. Some patients will bypass hrMRI as well as BIPSS when they have obvious pituitary adenomas on cMRI and dMRI. The diagnostic performance of these evaluations might be better with the inclusion of these patients. Second, the sample size in our current study is relatively small. Because this is a single institutional study and Cushing’s syndrome is a rare disease. The relatively small sample size may limit the conclusions regarding the diagnostic performance of hrMRI for differentiating ectopic from pituitary sources of ACTH. A larger population from multicenter is needed for future study. Besides, a large portion of patients with prior pituitary surgery have been excluded. The imaging findings of these patients are more complicated and hrMRI may show more advantages than routine sequences in this population.

Conclusions

In conclusion, as noninvasive diagnostic evaluations, HDDST + hrMRI achieves high diagnostic performance comparable with gold standard (BIPSS), and it is superior to BIPSS in terms of tumor lateralization accuracy in patients with ACTH-dependent Cushing’s syndrome.

Data availability

The datasets used and analyzed during the current study are available from the corresponding author upon reasonable request.

Abbreviations

24hUFC:
24-hour urinary free cortisol
2D:
Two-dimensional
3D:
Three-dimensional
ACTH:
Adrenocorticotropic hormone
AUC:
Area under curve
BIPSS:
Bilateral inferior petrosal sinus sampling
cMRI:
Contrast-enhanced MRI
CNR:
Contrast-to-noise ratio
dMRI:
Dynamic contrast-enhanced MRI
EAS:
Ectopic adrenocorticotropic hormone syndrome
FSE:
Fast spin echo
HDDST:
High-dose dexamethasone suppression test
hrMRI:
High-resolution contrast-enhanced MRI
IPS:
Inferior petrosal sinus
IQR:
Interquartile range
SNR:
Signal-to-noise ratio
SPGR:
Spoiled gradient recalled

References

  1. Lacroix A, Feelders RA, Stratakis CA, Nieman LK. Cushing’s syndrome. Lancet (London England). 2015;386(9996):913–27.

    Article CAS PubMed Google Scholar

  2. Loriaux DL. Diagnosis and differential diagnosis of cushing’s syndrome. N Engl J Med. 2017;376(15):1451–9.

    Article CAS PubMed Google Scholar

  3. Nieman LK, Biller BM, Findling JW, Murad MH, Newell-Price J, Savage MO, et al. Treatment of cushing’s syndrome: an endocrine society clinical practice guideline. J Clin Endocrinol Metab. 2015;100(8):2807–31.

    Article CAS PubMed PubMed Central Google Scholar

  4. Wind JJ, Lonser RR, Nieman LK, DeVroom HL, Chang R, Oldfield EH. The lateralization accuracy of inferior petrosal sinus sampling in 501 patients with cushing’s disease. J Clin Endocrinol Metab. 2013;98(6):2285–93.

    Article CAS PubMed PubMed Central Google Scholar

  5. Boscaro M, Arnaldi G. Approach to the patient with possible cushing’s syndrome. J Clin Endocrinol Metab. 2009;94(9):3121–31.

    Article CAS PubMed Google Scholar

  6. Kasaliwal R, Sankhe SS, Lila AR, Budyal SR, Jagtap VS, Sarathi V, et al. Volume interpolated 3D-spoiled gradient echo sequence is better than dynamic contrast spin echo sequence for MRI detection of Corticotropin secreting pituitary microadenomas. Clin Endocrinol (Oxf). 2013;78(6):825–30.

    Article CAS PubMed Google Scholar

  7. Grober Y, Grober H, Wintermark M, Jane JA, Oldfield EH. Comparison of MRI techniques for detecting microadenomas in cushing’s disease. J Neurosurg. 2018;128(4):1051–7.

    Article PubMed Google Scholar

  8. Fukuhara N, Inoshita N, Yamaguchi-Okada M, Tatsushima K, Takeshita A, Ito J, et al. Outcomes of three-Tesla magnetic resonance imaging for the identification of pituitary adenoma in patients with cushing’s disease. Endocr J. 2019;66(3):259–64.

    Article PubMed Google Scholar

  9. Patronas N, Bulakbasi N, Stratakis CA, Lafferty A, Oldfield EH, Doppman J, Nieman LK. Spoiled gradient recalled acquisition in the steady state technique is superior to conventional Postcontrast spin echo technique for magnetic resonance imaging detection of adrenocorticotropin-secreting pituitary tumors. J Clin Endocrinol Metab. 2003;88(4):1565–9.

    Article CAS PubMed Google Scholar

  10. Pecori Giraldi F, Cavallo LM, Tortora F, Pivonello R, Colao A, Cappabianca P, et al. The role of inferior petrosal sinus sampling in ACTH-dependent cushing’s syndrome: review and joint opinion statement by members of the Italian society for endocrinology, Italian society for neurosurgery, and Italian society for neuroradiology. NeuroSurg Focus. 2015;38(2):E5.

    Article PubMed Google Scholar

  11. Biller BM, Grossman AB, Stewart PM, Melmed S, Bertagna X, Bertherat J, et al. Treatment of adrenocorticotropin-dependent cushing’s syndrome: a consensus statement. J Clin Endocrinol Metab. 2008;93(7):2454–62.

    Article CAS PubMed PubMed Central Google Scholar

  12. Newell-Price J, Bertagna X, Grossman AB, Nieman LK. Cushing’s syndrome. Lancet (London England). 2006;367(9522):1605–17.

    Article CAS PubMed Google Scholar

  13. Arnaldi G, Angeli A, Atkinson AB, Bertagna X, Cavagnini F, Chrousos GP, et al. Diagnosis and complications of cushing’s syndrome: a consensus statement. J Clin Endocrinol Metab. 2003;88(12):5593–602.

    Article CAS PubMed Google Scholar

  14. Sartoretti T, Sartoretti E, Wyss M, Schwenk A, van Smoorenburg L, Eichenberger B, et al. Compressed SENSE accelerated 3D T1w black blood turbo spin echo versus 2D T1w turbo spin echo sequence in pituitary magnetic resonance imaging. Eur J Radiol. 2019;120:108667.

    Article PubMed Google Scholar

  15. Liu Z, Hou B, You H, Lu L, Duan L, Li M, et al. High-resolution contrast-enhanced MRI with three-dimensional fast spin echo improved the diagnostic performance for identifying pituitary microadenomas in cushing’s syndrome. Eur Radiol. 2023;33(9):5984–92.

    Article PubMed PubMed Central Google Scholar

  16. Liu Z, Hou B, You H, Lu L, Duan L, Li M, et al. Three-Dimensional fast spin echo pituitary MRI in Treatment-Naive cushing’s disease: reduced impact of reader experience and increased diagnostic accuracy. J Magn Reson Imaging. 2024;59(6):2115–23.

    Article PubMed Google Scholar

  17. Liu Z, Zhang X, Wang Z, You H, Li M, Feng F, Jin Z. High positive predictive value of the combined pituitary dynamic enhanced MRI and high-dose dexamethasone suppression tests in the diagnosis of cushing’s disease bypassing bilateral inferior petrosal sinus sampling. Sci Rep. 2020;10(1):14694.

    Article CAS PubMed PubMed Central Google Scholar

  18. Doppman JL, Oldfield E, Krudy AG, Chrousos GP, Schulte HM, Schaaf M, Loriaux DL. Petrosal sinus sampling for Cushing syndrome: anatomical and technical considerations. Work in progress. Radiology. 1984;150(1):99–103.

    Article CAS PubMed Google Scholar

  19. Machado MC, de Sa SV, Domenice S, Fragoso MC, Puglia P Jr., Pereira MA, et al. The role of Desmopressin in bilateral and simultaneous inferior petrosal sinus sampling for differential diagnosis of ACTH-dependent cushing’s syndrome. Clin Endocrinol (Oxf). 2007;66(1):136–42.

    Article CAS PubMed Google Scholar

  20. Oldfield EH, Doppman JL, Nieman LK, Chrousos GP, Miller DL, Katz DA, et al. Petrosal sinus sampling with and without corticotropin-releasing hormone for the differential diagnosis of cushing’s syndrome. N Engl J Med. 1991;325(13):897–905.

    Article CAS PubMed Google Scholar

  21. Chong BW, Kucharczyk W, Singer W, George S. Pituitary gland MR: a comparative study of healthy volunteers and patients with microadenomas. AJNR Am J Neuroradiol. 1994;15(4):675–9.

    CAS PubMed PubMed Central Google Scholar

  22. Lien RJ, Corcuera-Solano I, Pawha PS, Naidich TP, Tanenbaum LN. Three-Tesla imaging of the pituitary and parasellar region: T1-weighted 3-dimensional fast spin echo cube outperforms conventional 2-dimensional magnetic resonance imaging. J Comput Assist Tomogr. 2015;39(3):329–33.

    PubMed Google Scholar

  23. Kakite S, Fujii S, Kurosaki M, Kanasaki Y, Matsusue E, Kaminou T, Ogawa T. Three-dimensional gradient echo versus spin echo sequence in contrast-enhanced imaging of the pituitary gland at 3T. Eur J Radiol. 2011;79(1):108–12.

    Article PubMed Google Scholar

  24. Kim M, Kim HS, Kim HJ, Park JE, Park SY, Kim YH, et al. Thin-Slice pituitary MRI with deep Learning-based reconstruction: diagnostic performance in a postoperative setting. Radiology. 2021;298(1):114–22.

    Article PubMed Google Scholar

  25. Vitale G, Tortora F, Baldelli R, Cocchiara F, Paragliola RM, Sbardella E, et al. Pituitary magnetic resonance imaging in cushing’s disease. Endocrine. 2017;55(3):691–6.

    Article CAS PubMed Google Scholar

  26. Jagannathan J, Smith R, DeVroom HL, Vortmeyer AO, Stratakis CA, Nieman LK, Oldfield EH. Outcome of using the histological pseudocapsule as a surgical capsule in Cushing disease. J Neurosurg. 2009;111(3):531–9.

    Article PubMed PubMed Central Google Scholar

  27. Yamada S, Fukuhara N, Nishioka H, Takeshita A, Inoshita N, Ito J, Takeuchi Y. Surgical management and outcomes in patients with Cushing disease with negative pituitary magnetic resonance imaging. World Neurosurg. 2012;77(3–4):525–32.

    Article PubMed Google Scholar

  28. Deipolyi A, Bailin A, Hirsch JA, Walker TG, Oklu R. Bilateral inferior petrosal sinus sampling: experience in 327 patients. J Neurointerv Surg. 2017;9(2):196–9.

    Article PubMed Google Scholar

  29. Castinetti F, Morange I, Dufour H, Jaquet P, Conte-Devolx B, Girard N, Brue T. Desmopressin test during petrosal sinus sampling: a valuable tool to discriminate pituitary or ectopic ACTH-dependent cushing’s syndrome. Eur J Endocrinol. 2007;157(3):271–7.

    Article CAS PubMed Google Scholar

  30. Lefournier V, Martinie M, Vasdev A, Bessou P, Passagia JG, Labat-Moleur F, et al. Accuracy of bilateral inferior petrosal or cavernous sinuses sampling in predicting the lateralization of cushing’s disease pituitary microadenoma: influence of catheter position and anatomy of venous drainage. J Clin Endocrinol Metab. 2003;88(1):196–203.

    Article CAS PubMed Google Scholar

  31. Castle-Kirszbaum M, Amukotuwa S, Fuller P, Goldschlager T, Gonzalvo A, Kam J, et al. MRI for Cushing disease: A systematic review. AJNR Am J Neuroradiol. 2023;44(3):311–6.

    Article CAS PubMed PubMed Central Google Scholar

Download references

Acknowledgements

We thank Dr. Kai Sun, Medical Research Center, Peking Union Medical College Hospital, for his guidance on the statistical analysis in this study. We thank all the patients who participated in this study.

Funding

This study was supported by the National Natural Science Foundation of China (grants 82371946 and 82071899), the Chinese Academy of Medical Sciences Innovation Fund for Medical Sciences (grant 2021-I2M-1-025), and the National High Level Hospital Clinical Research Funding (grants 2022-PUMCH-B-067 and 2022-PUMCH-B-114). The funding played no role in the design of the study and collection, analysis, and interpretation of data and in writing the manuscript.

Author information

Authors and Affiliations

  1. Department of Radiology, Peking Union Medical College Hospital, Chinese Academe of Medical Sciences and Peking Union Medical College, No.1 Shuaifuyuan Wangfujing Dongcheng Distinct, Beijing, 100730, China

    Zeyu Liu, Bo Hou, Hui You, Mingli Li & Feng Feng

  2. Department of Endocrinology, Peking Union Medical College Hospital, Chinese Academe of Medical Sciences and Peking Union Medical College, No.1 Shuaifuyuan Wangfujing Dongcheng Distinct, Beijing, 100730, China

    Lin Lu, Lian Duan & Huijuan Zhu

  3. Department of Neurosurgery, Peking Union Medical College Hospital, Chinese Academe of Medical Sciences and Peking Union Medical College, No.1 Shuaifuyuan Wangfujing Dongcheng Distinct, Beijing, 100730, China

    Kan Deng & Yong Yao

  4. State Key Laboratory of Complex Severe and Rare Disease, Peking Union Medical College Hospital, Chinese Academe of Medical Sciences and Peking Union Medical College, No.1 Shuaifuyuan Wangfujing Dongcheng Distinct, Beijing, 100730, China

    Yong Yao, Huijuan Zhu & Feng Feng

Contributions

All authors have participated sufficiently in this submission to take public responsibility for its content. H.Y. and F.F. proposed research ideas, revised the paper, and reviewed it academically. B.H. and Z.L. were responsible for literature review, data analysis and writing the manuscript. M.L. revised the paper. L.L., L.D. and H.Z. collected the clinical data. K.D. and Y.Y. collected the surgical and histopathology data. All authors reviewed the manuscript.

Corresponding authors

Correspondence to Hui You or Feng Feng.

Ethics declarations

Ethics approval and consent to participate

This study was performed in line with the principles of the Declaration of Helsinki. Approval was granted by the Institutional Review Board of Peking Union Medical College Hospital. Informed consent was waived by Institutional Review Board of Peking Union Medical College Hospital, because it was a retrospective, non-interventional, and observational study.

Consent for publication

Not applicable.

Competing interests

The authors declare no competing interests.

Additional information

Publisher’s note

Springer Nature remains neutral with regard to jurisdictional claims in published maps and institutional affiliations.

About this article

Cite this article

Liu, Z., Hou, B., You, H. et al. Improved noninvasive diagnostic evaluations in treatment-naïve adrenocorticotropic hormone (ACTH)-dependent Cushing’s syndrome. BMC Med Imaging 25, 252 (2025). https://doi.org/10.1186/s12880-025-01786-y

Download citation

https://bmcmedimaging.biomedcentral.com/articles/10.1186/s12880-025-01786-y

Predictors of Cancer in Patients With Endogenous Cushing’s Syndrome

We previously reported an increase in overall cancer risk in patients with endogenous Cushing’s syndrome (CS), mainly during the 10-year period following CS diagnosis.

To identify predictors of cancer in patients with CS, we conducted this retrospective nationwide cohort study of patients with CS, diagnosed between 2000 and 2023 in Israel. The cohort comprised 609 patients with CS (age at diagnosis, 48.1 ± 17.2 years; 65.0% women) and 3,018 age-, sex-, socioeconomic status-, and body mass index-matched controls (1:5 ratio).

Patients were grouped according to the occurrence of any malignancy within 10-years after the diagnosis of CS. Cox proportional hazards models, with death as a competing event, were used to identify predictors of cancer development. Independent predictors of cancer development in patients with CS included age ≥60 years (HR 1.75, 95% CI 1.01–2.68), male gender (HR 1.67, 95% CI 1.04–3.05), and adrenal-origin CS (HR 1.66, 95% CI 1.01–2.73). Baseline urinary-free cortisol levels were not associated with cancer development. Patients with ≥4 CS-associated comorbidities had a higher cancer risk (HR 1.76, 95% CI 1.03–3.02; age- and sex-adjusted). The overall 10-year risk of malignancy was twice as high in patients with CS compared to matched controls, with cancer developing, on average, 5 years earlier in patients with CS (62.3 ± 15.0 vs 67.2 ± 12.3 years). Cancer-related mortality at 10-years was twice as high in deceased patients with CS, compared to deceased controls. In conclusion, age ≥60 years at CS diagnosis, male gender, and adrenal-origin CS are independent predictors of cancer diagnosis within 10-years of initial confirmation of CS.


Introduction

Prolonged cortisol exposure may promote cancer development and growth (Mayayo-Peralta et al. 2021Khadka et al. 2023). Epidemiological research showed that extended glucocorticoids use is associated with elevated overall cancer risk (Oh & Song 2020). Recently, several studies suggested that cortisol levels increase cancer risk in patients with endogenous Cushing’s syndrome (CS). A Danish study found higher rates of cancer at the time of CS diagnosis compared to controls (Dekkers et al. 2013). A Swedish study examined comorbidity rates in patients with CS and identified a nonsignificant trend of increased cancer rates in CS compared to the general population, but was probably underpowered for this relatively rare outcome (Papakokkinou et al. 2020). Our nationwide retrospective matched-cohort study, using the Clalit Health Services (CHS) database in Israel (including 609 patients with CS and 3,018 age-, sex-, socioeconomic status- and body mass index (BMI)-matched controls), observed higher rates of all cancer types in patients with CS, with a hazard ratio (HR) of 1.78 (95% CI 1.44–2.20) (Rudman et al. 2024). Elevated cancer incidence was evident in patients with Cushing’s disease (CD) and in patients with adrenal CS. The overall cancer risk remained elevated during the first 10 years that followed CS diagnosis (Rudman et al. 2024). Similarly, a nationwide cohort study from Taiwan investigated the association between endogenous CS and cancer incidence, and reported a standardized incidence ration of 2.08 (95% CI 1.54–2.75) for cancer in patients with endogenous CS (Wu et al. 2025).
Hypercortisolemia and CS-associated comorbidities could drive malignancy development in patients with CS (Rudman et al. 2024Wu et al. 2025). While it is known that the incidence of diabetes, obesity and insulin resistance is higher in patients with CS than that of the general population (Pivonello et al. 2016Fleseriu et al. 2021Reincke & Fleseriu 2023) – all of which are linked to cancer development (Renehan et al. 2008Ling et al. 2020) – it remains unclear whether these comorbidities specifically contribute to the risk of malignancy within the CS population.
Thus, the aims of the present study were to identify the baseline predictors of cancer development in CS and to test the hypothesis that cumulative cortisol exposure, measured by urinary-free cortisol (UFC), predicts cancer risk in patients with CS.

Methods

Study design and data collection

We conducted a retrospective matched-cohort study using the electronic health record database of Clalit Health Services (CHS), the largest health maintenance organization (HMO) in Israel with over 4.8 million members. The CHS database includes demographic and clinical data, hospital and outpatient clinic diagnoses, medication dispensation, and all laboratory test results conducted at the HMO’s laboratories. All diagnoses and respective dates were identified using the International Classification of Diseases, tenth revision (ICD-10) codes (Supplementary Table S1 (see section on Supplementary materials given at the end of the article)). Weight and height data, and smoking status, were recorded regularly during visits to primary care clinics and in some specialized clinics. 24 h UFC results were collected and the normal reference range for each kit used. As these tests were performed by several different laboratories and devices (in all cases the bioanalytical method used was an immunoassay test), the results were reported as multiples of the upper limit of normal (×ULN). Data were extracted using the CHS research data-sharing platform, powered by MDClone. Importantly, the diagnoses of chronic medical conditions, recorded at the time of CS diagnosis, were validated: any member of CHS who required chronic treatment for a medical condition (e.g., medication for hypertension or diabetes) could only receive his prescriptions if the primary physician has registered the diagnosis, coded according to the ICD-10, in the computerized system. Mortality data were collected from the hospital’s mortality database, which is updated from the Ministry of Interior’s population registry. Data on cancer-specific mortality were obtained from hospital discharge certificates at the time of the hospitalization that ultimately resulted in the patient’s death. The study protocol, including detailed data collection methods, has been previously published (Rudman et al. 2024).

Ethical approval

The study was approved by the institutional ethics review board of Rabin Medical Center. As data were collected anonymously and in a retrospective manner, a waiver of informed consent was granted.

Patients and outcome measures

The methods we used for patient selection and matched controls selection have been previously published (Rudman et al. 2024), as the current study is based on the same group of patients with CS and controls. After the initial screening, potential cases with ICD-10 diagnosis of CS had to fulfill at least one of the following criteria: i) 24 h UFC ≥4 ×ULN, ii) 24 h UFC ≥3 ×ULN and surgical intervention to remove a pituitary or adrenal adenoma, and iii) 24 h UFC ≥2 ×ULN and metyrapone, ketoconazole, osilodrostat, cabergoline, or pasireotide treatment. All patients with CS and non-suppressed adrenocorticotropic hormone (ACTH) levels who did not receive pituitary-directed therapy and were diagnosed with a malignancy possibly causative of ectopic CS, including small-cell lung carcinoma, bronchial and thymic carcinoids, medullary thyroid carcinoma, neuroendocrine tumors or pheochromocytoma, were suspected of ectopic CS and were excluded from this study (Rudman et al. 2024). Patients diagnosed with adrenocortical carcinoma before or within 5 years of CS diagnosis were excluded.
All identified cases were individually matched in a 1:5 ratio with age-, sex-, socioeconomic status-, and BMI-matched controls from the general population (CHS members who have never been tested for suspected hypercortisolism). The age of the individually matched controls matched the age of cases ±12 months.
The follow-up period began at the time of CS diagnosis for all cases (newly diagnosed patients with CS) and at the exact same day for each individually matched control. It continued until death, termination of CHS membership, or until the date of data collection (June 30, 2023).
The main outcome measure was the first diagnosis of any malignancy following CS diagnosis, excluding non-melanoma skin cancer. Recurrences of known malignancies were also excluded.

Statistical analysis

The statistical analysis was generated using the SAS Software, Version 9.4, SAS Institute Inc., Cary, NC, USA. Continuous variables were presented by the mean ± standard deviation or median (interquartile range (IQR)). Categorical variables were presented by (n, %). Normality of continuous variables was assessed using the Kolmogorov–Smirnov test. The t-test, Mann–Whitney test, and chi-square test were used for comparison of normally distributed, non-normal, and categorical variables, respectively. The Cox proportional hazard model, with death without malignancy treated as a competing risk, was used to calculate both univariate and multivariate HR; the Fine and Gray methodology for dealing with competing risks was used, both in the cumulative incidence plots and in HR calculations. Baseline variables found to be associated with malignancy in the univariate analysis (with a between-group P-value below 0.05) were incorporated into the multivariate model. The appropriateness of the proportional hazard assumption was assessed visually. Two-sided P-values less than 0.05 were considered statistically significant.

Results

Patient characteristics

From January 1, 2000, to June 30, 2023, a total of 609 patients with CS met the study inclusion criteria (65.0% women, mean age at CS diagnosis of 48.1 ± 17.2 years). All cases of CS were matched with up to five controls based on age, sex, socioeconomic status, and BMI, and amounted to a total of 3,018 controls. Baseline characteristics of all 609 patients and 3,018 controls, with subdivisions according to disease source, are shown in Table 1.

Table 1. Baseline characteristics (at diagnosis/time 0) of patients with Cushing’s syndrome (CS) and matched control of all patients with CS, Cushing’s disease (CD), and adrenal CS.

Baseline characteristics, all patients with CS CS (n = 609) Matched controls (n = 3,018) P value CD (n = 251) Matched controls (n = 1,246) P value Adrenal CS (n = 200) Matched controls (n = 991) P value
Age, years, mean (SD) 48.1 (17.2) 47.9 (17.2) 45.7 (17.8) 45.7 (17.8) 51.1 (16.6) 51.0 (16.6)
Sex, no. (%)
 Females 396 (65.0) 1,975 (65.4) 164 (65.3) 818 (65.6) 137 (68.5) 684 (69.0)
 Males 213 (35.0) 1,043 (34.6) 87 (34.7) 428 (34.4) 63 (31.5) 307 (31.0)
Socioeconomic status, no. (%)a
 Low 74 (12.8) 371 (13.0) 34 (14.2) 172 (14.5) 20 (10.5) 99 (10.4)
 Middle 349 (60.6) 1,719 (60.3) 145 (60.7) 713 (60.2) 119 (62.6) 594 (62.9)
 High 153 (26.6) 760 (26.7) 60 (25.1) 300 (25.3) 51 (26.9) 252 (26.7)
Body mass index, Kg/m2, mean (SD)b 30.9 (7.6) 30.0 (6.9) 30.2 (7.4) 29.6 (6.8) 30.8 (7.1) 30.3 (6.3)
Source of hypercortisolism, no. (%)
 Cushing’s disease 251 (41.2)
 Adrenal Cushing’s syndrome 200 (32.8)
 Indeterminatec 158 (25.9)
Smoking status, no. (%)d 0.35 0.77 0.18
 Non-smoker 198 (59.8) 910 (62.6) 87 (64.0) 387 (65.3) 61 (53.0) 327 (60.1)
 Smoker/former smoker 133 (40.2) 544 (37.4) 49 (36.0) 206 (34.7) 54 (47.0) 217 (39.9)
Comorbidities, no. (%)
 Diabetes mellitus 140 (23.0) 396 (13.1) <0.01 55 (21.9) 148 (11.9) <0.01 51 (25.5) 158 (15.9) <0.01
 Hypertension 343 (56.3) 957 (31.7) <0.01 129 (51.4) 338 (27.1) <0.01 129 (64.5) 387 (39.0) <0.01
 Dyslipidemia 258 (42.4) 874 (29.0) <0.01 97 (38.6) 305 (24.5) <0.01 97 (48.5) 339 (34.2) <0.01
 Ischemic heart disease 70 (11.5) 191 (6.3) <0.01 23 (9.2) 67 (5.4) 0.03 25 (12.5) 77 (7.8) 0.04
 Cerebrovascular disease 27 (4.4) 82 (2.7) 0.04 12 (4.8) 35 (2.8) 0.11 10 (5.0) 32 (3.2) 0.21
 Osteoporosis 75 (12.3) 187 (6.2) <0.01 26 (10.4) 57 (4.6) <0.01 28 (14.0) 82 (8.3) 0.02
 Malignancy before CS diagnosis 50 (8.2) 117 (3.9) <0.01 15 (6.0) 48 (3.9) 0.12 20 (10.0) 50 (5.0) 0.01
Cases and controls were individually matched for age, sex, socioeconomic status, and body mass index.
a
Cushing’s syndrome n = 576, controls n = 2,850; Cushing’s disease n = 239, controls n = 1,185; adrenal Cushing’s syndrome n = 190, controls n = 945.
b
Cushing’s syndrome n = 363, controls n = 1,549; Cushing’s disease n = 152, controls n = 644; adrenal Cushing’s syndrome n = 131, controls n = 570.
c
Ectopic ACTH secretion and adrenocortical carcinoma were excluded.
d
Cushing’s syndrome n = 331, controls n = 1,454; Cushing’s disease n = 136, controls n = 593; adrenal Cushing’s syndrome n = 115, controls n = 544.
At baseline, diabetes mellitus, hypertension, dyslipidemia, ischemic heart disease, and osteoporosis were more common among patients with CS (P < 0.01). Smoking rates were similar between the two groups (Table 1). A prior history of malignancy was more prevalent among patients with CS than controls (8.2 vs 3.9%, respectively; P < 0.01) (Table 1).

Predictors of new malignancy in patients with Cushing’s syndrome

Table 2 presents the baseline characteristics of 609 patients with CS, including demographic data, CS etiology, history of malignancy before CS diagnosis, maximal UFC at diagnosis, and CS-associated comorbidities. In a univariate time-to-event analysis of the 10-year cumulative cancer risk, accounting for death as a competing event, we found that age ≥60 years at CS diagnosis, male gender, adrenal-origin CS, hypertension, dyslipidemia, and ischemic heart disease at baseline were all associated with a higher cancer risk. The 10-year cumulative cancer risk, with death as a competing event, stratified by age, sex, and CS etiology is shown in Fig. 1. Prior malignancy, diabetes, and obesity were not associated with an increased risk of malignancy in patients with CS (Table 2). The cohort was divided into three groups based on baseline UFC level (below 5 ×ULN, 5–10 ×ULN, and above 10 ×ULN) with comparison of time to cancer occurrence. Higher UFC levels at the time of CS diagnosis were not associated with cancer development (Table 2 and Fig. 2). In a multivariable Cox regression model (multivariable model 1, Table 2), we found that age ≥60 years at CS diagnosis (HR 1.75, 95% CI 1.01–2.68), male gender (HR 1.67, 95% CI 1.04–3.05), and adrenal-origin CS (HR 1.66, 95% CI 1.01–2.73) were independent predictors of cancer development within 10 years after CS diagnosis. In an additional model (multivariable model 2, Table 2), we observed that patients with ≥4 CS-associated comorbidities at the time of CS diagnosis had a higher risk of cancer (HR 1.76, 95% CI 1.03–3.02), after adjustment for age and sex.

Table 2. Univariate analysis and multivariable regression models for the 10-year cumulative cancer risk in patients with Cushing’s syndrome, accounting for death as a competing event.

Baseline characteristics Patients (n = 609) Incident cases of cancer (n = 81) Deaths without cancer (n = 40) Univariate analysis Multivariable model 1* Multivariable model 2 (total no. of CS-associated comorbidities, with age and sex adjustment)
Age <60 years (ref) 444 44 10
Age ≥60 years 165 37 30 2.47 (1.60–3.82) 1.75 (1.01–2.68) 3.18 (2.09–4.86)
Female (ref) 396 42 23
Male 213 39 17 1.75 (1.13–2.70) 1.67 (1.04–3.05) 1.60 (1.11–2.29)
Low SESa 74 13 5 1.29 (0.65–2.56)
Medium SESa 349 42 21 0.87 (0.52–1.45)
High SES (ref)a 153 22 13
Cushing’s disease (ref)b 251 27 21
Adrenal CSb 200 39 8 1.87 (1.14–3.05) 1.66 (1.01–2.73)
Non-smoker (ref)c 198 25 12
Smoker/former smokerc 133 21 12 1.25 (0.70–2.23)
Prior malignancy 50 6 14 0.91 (0.40–2.08)
No prior malignancy (ref) 559 75 26
Maximal urinary free cortisold
 <5 × ULN (ref) 231 38 18
 5–10 × ULN 135 18 7 0.86 (0.49–1.48)
 ≥10 × ULN 70 10 4 0.89 (0.45–1.78)
CS-associated comorbidities
 Obesitye 176 28 17 1.22 (0.71–2.11)
 No obesity (ref)e 187 24 12
 Diabetes mellitus 140 21 14 1.28 (0.78–2.10)
 No diabetes mellitus (ref) 469 60 26
 Hypertension 343 59 34 2.23 (1.36–3.65) 1.52 (0.83–2.81)
 No hypertension (ref) 266 22 6
 Dyslipidemia 258 44 29 1.81 (1.17–2.81) 0.97 (0.55–1.72)
 No dyslipidemia (ref) 351 37 11
 Ischemic heart disease 70 19 11 2.70 (1.62–4.51) 1.48 (0.81–2.71)
 No ischemic heart disease (ref) 539 62 29
 Stroke 27 3 2 1.07 (0.33–3.49)
 No stroke (ref) 582 78 38
 Osteoporosis 75 9 9 0.92 (0.46–1.84)
 No osteoporosis (ref) 534 72 31
Total no. of CS-associated comorbiditiesf
 0–1 (ref) 295 27 9
 2–3 205 33 15 2.09 (1.36–3.22) 1.40 (0.87–2.26)
 ≥4 109 21 16 3.76 (2.37–5.97) 1.76 (1.03–3.02)
CS, Cushing’s syndrome; SES, socioeconomic status; ULN, upper limit of normal. Bold indicates statistical significance.
*
Included variables: age, sex, source of hypercortisolism, hypertension, dyslipidemia, and ischemic heart disease.
a
n = 576.
b
Ectopic ACTH secretion and adrenocortical carcinoma were excluded.
c
n = 331.
d
Maximal value of urinary-free cortisol divided by the upper limit of normal of the specific assay, n = 436.
e
n = 363.
f
CS-associated comorbidities include obesity, diabetes mellitus, hypertension, dyslipidemia, ischemic heart disease, and osteoporosis.
Figure 1

  1. Download: Download high-res image (201KB)
  2. Download: Download full-size image

Figure 1. The 10-year cumulative cancer risk, with death as a competing event, among patients with Cushing’s syndrome, according to age at diagnosis (A), sex (B), and Cushing’s syndrome etiology (C). CD, Cushing’s disease; CS, Cushing’s syndrome. A full colour version of this figure is available at https://doi.org/10.1530/ERC-25-0059.

Figure 2

  1. Download: Download high-res image (61KB)
  2. Download: Download full-size image

Figure 2. The 10-year cumulative cancer risk, with death as a competing event, among patients with Cushing’s syndrome, according to the maximal value of UFC divided by the upper limit of normal (ULN) of the specific assay used: UFC <5 × ULN (reference), 5–10 × ULN, and ≥10 × ULN. A full colour version of this figure is available at https://doi.org/10.1530/ERC-25-0059.

Univariate analysis and multivariable regression models for the 10-year cumulative cancer risk in patients with CD and adrenal CS are presented in Tables 3 and 4. In the univariate time-to-event analysis of 251 patients with CD, age ≥60 years at CS diagnosis and the presence of dyslipidemia and ischemic heart disease at baseline were associated with higher cancer risk. The multivariable Cox regression model did not identify any significant predicting factors in patients with CD. Tables 3 and 4 also present the univariate analysis for the 10-year cumulative cancer risk in 200 patients with adrenal CS, which showed that age ≥60 years, male gender, and ischemic heart disease were associated with cancer development. In the multivariable model, only age ≥60 years at CS diagnosis (HR 2.66, 95% CI 1.36–5.18) was found to be independently associated with cancer development in patients with adrenal CS (Table 4). UFC levels at the time of CS diagnosis were not associated with new cancer diagnosis in either patients with CD or with adrenal CS (Tables 3 and 4).

Table 3. Univariate analysis and multivariable regression models for the 10-year cumulative cancer risk in patients with Cushing’s disease, accounting for death as a competing event.

Cushing’s disease baseline characteristics Patients (n = 251) Incident cases of cancer (n = 27) Deaths without cancer (n = 21) Univariable Multivariable model 1 Multivariable model 2 (total no. of CS-associated comorbidities, with age and sex adjustment)
Age <60 years (ref) 196 16 8
Age ≥60 years 55 11 13 2.72 (1.27–5.81) 1.83 (0.65–5.18) 3.54 (1.81–6.92)
Female (ref) 164 14 14
Male 87 13 7 1.79 (0.85–3.80) 1.61 (0.73–3.56) 1.22 (0.68–2.18)
Low SESa 34 5 5 1.29 (0.42–3.99)
Medium SESa 145 13 12 0.81 (0.32–2.00)
High SES (ref)a 60 7 4
Non-smoker (ref)b 87 6 6
Smoker/former smokerb 49 8 8 2.59 (0.91–7.39)
Prior malignancy 15 26 15 0.66 (0.09–5.13)
No prior malignancy (ref) 236 1 6
Maximal urinary-free cortisolc
 <5 × ULN (ref) 133 15 14
 5–10 × ULN 70 6 3 0.78 (0.31–2.00)
 ≥10 × ULN 40 6 4 1.48 (0.57–3.79)
CS-associated comorbidities
 Obesityd 69 7 10 0.80 (0.31–2.09)
 No obesity (ref)d 83 10 6
 Diabetes mellitus 55 5 6 0.89 (0.34–2.35)
 No diabetes mellitus (ref) 196 22 15
 Hypertension 129 17 17 1.67 (0.76–3.64)
 No hypertension (ref) 122 10 4
 Dyslipidemia 97 15 13 2.31 (1.08–4.96) 1.64 (0.58–4.61)
 No dyslipidemia (ref) 154 12 8
 Ischemic heart disease 23 5 4 2.71 (1.03–7.08) 1.29 (0.43–3.86)
 No ischemic heart disease (ref) 228 22 17
 Stroke 12 2 1 2.34 (0.53–10.30)
 No stroke (ref) 239 25 20
 Osteoporosis 26 24 15 1.14 (0.35–3.66)
 No osteoporosis (ref) 225 3 6
Total no. of CS-associated comorbiditiese
 0–1 (ref) 136 11 6
 2–3 74 10 8 2.19 (1.13–4.26) 1.48 (0.72–3.04)
 ≥4 41 6 7 3.69 (1.78–7.66) 1.72 (0.73–4.02)
CS, Cushing’s syndrome; SES, socioeconomic status; ULN, upper limit of normal. Bold indicates statistical significance.
a
n = 239.
b
n = 136.
c
Maximal value of urinary free cortisol divided by the upper limit of normal of the specific assay; n = 243.
d
Cushing’s disease, n = 152.
e
CS-associated comorbidities include obesity, diabetes mellitus, hypertension, dyslipidemia, ischemic heart disease, and osteoporosis.

Table 4. Univariate analysis and multivariable regression models for the 10-year cumulative cancer risk in patients with adrenal Cushing’s syndrome, accounting for death as a competing event.

Adrenal Cushing’s syndrome baseline characteristics Patients with CS at risk (n = 200) Incident cases of cancer (n = 39) Deaths without cancer (n = 8) Univariable Multivariable model 1 Multivariable model 2 (total no. of CS-associated comorbidities, with age and sex adjustment)
Age <60 years (ref) 134 20 1
Age ≥60 years 66 19 7 2.12 (1.13–3.96) 2.66 (1.36–5.18) 2.70 (1.35–5.42)
Female (ref) 137 17 3
Male 63 22 5 2.97 (1.58–5.58) 1.81 (0.94–3.51) 3.11 (1.73–5.57)
Low SESa 20 3 0 0.62 (0.17–2.28)
Medium SESa 119 22 3 0.73 (0.36–1.44)
High SES (ref)a 51 13 5
Non-smoker (ref)b 61 12 3
Smoker/former smokerb 54 10 2 0.86 (0.38–1.99)
Prior malignancy 20 4 2 1.03 (0.38–2.81)
No prior malignancy (ref) 180 35 6
Maximal urinary free cortisolc
 <5 × ULN (ref) 98 23 4
 5–10 × ULN 65 12 4 0.84 (0.42–1.69)
 ≥10 × ULN 30 4 0 0.53 (0.18–1.52)
CS-associated comorbidities
 Obesityd 64 15 4 1.68 (0.75–3.74)
 No obesity (ref)d 67 10 3
 Diabetes mellitus 51 12 3 1.47 (0.75–2.89)
 No diabetes mellitus (ref) 149 27 5
 Hypertension 129 29 7 1.73 (0.84–3.58)
 No hypertension (ref) 71 10 1
 Dyslipidemia 97 20 7 1.20 (0.65–2.25)
 No dyslipidemia (ref) 103 19 1
 Ischemic heart disease 25 10 4 2.65 (1.31–5.34) 1.51 (0.68–3.32)
 No ischemic heart disease (ref) 175 29 4
 Stroke 10 1 1 0.58 (0.08–4.35)
 No stroke (ref) 190 38 7
 Osteoporosis 28 2 2 0.32 (0.08–1.33)
 No osteoporosis (ref) 172 37 6
Total no. of CS-associated comorbiditiese
 0–1 (ref) 82 14 1
 2–3 76 15 2 1.24 (0.62–2.48) 0.95 (0.44–2.02)
 ≥4 42 10 5 2.46 (1.20–5.05) 1.21 (0.51–2.85)
CS, Cushing’s syndrome; SES, socioeconomic status; ULN, upper limit of normal. Bold indicates statistical significance.
a
n = 190.
b
n = 115.
c
Maximal value of urinary-free cortisol divided by the upper limit of normal of the specific assay; n = 193.
d
n = 131.
e
CS-associated comorbidities include obesity, diabetes mellitus, hypertension, dyslipidemia, ischemic heart disease, and osteoporosis.

The 10-year cancer risk in patients with Cushing’s syndrome vs controls

In the 10 years following CS diagnosis, 81 (13.3%) patients with CS were diagnosed with cancer and 40 (6.6%) died without malignancy, compared with 206 (6.8%) and 152 (5.0%) controls, respectively. Similar to the previously reported risk for the entire follow-up period (Rudman et al. 2024), the overall 10-year risk of malignancy, calculated with death as a competing event, was twice as high in patients with CS than in matched controls (HR 2.01; 95% CI, 1.55–2.60) (Supplementary Fig. S1).
The mean age of cancer development in patients with CS was 62.3 ± 15.0 years, compared with 67.2 ± 12.3 years in controls (P < 0.01). The risk of cancer across different subgroups (patients with CS vs controls) is shown in Fig. 3 and Table 5. The number of cases for each type of cancer in patients with CS and controls is shown in Supplementary Table S2.
Figure 3

  1. Download: Download high-res image (222KB)
  2. Download: Download full-size image

Figure 3. The 10-year cancer risk in subgroups of the entire cohort (cases vs matched controls). Cases and controls were individually matched for age, sex, socioeconomic status, and body mass index.

Table 5. The 10-year cancer risk in subgroups of the entire cohort (cases vs matched controls).

Subgroup Cushing’s syndrome Individually matched controls HR 95% CI
Patients Incident cases of cancer Deaths Patients Incident cases of cancer Deaths
Age
 <60 444 44 10 2,200 84 30 2.67 1.85–3.85
 ≥60 165 37 30 818 122 122 1.55 1.08–2.24
Sex
 Females 396 42 23 1,975 117 89 1.83 1.29–2.61
 Males 213 39 17 1,043 89 63 2.25 1.54–3.28
Socioeconomic status
 Low 74 13 5 371 14 17 5.03 2.37–10.68
 Middle 349 42 21 1,719 116 90 1.83 1.28–2.60
 High 153 22 13 760 73 36 1.52 0.94–2.45
Smoking status
 Smoker/former smoker 133 21 12 544 46 34 1.84 1.09–3.10
 Non-smoker 198 25 12 910 66 48 1.79 1.13–2.83
Comorbidities
 Obesity 176 28 17 698 45 62 2.52 1.57–4.04
 No obesity 187 24 12 851 70 46 1.58 0.99–2.51
 Diabetes mellitus 140 21 14 396 45 75 1.35 0.80–2.25
 No diabetes mellitus 469 60 26 2,622 161 77 2.13 1.58–2.86
 Hypertension 343 59 34 957 106 126 1.59 1.16–2.19
 No hypertension 266 22 6 2,061 100 26 1.71 1.07–2.72
 Dyslipidemia 258 44 29 874 100 100 1.53 1.07–2.17
 No dyslipidemia 351 37 11 2,144 106 52 2.15 1.47–3.13
 Ischemic heart disease 70 19 11 191 30 49 1.89 1.06–3.35
 No ischemic heart disease 539 62 29 2,827 176 103 1.88 1.41–2.52
 Stroke 27 3 2 82 7 17 1.50 0.39–5.74
 No stroke 582 78 38 2,936 199 135 2.02 1.56–2.63
 Osteoporosis 75 9 9 187 23 32 0.98 0.45–2.10
 No osteoporosis 534 72 31 2,831 183 120 2.15 1.64–2.83
Cases and controls were individually matched for age, sex, socioeconomic status, and body mass index.
Among 487 cases and 2,411 controls with an attainable follow-up period of at least 10 years, 52 patients with CS and 184 controls died (from any cause) during the 10 years that followed CS diagnosis. Eight (15.4%) patients with CS died due to malignancy, compared with 12 (6.5%) patients in the control group (P = 0.04).
During the 10-year follow-up after CS diagnosis, 27 out of 251 patients with CD (10.8%) were diagnosed with malignancy, compared to 71 (5.7%) controls. Among 200 patients with adrenal CS, 39 (19.5%) were diagnosed with cancer, compared to 79 (8.0%) controls. The 10-year risk of overall malignancy was higher in patients with CD (HR 1.92, 95% CI 1.23–3.00) and in patients with adrenal CS (HR 2.63, 95% CI 1.79–3.87), compared to controls (Supplementary Fig. S1). The number of cases for each specific cancer type in patients with CD and adrenal CS and their individually matched controls is elaborated in Supplementary Table S2.

Sensitivity analyses

Due to possible bias in individuals with a genetic predisposition to cancer, and in patients at increased risk due to prior cancer treatment, we excluded all patients with prior history of cancer (50 cases and 117 controls). Following this exclusion, patients with CS still exhibited a higher 10-year cancer risk (HR 2.12, 95% CI 1.62–2.77).
Patients with adrenal cancer diagnosed before or within 5 years of CS diagnosis were excluded from the study. However, as it is possible that adrenal cancer was either not recorded properly or unrecognized at the time of CS diagnosis, we performed an analysis of the risk of malignancy excluding all adrenal cancer cases and found no change in the 10-year risk of overall cancer (HR 1.92, 95% CI 1.48–2.50).
The diagnosis of CS patients in the study included an ICD-10 coding of the diagnosis and laboratory evidence of hypercortisolism (and test date) in all cases. However, because in many cases the diagnostic and treatment process are lengthy, there is a possibility of information bias caused by patients included in the database who were diagnosed before the time period included in the study. Therefore, we performed a sensitivity analysis excluding the first year of the study, without any change in the 10-year risk of malignancy among CS patients (HR 1.98, 95% CI 1.51–2.58).

Discussion

Patients with CS have higher morbidity and mortality (Gadelha et al. 2023Loughrey et al. 2024), and it has been recently established that CS is associated with an increased cancer risk (Rudman et al. 2024Wu et al. 2025). However, predictors of a new cancer diagnosis have not been studied. In this nationwide retrospective study, the 10-year cancer risk in 609 patients with CS was twice as high as in 3,018 matched controls. Importantly, the 10-year risk was notably higher in patients with CD (HR 1.92, 95% CI 1.23–3.00) and in those with adrenal CS (HR 2.63, 95% CI 1.79–3.87), compared to controls. Furthermore, the risk of cancer was higher in patients with CS, regardless of age and sex. On average, cancer development in patients with CS occurred at an age that was 5 years younger than that of controls who developed cancer (62.3 ± 15.0 vs 67.2 ± 12.3 years, respectively).
Our study is the first to identify predictors of new cancer diagnosis in patients with CS. A multivariate regression model showed that age ≥60 years at CS diagnosis (HR 1.75, 95% CI 1.01–2.68), male gender (HR 1.67, 95% CI 1.04–3.05), and adrenal-origin CS (HR 1.66, 95% CI 1.01–2.73) were identified as independent predictors of cancer development within 10 years. In addition, we found that patients with ≥4 CS-associated comorbidities at the time of CS diagnosis had an increased risk of cancer (HR 1.76, 95% CI 1.03–3.02; adjusted for age and sex). Interestingly, diabetes and obesity were not associated with malignancy development in patients with CS. Importantly, we found no association between UFC levels at the time of CS diagnosis and cancer development rates.
CS most commonly affects young women, a population not inherently at high risk for malignancy, with the exception of breast cancer (National Cancer Institute, Surveillance, Epidemiology, and End Results (SEER) Program, December 2024. https://seer.cancer.gov/statfacts/html/aya.html). Our study demonstrates that young patients and female patients with CS are at an increased risk of cancer, as compared with matched controls from the general population. However, within the group of patients with CS, we found age and sex disparities in malignancy risk: men and elderly patients (over 60 years of age) showed a higher cancer risk (Table 2). Advanced age is a universal risk factor for cancer (Campisi 2013), and patients with CS are no exception. Previous studies found that male patients with CS are more susceptible to metabolic derangements than female patients (Liu et al. 2015Broersen et al. 2019), a difference that likely results from gender disparity in response to glucocorticoid receptor activation (Bourke et al. 2012).
In addition, our study found that CS of adrenal origin is associated with a higher risk of malignancy, as compared with CD, after adjustment for age, sex, and significant CS-related comorbidities. Notably, patients with a history of adrenal cancer or ectopic CS were excluded. This finding is difficult to explain, since most studies have found that patients with CD present with higher UFC levels (Berr et al. 2015Rubinstein et al. 2019Schernthaner-Reiter et al. 2019) and a longer delay in diagnosis (Rubinstein et al. 2019Schernthaner-Reiter et al. 2019) compared to those with adrenal CS. One potential explanation for this observation is that adrenal adenomas may be linked to a higher incidence of malignancy, as studies have shown that cancer mortality is increased with autonomic cortisol secretion, with malignancy being the most common cause of death in patients with mild autonomous cortisol secretion (Patrova et al. 2017Deutschbein et al. 2022). Another conceivable explanation stems from previous research that reported higher rates of non-adrenal malignancies in patients with bilateral adrenal tumors and autonomous cortisol secretion (Kawate et al. 2014), suggesting a possible genetic predisposition in patients with adrenal adenoma that may contribute to the development of overall cancer.
Interestingly, in our study, patients with adrenal CS had a history of malignancy at a higher rate than their individually matched controls at the time of CS diagnosis (Table 1). In contrast, no difference in the rate of malignancy was found between patients with CD and controls. Although it is possible that a prior history of malignancy contributed to the higher risk of cancer observed in patients with adrenal CS, we did not find that a prior malignancy predicted subsequent cancer risk in this population when we analyzed our cohort of patients with adrenal CS (Table 4).
In this study, we found no association between the cumulative exposure to excess glucocorticoids (measured as UFC levels) and the development of malignancy (Fig. 2), but we did identify an association between the total number of CS-related comorbidities and cancer risk (adjusted for age and sex) (Table 2). Previous studies have similarly shown no correlation between the degree of hypercortisolism and the presence of CS-related comorbidities in patients with CS (Schernthaner-Reiter et al. 2019), including diabetes and obesity (Giordano et al. 2014Bavaresco et al. 2024). Those findings support the hypothesis that individual sensitivity to glucocorticoids varies across tissues, such that UFC levels do not always correlate with symptom burden or comorbidities. Patients who are more sensitive to excess cortisol may experience a broader range of CS-associated comorbidities. Several genetic mutations and alterations have already been identified as causes of variation in cortisol sensitivity, including the genes encoding the human glucocorticoid receptor (NR3C1) (Chrousos et al. 1982Riebold et al. 2015Laulhé et al. 2024), the chaperone protein that regulates proper folding of the glucocorticoid receptor (HSP90) (Riebold et al. 2015), and the nuclear protein that modulates glucocorticoid receptor actions (NR2C2) (Zhang et al. 2016). In addition, mutations in glucocorticoid response elements (Vandevyver et al. 2013), variations in RNA-binding to the glucocorticoid receptor (Lammer et al. 2023), and epigenetic changes (Paes et al. 2024) may also play a role in inter-individual differences in response to cortisol excess.
In the univariate model we have performed, the total number of CS-related comorbidities was associated with cancer development, and the risk of malignancy increased with the number of comorbidities. However, after adjustment for age and sex, the HR was significantly moderated (mainly due to a strong correlation between age and comorbidity) but remained graded. We find this observation to support the concept that cancer is a CS-associated comorbidity, and suggest that patients with CS (especially older men with adrenal CS) suffering from multiple disease-related comorbidities require closer follow-up and a rigorous age-adjusted cancer screening, in accordance with guidelines for the general population.
We have previously reported an increased risk of genitourinary, thyroid, and gynecological cancers in patients with CS (Rudman et al. 2024). A Taiwanese national cohort study reported that liver (27.7%), kidney (16.7%), and lung (13.0%) cancers were the most common cancers among patients with CS (Wu et al. 2025). Despite the small absolute number of cases in each cancer type in this study, we found that the incidence in patients with CS was higher across all cancer groups, except for malignant melanoma. One might think that patients with CS underwent more imaging and laboratory tests, and therefore more cases of low-risk cancers (e.g., clinically insignificant prostate or thyroid cancer) were diagnosed in patients with CS than in controls. However, as we have shown, the overall 10-year malignancy-associated mortality was twice as high in patients with CS compared to controls, indicating that malignancies in this group were clinically significant.
Surgery for CS, especially for CD, improves some but not all comorbidities (Dekkers et al. 2013Terzolo et al. 2014Papakokkinou et al. 2020Puglisi et al. 2024). Improvement of comorbidities with medical therapy have been noted in several clinical trials (Fleseriu et al. 20122022Petersenn et al. 2017); however, there are no prospectively collected data on the risk of cancer in these patients treated long-term. A retrospective study examining the course of several CS-related comorbidities showed that the risk of cancer in patients with CS who did not achieve remission was higher compared to the risk of cancer for patients in remission, yet these analyses did not reach statistical significance, partly due to the limited sample size (Papakokkinou et al. 2020).
In order to successfully identify predictors of cancer in patients with CS, this research of an uncommon outcome (malignancy) in patients with a rare disease (CS) required a long-term follow-up of a large, population-representative cohort, paired with well-matched control group. Matching for socioeconomic status is another strength of this study, as its impact on morbidity has recently been demonstrated in several studies (Ebbehoj et al. 2022Claudel & Verma 2024).
However, this study has limitations. Missing data prevented us from determining the specific CS etiology in some patients. Correct classification of all cases with an indeterminate diagnosis (as either CD or adrenal CS) would have allowed us to improve the power of subgroup analysis of patients with CD and adrenal CS; however, we had very strict criteria for determining the etiology of CS. Not all data regarding socioeconomic status, BMI, and smoking status were available. In addition, the impact of hypopituitarism and overreplacement of glucocorticoids in patients with CD could not be assessed.
Since the control group was drawn from the general population, ascertainment bias cannot be ruled out, as it is likely that patients with CS underwent more physician-initiated imaging and laboratory tests, and therefore more cases of cancer could have been diagnosed in patients with CS than in controls. However, we consider this bias to be unlikely for most cases of aggressive cancer, especially given our long follow-up period.
While this nationwide study includes a relatively large sample size, we acknowledge that it is likely that our current sample size was not sufficiently powered to detect risk predictors that are only modestly associated with malignancy risk. The small sample size of subgroups and the low frequency of the outcome in these subgroups meant we were unable to predict malignancy in patients with CD or adrenal CS, nor could we estimate the risk of specific malignancies. Moreover, we could not account for certain factors that may influence the risk of malignancy, such as family history of malignancy, duration of exposure to elevated cortisol levels, and the presence of genetic syndromes that predispose individuals to both CS and certain malignancies (e.g., multiple endocrine neoplasia type 1) (Hernández-Ramírez & Stratakis 2018). Finally, the lack of systematic prospective assessment of comorbidities is an important limitation and should raise the standards for future clinical care of these patients and collecting data in new registries. While patients receiving treatment for a particular comorbidity were successfully identified, those without treatment were not systemically recorded, which may have led to underreporting. Such is the case with osteoporosis: only patients who received treatment or whose treating physician decided to send them for a bone density scan were diagnosed, while others without such evaluations were assumed to be free of osteoporosis.
In conclusion, this large nationwide retrospective matched-cohort study found that the risk of cancer was consistently higher in patients with CS, regardless of age or sex, and on average, cancer development occurred 5 years earlier in patients with CS than in controls. The multivariate regression model we developed identified age ≥60 years at CS diagnosis, male gender, and CS of adrenal-origin as independent predictors of malignancy during the 10 years following CS diagnosis. Importantly, we found no association between UFC levels at CS diagnosis and cancer development rates. However, patients with ≥4 CS-associated comorbidities at CS diagnosis were more likely to develop cancer, after adjusting for age and sex. Given previous studies that identified overall cancer as a CS-related comorbidity and as one of the leading causes of death in this population, the results of the current study will help identify patients at high risk of malignancy, emphasize the importance of timely screening tests, in accordance with guidelines for the general population, and highlight the need for larger international cohorts to establish specific cancer screening recommendations for patients with CS.

Supplementary materials

This is linked to the online version of the paper at https://doi.org/10.1530/ERC-25-0059.

Declaration of interest

Yaron Rudman, Genady Drozdinsky, Hiba Masr-Iraqi, Tzippy Shochat, and Shiri Kushnir do not have any financial or personal relationships with other people or organizations to disclose. Maria Fleseriu has been a PI with research funding to the university from Crinetics and Sparrow and has received occasional scientific fees for scientific consulting and advisory boards from Crinetics, Recordati, Sparrow and Xeris. Ilan Shimon has been an investigator for Xeris Biopharma and has received occasional scientific fees for scientific consulting and advisory boards from Medison, CTS pharma, and Neopharm. Amit Akirov has received occasional scientific fees for scientific consulting and advisory boards from Medison, CTS pharma, and Neopharm.

Funding

This work did not receive any specific grant from any funding agency in the public, commercial or not-for-profit sector.

Data availability

The data that support the findings of this study are available from Clalit Health Services. Restrictions apply to the availability of these data, which were used under license for this study. Deidentified individual participant-level data sharing will be considered by the corresponding author of this study, with the permission of Clalit Health Services. All applicants will be asked to sign a data access agreement. All requests will be assessed as to whether data sharing is appropriate, based on the scientific rigor of the proposal.

References

Novel Cushing’s Syndrome Drug Improves Hypertension, Hyperglycemia

The investigational selective glucocorticoid receptor modulator relacorilant led to improvements in blood pressure, fasting glucose, and weight for patients with adrenal hypercortisolism, a pair of phase III studies showed.

In pooled data from the GRACE and GRADIENT trials, adults with adrenal hypercortisolism and hypertension on relacorilant had a significant decrease in systolic and diastolic blood pressure measured by 24-hour ambulatory blood pressure monitoring (-10.1 and -6.3 mm Hg, respectively) compared with placebo (1.5 and 2.2 mm Hg, respectively; both P<0.01), according to Corin Badiu, MD, PhD, of the Carol Davila University of Medicine and Pharmacy and National Institute of Endocrinology in Bucharest, Romania.

At week 22, relacorilant patients had an average blood pressure of 128/81 mm Hg compared with 135/84 mm Hg with placebo, Badiu reported at ENDO 2025, the annual meeting of the Endocrine Society.

As for those with hyperglycemia with or without hypertension at baseline, relacorilant significantly improved fasting glucose and glucose area under the curve (-0.7 and -2.4 mmol/L per hour, respectively) compared with placebo (0.4 and 1.3 mmol/L per hour, respectively; both P<0.05).

Relacorilant-treated participants also lost 4.1 kg (9 lb) compared with 1 kg (2.2 lb) in placebo patients (P<0.01).

“We expected a good hypertension control and an improved control of diabetes [with relacorilant],” Badiu told MedPage Today.

Acting as a selective cortisol modulator, relacorilant works by binding to the glucocorticoid receptor but not to other hormone receptors in the body. It was granted orphan drug designation by the FDA.

It works differently than other agents indicated for endogenous hypercortisolism (also known as Cushing’s syndrome) like the nonselective glucocorticoid receptor antagonist mifepristone (Korlym), which can be difficult to use given its drug-drug interactions and side effects like endometrial hypertrophy and vaginal bleeding.

If approved, relacorilant could be a treatment option for patients with mild autonomous hypercortisolism with resistant hypertension or difficult-to-treat diabetes who are avoiding or reluctant to surgery, or have had previous unsuccessful surgery, said Badiu.

Because metabolic issues are so prevalent in endogenous hypercortisolism, Badiu advised healthcare providers to take “an active attitude for screening for endogenous autonomous hypercortisolism in every individual patient with metabolic syndrome.”

After confirmation of an endogenous hypercortisolism diagnosis, providers should present all available treatment options from surgery to medical treatment in a personalized manner, using multidisciplinary management — cardiology, endocrinology, imaging, surgery, rheumatology, psychology, etc. — in order to make appropriate decisions, he recommended.

The GRACE and GRADIENT trials recruited participants ages 18 to 80 with endogenous hypercortisolism along with hypertension, hyperglycemia (defined as impaired glucose tolerance or diabetes), or both.

At baseline, patients given relacorilant had an average weight of 88.6 kg (195.3 lb) and waist circumference was 110.9 cm. Those with hypertension with or without hyperglycemia had average 24-hour systolic and diastolic blood pressures of 139.1 mm Hg and 86.4 mm Hg, respectively. For those with hyperglycemia with or without hypertension, average HbA1c was 6.5%, glucose area under the curve was 23.6 mmol/L per hour, and 2-hour oral glucose tolerance test was 11.8 mmol/L.

Participants on relacorilant had their dose titrated from 100 mg to 400 mg once daily based on tolerability and efficacy.

Treatment was safe and well-tolerated among patients, said Badiu, with no new emerging safety signal. Most adverse events were mild to moderate in severity.

As for adverse events of interest, there were no cases of relacorilant-induced irregular vaginal bleeding with endometrial hypertrophy or adrenal insufficiency, no events of relacorilant-induced QT prolongation, and no increases in cortisol concentrations and relacorilant-induced hypokalemia.

“Lack of hypokalemia as an adverse event was an additional positive finding,” said Badiu. “Some long-term effects on mood, sleep behavior, coagulation profile, bone metabolism, liver steatosis, and body composition are still subject to detailed analysis.”

Developer Corcept Therapeutics submitted a new drug application for relacorilant to the FDA late last year; a decision on approval is expected by the end of 2025. The drug is also currently being studied for ovarian, adrenal, and prostate cancers.

From https://www.medpagetoday.com/meetingcoverage/endo/116508


Adrenal Gland Volume Measurement Could Assist Surgery Option in Patients With Primary Pigmented Nodular Adrenocortical Disease

Abstract

Background

Primary pigmented nodular adrenocortical disease is a rare form of adrenocorticotropic hormone–independent Cushing syndrome originating from bilateral adrenal lesions. Current guidelines do not specify a recommended strategy for determining the optimal surgery. This study evaluates the concordance between bilateral adrenal gland volume and adrenal venous sampling results and the predictive value of adrenal gland volume for postoperative outcomes in patients with primary pigmented nodular adrenocortical disease.

Method

This is a retrospective study conducted at a single center. The study cohort included 10 hospitalized patients with primary pigmented nodular adrenocortical disease from 2011 to 2023. Patients underwent thin-slice adrenal computed tomography scan. An nnU-NET–based automatic segmentation model segmented the adrenal region of interest, and adrenal gland volume were computed. The ratio of left to right adrenal gland volume were also determined. All patients underwent either unilateral or bilateral adrenalectomy and received postoperative follow-up.

Results

Adrenal gland volume enlargement was asymmetrical between the 2 sides. Larger adrenal gland volumes typically corresponded to the side of dominant cortisol production as indicated by adrenal venous sampling. Clinical and biochemical remission was achieved with left adrenalectomy when left to right adrenal gland volume exceeded 1.2, and with right adrenalectomy when left to right adrenal gland volume was below 0.9. When the left to right adrenal gland volume was approximately 1, unilateral adrenalectomy proved less effective, often necessitating bilateral adrenalectomy, either simultaneously or sequentially.

Conclusion

Measuring adrenal gland volume can aid in formulating the optimal surgical approach for patients with primary pigmented nodular adrenocortical disease.

Introduction

Primary pigmented nodular adrenocortical disease (PPNAD) is an uncommon cause of adrenocorticotropic hormone (ACTH)-independent Cushing syndrome (ACS).1 Frequently, PPNAD is associated with the Carney complex (CNC), a rare multiple endocrine neoplasia syndrome characterized by distinctive pigmented lesions on skin and mucous membranes, cardiac and extracardiac myxomas, and multiple endocrine tumors.2 Approximately 45–68.6% of patients with CNC develop PPNAD. CNC is most commonly linked to mutations in the PRKAR1A gene, which follows an autosomal-dominant inheritance pattern, although approximately 25% of cases emerge sporadically from de novo mutations.1,2
The adrenal morphology in PPNAD typically includes multiple small nodules forming a “string of beads” appearance1; however, some patients exhibit atypical features such as a normal adrenal contour, unilateral large nodules, or adenomas.3, 4, 5 In cases lacking other CNC components, these atypical features increase the risk of diagnostic errors.
To date, no universally endorsed surgical strategies exist for PPNAD. Although bilateral adrenalectomy was once the standard treatment to eliminate autonomous cortisol secretion, it leads to lifelong adrenal insufficiency, necessitating continuous glucocorticoid and mineralocorticoid replacement, and poses an ongoing risk of adrenal crisis.1 Accumulating evidence suggests that unilateral adrenalectomy can diminish cortisol levels and ameliorate metabolic disturbances associated with glucocorticoid excess, with some patients experiencing temporary adrenal insufficiency.1,6 This suggests that cortisol production may not be synchronously increased in bilateral adrenals in patients with PPNAD. Selecting the dominant cortisol-producing adrenal for resection could control the metabolic effects of autonomous cortisol production while avoiding the need for lifelong hormone replacement and the risk of an adrenal crisis.
Bilateral adrenal venous sampling (AVS), typically used to identify the dominant aldosterone-secreting side in primary aldosteronism,7 also has been employed to determine the dominant cortisol-secreting side in PPNAD, thus guiding surgical decisions.8,9 However, AVS is technically demanding, involves radiation exposure, has a notable failure rate, and is costly. Moreover, there are no standardized criteria for successful AVS or for determining the dominant side in patients with PPNAD. Therefore, exploring simpler, cost-effective, and reliable criteria for surgical decision-making is crucial.
In this study, we included previously diagnosed patients with PPNAD to apply machine-learning algorithms for segmenting adrenal region of interest (ROI) and analyze the relationship between adrenal morphologic changes and clinical outcomes, thereby providing guidance for surgical planning.

Access through your organization

Check access to the full text by signing in through your organization.

Access through your organization

Section snippets

Patients and diagnoses

From December 2011 to August 2024, 321 patients with ACS were diagnosed and treated in the Department of Endocrinology and Metabolism at West China Hospital of Sichuan University. Among them, 12 patients with PPNAD were identified, and 10 of them with preoperative adrenal computed tomography (CT) imaging, comprising 2 male and 8 female patients, were included in this study. Among them, 8 patients were found to carry PRKAR1A gene mutations, as identified by next-generation sequencing of DNA

Patient clinical characteristics

The study analyzed data from 10 patients, comprising 8 women and 2 men, with a mean age of 30.5 years (range, 15–55 years). Eight patients were diagnosed with arterial hypertension, 4 exhibited impaired glucose regulation, and 2 had normal glucose levels and arterial blood pressure. Nine patients displayed typical features of Cushing syndrome, with the exception of 1 individual who presented solely with hypertension and central obesity. In addition, all female participants experienced menstrual

Discussion

This retrospective study examined the relationships among AGV, AVS, and surgical outcomes in 10 patients diagnosed with PPNAD. We observed that AGVs in patients with PPNAD were not uniformly enlarged. Variability in enlargement was noted, with some patients developing larger left adrenal lesions, others larger right adrenal lesions, and some exhibiting equivalently sized bilateral adrenal lesions. Generally, larger AGVs correlated with the dominant side of cortisol production as indicated by

Funding/Support

The study was supported by a grant from the Science &Technology Department of Sichuan Province (2023YFS0262) and a grant from the Ministry of Science and Technology of the People’s Republic of China (2022YFC2505303).

CRediT authorship contribution statement

Tao Chen: Writing – review & editing, Writing – original draft, Visualization, Validation, Software, Resources, Project administration, Methodology, Investigation, Funding acquisition, Formal analysis, Data curation, Conceptualization. Sikui Shen: Resources, Project administration, Investigation. Yeyi Tang: Resources. Wei Xie: Resources. Huaiqiang Sun: Software, Methodology, Data curation. Yuchun Zhu: Resources. Mingxi Zou: Resources. Ying Chen: Resources. Haoming Tian: Supervision. Xiaomu Li:

Conflict of Interest/Disclosure

The authors have no relevant financial disclosures.

References (18)

  • K.L. Hackman et al.

    Cushing syndrome in a young woman due to primary pigmented nodular adrenal disease

    Endocr Pract

    (2010)
  • G. Luo et al.

    An optimized two-stage cascaded deep neural network for adrenal segmentation on CT images

    Comput Biol Med

    (2021)
  • A.C. Powell et al.

    Operative management of Cushing syndrome secondary to micronodular adrenal hyperplasia

    Surgery

    (2008)
  • L. Bouys et al.

    Bilateral adrenocortical nodular disease and Cushing’s syndrome

    J Clin Endocrinol Metab

    (2024)
  • L. Bouys et al.

    Management of endocrine disease: carney complex: clinical and genetic update 20 years after the identification of the CNC1 (PRKAR1A) gene

    Eur J Endocrinol

    (2021)
  • L. Groussin et al.

    Mutations of the PRKAR1A gene in Cushing’s syndrome due to sporadic primary pigmented nodular adrenocortical disease

    J Clin Endocrinol Metab

    (2002)
  • K.M. Lowe et al.

    Cushing syndrome in carney complex: clinical, pathologic, and molecular genetic findings in the 17 affected mayo clinic patients

    Am J Surg Pathol

    (2017)
  • D. Vezzosi et al.

    Hormonal, radiological, NP-59 scintigraphy, and pathological correlations in patients with Cushing’s syndrome due to primary pigmented nodular adrenocortical disease (PPNAD)

    J Clin Endocrinol Metab

    (2015)
  • Y. Zhu et al.

    Primary pigmented nodular adrenocortical disease: report of 5 cases

    Chin Med J (Engl)

    (2006)
There are more references available in the full text version of this article.