Iatrogenic Cushing Syndrome and Adrenal Suppression Presenting as Perimenopause

JCEM Case Reports, Volume 2, Issue 11, November 2024, luae183, https://doi.org/10.1210/jcemcr/luae183

Abstract

Secondary adrenal insufficiency is a life-threatening condition that may arise in the setting of iatrogenic Cushing syndrome. Intra-articular corticosteroid injections (IACs) are a standard treatment for osteoarthritis, and they carry a high risk of secondary central adrenal suppression (SAI). We present the case of a 43-year-old woman who was referred to reproductive endocrinology for evaluation of abnormal uterine bleeding with a provisional diagnosis of perimenopause. She reported new-onset type 2 diabetes mellitus, abdominal striae, hot flashes, and irregular menses. Laboratory evaluation revealed iatrogenic Cushing syndrome and SAI attributable to prolonged use of therapeutic IACs for osteoarthritis. Treatment included hydrocortisone replacement and discontinuation of IACs followed by hydrocortisone taper over the following 16 months that resulted in the return of endogenous ovarian and adrenal function. This case demonstrates the many hazards of prolonged IAC use, including suppression of ovarian and adrenal function and iatrogenic SAI.

Introduction

Intra-articular corticosteroid injections (IACs) are commonly used for the treatment of symptomatic osteoarthritis [1]. Synovial injections carry the highest risk of secondary central adrenal suppression (SAI) [2-5]. Further, exogenous glucocorticoid administration may also result in secondary Cushing syndrome. Symptoms associated with exogenous glucocorticoid administration vary significantly, and misdiagnosis is common [67]. Here, we present a case of exogenous IAC use resulting in SAI and Cushing syndrome in a 43-year-old woman who was referred for evaluation and treatment of abnormal uterine bleeding with a provisional diagnosis of perimenopause.

Case Presentation

A 43-year-old woman with a past medical history of fibromyalgia, osteoarthritis, bursitis, asthma, gastroesophageal reflux, and diabetes was referred to reproductive endocrinology with a chief complaint of hot flashes for over 2 years and a presumptive diagnosis of perimenopause. Approximately 2 years before the onset of her symptoms, she reported irregular menses, followed by 11 months of amenorrhea, then 3 menstrual intervals with prolonged bleeding lasting 45, 34, and 65 days, respectively. She reported menarche at 11 years old, regular menstrual cycles until the last 2 years, and 4 pregnancies that were spontaneously conceived. She delivered 3 liveborn term children and had one spontaneous miscarriage. Her only complication of pregnancy was gestational hypertension during her last pregnancy that occurred 9 years prior when she was 34 years old.

In addition to menstrual irregularity, she also reported hot flashes, increasing truncal weight gain over the last 5 years, new-onset diabetes mellitus, and hypertension. Eighteen months prior to referral, she had an endometrial biopsy, which demonstrated secretory endometrium without hyperplasia, and cervical cancer screening was negative.

She initially reported the following medications: inhaled fluticasone/propionate + salmeterol 232 mcg + 14 mcg as needed and albuterol 108 mcg as needed. Her daily medications were glimepiride 1 mg, furosemide 20 mg, omeprazole 20 mg, montelukast 10 mg, azelastine hydrochloride 137 mcg, ertugliflozin 5 mg, and tiotropium bromide 2.5 mg. Importantly, she did not report IAC treatments.

Diagnostic Assessment

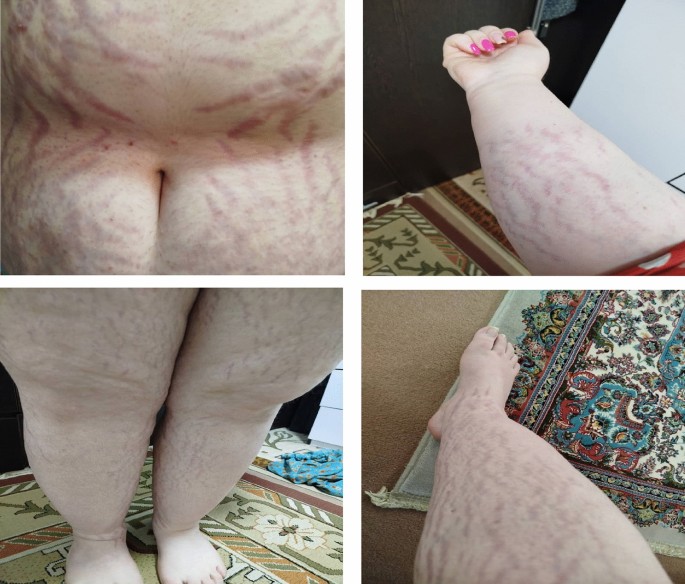
Initial physical examination showed height of 160 cm, weight of 103.4 kg, body mass index (BMI) of 46 kg/m2, and blood pressure (BP) of 128/80. Physical exam was significant for round facies with plethora, bilateral dorsocervical neck fat pads, and violaceous striae on her abdomen and upper arms (Fig. 1). The patient ambulated with a cane and reported severe bilateral proximal leg atrophy and weakness.


Abdominal and upper extremity striae prior to treatment with truncal obesity immediately before (A) and 1 year after initial diagnosis (B).

Figure 1.

Abdominal and upper extremity striae prior to treatment with truncal obesity immediately before (A) and 1 year after initial diagnosis (B).

A laboratory evaluation was recommended but was not initially completed. She was scheduled for a transvaginal ultrasound that required prior authorization; the pelvic ultrasound showed a heterogeneous and thickened anterior uterine wall, suggestive of adenomyosis, with a posterior intramural fibroid measuring 15 × 15 mm and an anterior intramural fibroid measuring 15 × 8 mm. Endometrial lining was thin at 5 mm. Both ovaries were small, without masses or antral follicles. Three-dimensional reconstruction showed a normal uterine cavity with some heterogeneity of the endometrial lining but no discrete masses suggestive of polyps or intracavitary fibroids as the cause of irregular bleeding. Upon additional questioning, she acknowledged receiving bilateral shoulder, hip, and knee injections of triamcinolone 80 mg every 2 to 3 months to each joint for about 5 years. Table 1 shows the initial laboratory evaluation and includes age-appropriate low ovarian reserve as evidenced by anti-Müllerian hormone (AMH), secondary hypothalamic hypogonadism, diabetes mellitus, and central adrenal suppression. Of note, the diabetes mellitus developed after 3 years of IAC use. Additional diagnostic assessment for adrenal insufficiency by synacthen testing was scheduled, however, the patient declined further investigation.

Initial laboratory values at presentation

Result Reference range
Basic metabolic panel
 Sodium 141 mEq/L; 141 mmol/L 135 to 145 mEq/L; 135 to 145 mmol/L
 Potassium 3.7 mEq/L; 3.7 mmol/L 3.7 to 5.2 mEq/L; 3.7 to 5.20 mmol/L
 Chloride 104 mEq/L; 104 mmol/L 96 to 106 mEq/L; 96 to 106 mmol/L
 Carbon dioxide 25 mEq/L; 25 mmol/L 23 to 29 mEq/L; 23 to 29 mmol/L
 Creatinine 0.42 mg/dL; 37.14 µmol/L 0.6 to 1.3 mg/dL; 53 to 114.9 µmol/L
 Urea nitrogen 14 mg/dL; 5 mmol/L 6 to 20 mg/dL; 2.14 to 7.14 mmol/L
Adrenal function
 Cortisol 0.8 µg/dL; 22.07 nmol/L 4-22 µg/dL; 138-635 nmol/L
 ACTH <5 pg/mL; <1 pmol/L 6-50 pg/mL; 5.5-22 pmol/L
 DHEAS 8 mcg/dL; 0.02 µmol/L 15-205 mcg/dL; 1.36-6.78 µmol/L
Endocrine function
 HbA1c 8.5% <5.7%
 Random glucose 124 mg/dL; 6.9 mmol/L 80-100 mg/dL; 4.4-5.5 mmol/L
 TSH 1.74 mIU/L 0.5-5 mIU/L
 tT4 10.5 µg/dL; 135.2 nmol/L 5.0-12.0 µg/dL; 57-148 nmol/L
 Free T4 index 2.6 ng/dL; 33.4 pmol/L 0.7-1.9 ng/dL; 12-30 pmol/L
 tT3 165 ng/dL; 2.5 nmol/L 60-180 ng/dL; 0.9-2.8 nmol/L
 TPO antibody Negative n/a
Ovarian function
 FSH 5.6 IU/L 4.5-21.5 IU/L
 LH 2.9 IU/L 5-25 IU/L
 Progesterone <0.5 ng/mL; 1.6 nmol/L Varies
 Estradiol 21 pg/mL; 77.1 pmol/L Varies
 AMH 1.1 ng/mL; 7.9 pmol/L 1.0-3.0 ng/mL; 2.15-48.91 pmol/L

Abbreviations: ACTH, adrenocorticotropic hormone; AMH, anti-Müllerian hormone; DHEAS, dehydroepiandrosterone sulfate; eGFR, estimated glomerular filtration rate; FSH, follicle-stimulating hormone; HbA1c, hemoglobin A1C; LH, luteinizing hormone; TPO antibody, thyroid peroxidase antibody; TSH, thyroid stimulating hormone; tT4, total thyroxine.

Treatment

The patient was immediately started on hydrocortisone 10 mg twice daily for glucocorticoid replacement, which was gradually reduced to 5 mg daily each morning at 16 months. Endocrine function testing was trended over the following months as replacement cortisone therapy was tapered.

Outcome and Follow-Up

Within 6 months of replacement and cessation of IACs, hot flashes ceased, and she reported regular menses. She lost 6.8 kg, her truncal obesity and striae significantly improved (Fig. 1), and she could now ambulate without assistance. Her glycated hemoglobin (HbA1c) level decreased from 8.5% to 6.8%. Fourteen months after her initial diagnosis and cessation of IAC, laboratory studies demonstrated partial recovery of adrenal and ovarian function and improved metabolism, as evidenced by increases in morning cortisol, adrenocorticotropic hormone (ACTH), and dehydroepiandrosterone sulfate (DHEAS), and decreased HbA1c. At 16 months, she had a return of ovulatory ovarian function.

Discussion

Cortisol is the main glucocorticoid secreted by human adrenal glands. The secretion pattern is precisely regulated by an integrated limbic-hypothalamic-pituitary (LHP) drive with the physiologic goal of homeostasis [1]. Conditions that result in deviations in glucocorticoid concentrations carry a variety of consequences. Our patient was referred because of a provisional diagnosis of abnormal uterine bleeding and perimenopause, which distracted from recognition of iatrogenic Cushing syndrome and secondary central adrenal suppression. This patient vignette underscores the importance of explicitly asking patients about nonoral medications, as patients may not report their use.

Exogenous administration of long-acting synthetic glucocorticoids may suppress adrenal function via negative feedback at the limbic and hypothalamic levels, which was reflected in this patient by undetectable ACTH and low cortisol levels (Table 1). In addition, excess glucocorticoid levels result in other neuroendocrine concomitants, including suppression of gonadotropin-releasing hormone (GnRH) drive that results in hypothalamic hypogonadism [89], decreased luteinizing hormone (LH) and follicle-stimulating hormone (FSH) levels, and anovulation despite AMH levels indicating residual ovarian reserve [10]. The clinical phenotype is variable and reflects individual glucocorticoid receptor sensitivities [9].

Regardless of cause, Cushing syndrome often presents with hallmark features of central obesity, violaceous striae, easy bruising, round facies, and nuchal adiposity with lower limb muscle atrophy and loss of strength [11]. Additionally, glucocorticoid excess causes insulin resistance and metabolic syndrome [8]. Truncal obesity is a common presenting symptom of excess cortisol. Cortisol inhibits metabolic response to insulin centrally and peripherally and increases gluconeogenesis, which together predispose to and cause diabetes [10].

Exogenous use of injectable glucocorticoids carries the highest risk of adrenal suppression when compared to other routes of exogenous steroids [5]. Patients typically report fatigue, malaise, and gastrointestinal complaints. Oligomenorrhea is a common presenting complaint in women, as was the case in our patient. Hyponatremia, water retention, and hypotension may occur in SAI because of endogenous glucocorticoid deficiency. A thorough laboratory evaluation in this patient revealed low LH, FSH, estradiol, and progesterone levels, indicating hypothalamic hypogonadism and not perimenopause/menopause [12] and low levels of cortisol, ACTH, and DHEAS confirmed SIA [10].

Adrenal insufficiency can be a life-threatening condition that requires supplementation with glucocorticoids [101314]. A review of patients diagnosed with SAI suggested tapering of hydrocortisone before discontinuing all replacement therapy and revealed most patients recover without the need for exogenous steroids after 2 years from diagnosis [14]. ACTH stimulation testing may indicate the return of adrenal function [1415]. Our patient showed increased ACTH, cortisol, and DHEAS at 14 months. Ovulatory ovarian function, indicated by progesterone < 5 ng/mL (< 1.59 nmol/L) (Table 2), returned at 16 months after cessation of IACs. The improvement in adrenal and ovarian function following cessation of IACs and tapering of hydrocortisone replacement therapy was accompanied by decreased HbA1c, weight loss, truncal obesity, and stria, and increased muscle strength scalp hair.


Table 2.

Endocrine lab results 7 years prior, at presentation (T0), and over the next 16 months

Analyte Reference range 7 years prior T0 1 month 7 months 13 months 14 months 16 months
DHEAS 15-205 µg/dL; 1.36-6.78 nmol/L 8 µg/dL; 0.22 nmol/L 5 µg/dL;
0.14 nmol/L
6 µg/dL;
0.16 nmol/L
22 µg/dL; 0.59 nmol/L 28 µg/dL; 0.76 nmol/L 24 µg/dL; 0.65 nmol/L
Cortisol 4-22 µg/dL; 138-635 nmol/L 0.9 µg/dL;
24.83 nmol/L
5.8 µg/dL;
160.01 nmol/L
3.0 µg/dL;
82.76 nmol/L
3.9 µg/dL;
107.59 nmol/L
11.2 µg/dL;
308.99 nmol/L
12.6 µg/dL;
347.61 nmol/L
ACTH 6-50 pg/mL; 5.5-22 pmol/L <5 pg/mL;<1.10 pmol/L <5 pg/mL;<1.10 pmol/L <5 pg/mL;<1.10 pmol/L <5 pg/mL;<1.10 pmol/L 11 pg/mL;
2.42 pmol/L
10 pg/mL;
2.20 pmol/L
HbA1c <5.7% 5.0% 8.5% 8.5% 7.8% 5.8% 5.7% 5.7%
LH 5-25 IU/L 5.8 IU/L 2.9 IU/L 3.3 IU/L 5.2 IU/L 5.7 IU/L
FSH 4.5-21.5 IU/L 6.2 IU/L 5.6 IU/L 2.0 IU/L 3.5 IU/L 1.3 IU/L
Estradiol Varies 21 pg/mL;
77.09 pmol/L
74 pg/mL;
271.65 pmol/L
101 pg/mL;
370.77 pmol/L
121 pg/mL;
444.19 pmol/L
Progesterone Varies <0.5 ng/mL;<1.59 nmol/L <0.5 ng/mL;<1.59 nmol/L <0.5 ng/mL;<1.59 nmol/L 6.6 ng/mL;
20.99 nmol/L

Abbreviations: ACTH, adrenocorticotropic hormone, DHEAS, dehydroepiandrosterone sulfate, FSH, follicle-stimulating hormone, LH, luteinizing hormone, T0, time at presentation.

In conclusion, exogenous glucocorticoids, specifically intra-articular injections, carry the highest potential for iatrogenic Cushing syndrome and secondary adrenal insufficiency. Glucocorticoid excess has a variable presentation that often obscures diagnosis. As this scenario demonstrates, careful physical and laboratory assessment and tapering of hydrocortisone replacement eventually can lead to restoration of adrenal, ovarian, and metabolic function and improved associated symptoms.

Learning Points

  • Exogenous intra-articular glucocorticoid use may suppress adrenal and ovarian function via central suppression of ACTH and GnRH.
  • Cushing syndrome presents with a broad spectrum of signs and symptoms that may be mistaken for individual conditions, such as perimenopause and isolated diabetes mellitus.
  • Exogenous steroid use may lead to Cushing syndrome and subsequent adrenal insufficiency, which is life-threatening.
  • Treatment of adrenal insufficiency with a long-term exogenous glucocorticoid taper allows for subsequent return of adrenal and ovarian function.

Contributors

All authors contributed to authorship. S.L.B. was involved in the diagnosis and management of the patient, and manuscript editing. S.A. was involved in patient follow-up and manuscript development. J.M.G. was responsible for manuscript development and editing. All authors reviewed and approved the final draft.

Funding

None declared.

Disclosures

S.L.B. reports ClearBlue Medical Advisory Board, 2019—present

Emblem Medical Advisory Board, Amazon Services, 2022—present

Medscape, 2023

Myovant, May 2023

Omnicuris, 2023

Sage Therapeutics and Biogen Global Medical, Zuranolone OB/GYN Providers Advisory Board, Dec 2022, March 2023

Member, Board of Trustees, Salem Academy and College, Salem, NC: 2018-present (Gratis)

Informed Patient Consent for Publication

Signed informed consent obtained directly from the patient.

Data Availability Statement

Originally data generated and analyzed in this case are reported and included in this article.

References

1

Johnston
PC

,

Lansang
MC

,

Chatterjee
S

,

Kennedy
L

.

Intra-articular glucocorticoid injections and their effect on hypothalamic-pituitary-adrenal (HPA)-axis function

.

Endocrine

.

2015

;

48

(

2

):

410

416

.

2

Stout
A

,

Friedly
J

,

Standaert
CJ

.

Systemic absorption and side effects of locally injected glucocorticoids

.

PM R

.

2019

;

11

(

4

):

409

419

.

3

Prete
A

,

Bancos
I

.

Glucocorticoid induced adrenal insufficiency

.

BMJ

.

2021

;

374

:

n1380

.

4

Herman
JP

,

McKlveen
JM

,

Ghosal
S

, et al.

Regulation of the hypothalamic-pituitary-adrenocortical stress response

.

Compr Physiol

.

2016

;

6

(

2

):

603

621

.

5

Broersen
LH

,

Pereira
AM

,

Jørgensen
JO

,

Dekkers
OM

.

Adrenal insufficiency in corticosteroids use: systematic review and meta-analysis

.

J Clin Endocrinol Metab

.

2015

;

100

(

6

):

2171

2180

.

6

Tan
JW

,

Majumdar
SK

.

Development and resolution of secondary adrenal insufficiency after an intra-articular steroid injection

.

Case Rep Endocrinol

.

2022

;

2022

:

4798466

.

7

Colpitts
L

,

Murray
TB

,

Tahhan
SG

,

Boggs
JP

.

Iatrogenic cushing syndrome in a 47-year-old HIV-positive woman on ritonavir and inhaled budesonide

.

J Int Assoc Provid AIDS Care

.

2017

;

16

(

6

):

531

534

.

8

Lee
SM

,

Hahm
JR

,

Jung
TS

, et al.

A case of Cushing’s syndrome presenting as endometrial hyperplasia

.

Korean J Intern Med

.

2008

;

23

(

1

):

49

52

.

9

Yesiladali
M

,

Yazici
MGK

,

Attar
E

,

Kelestimur
F

.

Differentiating polycystic ovary syndrome from adrenal disorders

.

Diagnostics (Basel)

.

2022

;

12

(

9

):

2045

.

10

Raff
H

,

Sharma
ST

,

Nieman
LK

.

Physiological basis for the etiology, diagnosis, and treatment of adrenal disorders: Cushing’s syndrome, adrenal insufficiency, and congenital adrenal hyperplasia

.

Compr Physiol

.

2014

;

4

(

2

):

739

769

.

11

Unuane
D

,

Tournaye
H

,

Velkeniers
B

,

Poppe
K

.

Endocrine disorders & female infertility

.

Best Pract Res Clin Endocrinol Metab

.

2011

;

25

(

6

):

861

873

.

12

Peacock
K

,

Carlson
K

,

Ketvertis
KM.

Menopause.

StatPearls

.

StatPearls Publishing, Copyright © 2024, StatPearls Publishing LLC.

,

2024

.

13

Foisy
MM

,

Yakiwchuk
EM

,

Chiu
I

,

Singh
AE

.

Adrenal suppression and Cushing’s syndrome secondary to an interaction between ritonavir and fluticasone: a review of the literature

.

HIV Med

.

2008

;

9

(

6

):

389

396

.

14

Draoui
N

,

Alla
A

,

Derkaoui
N

, et al.

Assessing recovery of adrenal function in glucocorticoid-treated patients: our strategy for screening and management

.

Ann Med Surg (Lond)

.

2022

;

78

:

103710

.

15

Joseph
RM

,

Hunter
AL

,

Ray
DW

,

Dixon
WG

.

Systemic glucocorticoid therapy and adrenal insufficiency in adults: a systematic review

.

Semin Arthritis Rheum

.

2016

;

46

(

1

):

133

141

.

Abbreviations


  • ACTH

    adrenocorticotropic hormone

  • AMH

    anti-Müllerian hormone

  • DHEAS

    dehydroepiandrosterone sulfate

  • FSH

    follicle-stimulating hormone

  • HbA1c

    glycated hemoglobin

  • IAC

    intra-articular corticosteroid

  • LH

    luteinizing hormone

  • SAI

    secondary central adrenal suppression

Published by Oxford University Press on behalf of the Endocrine Society 2024.
This work is written by (a) US Government employee(s) and is in the public domain in the US. See the journal About page for additional terms.

Insights on Diagnosing and Managing Cushing’s Syndrome

Cushing’s syndrome, or endogenous hypercortisolemia, is a rare condition that both general practice clinicians and endocrinologists should be prepared to diagnose and treat. Including both the pituitary and adrenal forms of the disease, the Endocrine Society estimates that the disorder affects 10 to 15 people per million every year in the United States. It is more common in women and occurs most often in people between the ages of 20 and 50.

Even though Cushing’s remains a rare disease, cortisol recently made waves at the American Diabetes Association 84th Scientific Session. A highlight of the meeting was the initial presentation of data from the CATALYST trial, which assessed the prevalence of hypercortisolism in patients with difficult-to-control type 2 diabetes (A1c 7.5+).

CATALYST is a prospective, Phase 4 study with two parts. In the prevalence phase, 24% of 1,055 enrolled patients had hypercortisolism, defined as an overnight dexamethasone suppression test (ODST) value greater than 1.8 µg/dL and dexamethasone levels greater than 140 µg/dL. Results of CATALYST’s randomized treatment phase are expected in late 2024.

Elena Christofides, MD, FACE, founder of Endocrinology Associates, Inc., in Columbus, OH, believes the CATALYST results will be a wake-up call for both physicians and patients seeking to advocate for their own health. “This means that nearly 1 in 4 patients with type 2 diabetes have some other underlying hormonal/endocrine dysfunction as the reason for their diabetes, or significant contribution to their diabetes, and they should all be screened,” she said. “All providers need to get comfortable with diagnosing and treating hypercortisolemia, and you need to do it quickly because patients are going to pay attention as well.”

In Dr. Christofides’ experience, patients who suspect they have a hormonal issue may start with their primary care provider or they may self-refer to an endocrinologist. “A lot of Cushing’s patients are getting diagnosed and treated in primary care, which is completely appropriate. But I’ve also met endocrinologists who are uncomfortable diagnosing and managing Cushing’s because it is so rare,” she said. “The important thing is that the physician is comfortable with Cushing’s or is willing to put in the work get comfortable with it.”

According to Dr. Christofides, the widespread popular belief that “adrenal fatigue” is causing millions of Americans to feel sick, tired, and debilitated may be creating barriers to care for people who may actually have Cushing’s. “As physicians, we know that adrenal fatigue doesn’t exist, but we should still be receptive to seeing patients who raise that as a concern,” said Dr. Christofides. “We need to acknowledsalige their lived experience as being very real and it can be any number of diseases causing very real symptoms. If we don’t see these patients, real cases of hypercortisolemia could be left undiagnosed and untreated.”

Dr. Christofides, who also serves as a MedCentral Editor-at-Large, said she reminds colleagues that overnight dexamethasone suppression test (ODST) should always be the first test when you suspect Cushing’s. “While technically a screening test, the ODST can almost be considered diagnostic, depending on how abnormal the result is,” she noted. “But I always recommend that you do the ODST, the ACTH, a.m. cortisol, and the DHEAS levels at the same time because it allows you to differentiate more quickly between pituitary and adrenal problems.”

Dr. Christofides does see a place for 24-hour urine collection and salivary cortisol testing at times when diagnosing and monitoring patients with Cushing’s. “The 24-hour urine is only positive in ACTH-driven Cushing’s, so an abnormal result can help you identify the source, but too many physicians erroneously believe you can’t have Cushing’s if the 24-hour urine is normal,” she explained. “Surgeons tend to want this test before they operate and it’s a good benchmark for resolution of pituitary disease.” She reserves salivary cortisol testing for cases when the patient’s ODST is negative, but she suspects Cushing’s may be either nascent or cyclical.

Surgical resection has long been considered first-line treatment in both the pituitary and adrenal forms of Cushing’s. For example, data shared from Massachusetts General Hospital showed that nearly 90% of patients with microadenomas did not relapse within a 30-year period. A recent study found an overall recurrence rate of about 25% within a 10-year period. When reoperation is necessary, remission is achieved in up to 80% of patients.

As new medications for Cushing’s syndrome have become available, Dr. Christofides said she favors medical intervention prior to surgery. “The best part about medical therapy is you can easily stop it if you’re wrong,” she noted. “I would argue that every patient with confirmed Cushing’s deserves nonsurgical medical management prior to a consideration of surgery to improve their comorbidities and surgical risk management, and give time to have a proper informed consent discussion.”

In general, medications to treat Cushing’s disease rely on either cortisol production blockade or receptor blockade, said Dr. Christofides. Medications that directly limit cortisol production include ketoconazoleosilodrostat (Isturisa), mitotane (Lysodren), levoketoconazole (Recorlev), and metyrapone (Metopirone). Mifepristone (Korlym, Mifeprex) is approved for people with Cushing’s who also have type 2 diabetes to block the effects of cortisol. Mifepristone does not lower the amount of cortisol the body makes but limits its effects. Pasireotide (Signifor) lowers the amount of ACTH from the tumor. Cabergoline is sometimes used off-label in the US for the same purpose.

Following surgery, people with Cushing’s need replacement steroids until their adrenal function resumes, when replacement steroids must be tapered. But Dr. Christofides said she believes that all physicians who prescribe steroids should have a clear understanding of when and how to taper patients off steroids.

“Steroid dosing for therapeutic purposes is cumulative in terms of body exposure and the risk of needing to taper. A single 2-week dose of steroids in a year does not require a taper,” she said. “It’s patients who are getting repeated doses of more than 10 mg of prednisone equivalent per day for 2 or more weeks multiple times per year who are at risk of adrenal failure without tapering.”

Physicians often underestimate how long a safe, comfortable taper can take, per Dr. Christofides. “It takes 6 to 9 months for the adrenals to wake up so if you’re using high-dose steroids more frequently, that will cause the patient to need more steroids more frequently,” she explained. “If you’re treating an illness that responds to steroids and you stop them without tapering, the patient’s disease will flare, and then a month from then to 6 weeks from then you’ll be giving them steroids again, engendering a dependence on steroids by doing so.”

When developing a steroid taper plan for postoperative individuals with Cushing’s (and others), Dr. Christofides suggests basing it on the fact that 5 mg of prednisone or its equivalent is the physiologic dose. “Reduce the dose by 5 mg per month until you get to the last 5 mg, and then you’re going to reduce it by 1 mg monthly until done,” she said. “If a patient has difficulty during that last phase, consider a switch to hydrocortisone because a 1 mg reduction of hydrocortisone at a time may be easier to tolerate.”

Prednisone, hydrocortisone, and the other steroids have different half-lives, so you’ll need to plan accordingly, adds Dr. Christofides. “If you do a slower taper using hydrocortisone, the patient might feel worse than with prednisone unless you prescribe it BID.” She suggests thinking of the daily prednisone equivalent of hydrocortisone as 30 mg to allow for divided dosing, rather than the straight 20 mg/day conversion often used.

What happens after a patient’s Cushing’s has been successfully treated? Cushing’s is a chronic disease, even in remission, Dr. Christofides emphasized. “Once you have achieved remission, my general follow-up is to schedule visits every 6 months to a year with scans and labs, always with the instruction if the patient feels symptomatic, they should come in sooner,” she said.

More on Cushing’s diagnosis and therapies.

https://www.medcentral.com/endocrinology/cushings-syndrome-a-clinical-update

Whole Blood Transcriptomic Signature of Cushing’s Syndrome

Abstract

Objective

Cushing’s syndrome is characterized by high morbidity and mortality with high interindividual variability. Easily measurable biomarkers, in addition to the hormone assays currently used for diagnosis, could reflect the individual biological impact of glucocorticoids. The aim of this study is to identify such biomarkers through the analysis of whole blood transcriptome.

Design

Whole blood transcriptome was evaluated in 57 samples from patients with overt Cushing’s syndrome, mild Cushing’s syndrome, eucortisolism, and adrenal insufficiency. Samples were randomly split into a training cohort to set up a Cushing’s transcriptomic signature and a validation cohort to assess this signature.

Methods

Total RNA was obtained from whole blood samples and sequenced on a NovaSeq 6000 System (Illumina). Both unsupervised (principal component analysis) and supervised (Limma) methods were used to explore the transcriptome profile. Ridge regression was used to build a Cushing’s transcriptome predictor.

Results

The transcriptomic profile discriminated samples with overt Cushing’s syndrome. Genes mostly associated with overt Cushing’s syndrome were enriched in pathways related to immunity, particularly neutrophil activation. A prediction model of 1500 genes built on the training cohort demonstrated its discriminating value in the validation cohort (accuracy .82) and remained significant in a multivariate model including the neutrophil proportion (P = .002). Expression of FKBP5, a single gene both overexpressed in Cushing’s syndrome and implied in the glucocorticoid receptor signaling, could also predict Cushing’s syndrome (accuracy .76).

Conclusions

Whole blood transcriptome reflects the circulating levels of glucocorticoids. FKBP5 expression could be a nonhormonal marker of Cushing’s syndrome.

Significance

In Cushing’s syndrome, specific hormone assays inform about the level of deviation from normal range. The blood transcriptome signature proposed here is also able to discriminate patients, without any hormone measurements. This direct measurement of the biological impact of glucocorticoids at a tissue level may better reflect the individual consequences of glucocorticoid excess.

Introduction

Cushing’s syndrome (CS) is a condition characterized by chronic cortisol excess related to glucocorticoid treatment (exogenous Cushing’s syndrome) or to endogenous hypercortisolism. The excessive cortisol secretion may be due to either adrenocorticotropic hormone (ACTH)–dependent conditions, most often an ACTH-producing pituitary adenoma (Cushing’s disease), or ACTH-independent causes, commonly a benign adrenal adenoma.1 Chronic exposure to glucocorticoid excess results in specific complications, including cardiovascular and thromboembolic diseases, diabetes mellitus, metabolic syndrome, osteoporosis, and neurocognitive disorders. Numerous comorbidities result in impaired quality of life and increased mortality.2-4

Despite the availability of different hormonal tests for diagnosis and follow-up, the clinical management of these patients remains challenging, since none of the available tools proved to be fully accurate due to the variable pattern of cortisol secretion and the pitfalls of the hormonal immunoassays.5,6 Moreover, the clinical effects of glucocorticoid exposure on peripheral tissues depend not only on the intensity and duration of glucocorticoid excess but also on the peripheral glucocorticoid metabolism and the individual sensitivity to glucocorticoids, not accurately estimated by hormonal parameters. This results in the high interindividual variability frequently reported in Cushing’s syndrome.7,8 Recent studies suggested that the combined assessment of cortisol secretion, cortisone-to-cortisol peripheral activation by the 11β-hydroxysteroid dehydrogenase enzyme, and glucocorticoid receptor sensitizing variants may better estimate the risk to develop each type of complications.9-11

These aspects are crucial mainly for the management of patients with mild Cushing’s syndrome, not clearly characterized by classical features of cortisol excess but consistently associated to an increased risk of morbidities and mortality.12,13 Mild hypercortisolism can occur in different settings. In patients with adrenal incidentalomas, mild hypercortisolism is currently referred to as mild autonomous cortisol secretion (MACS).14 In patients with Cushing’s disease, mild hypercortisolism occurs when hypercortisolism persists/recurs after pituitary surgery or under medical treatment.12,15,16 Irrespective of the origin of cortisol excess, it is still debated whether patients with mild hypercortisolism, as well as those under low-dose systemic or local glucocorticoid therapy, need a close follow-up for cortisol excess–related complications and specific preventive treatments.17-19

In this context, genomic-based studies have recently focused on the identification of blood molecular markers in patients exposed to glucocorticoid excess, aiming to a better individual characterization of these patients. Particularly, DNA methylation profile has been investigated as a potential biological hallmark of glucocorticoid action. Previous studies suggested an association between hypothalamic–pituitary–adrenal axis dysregulation and specific blood DNA methylation profiles, particularly in post-traumatic stress disorders, while recently a dynamic whole blood DNA methylation signature reflecting glucocorticoid excess has been identified.20-22 In both genomic-based and preclinical studies, FKBP5, a gene implicated in glucocorticoid signaling, emerged as potential non hormonal marker of glucocorticoid excess.22-24

The present study completes the previous approaches exploring the impact of glucocorticoids on whole blood transcriptome to better understand the molecular mechanisms of glucocorticoid impregnation. Specifically, through the analysis of whole blood transcriptome profiles from patients with endogenous Cushing’s syndrome, eucortisolism, or adrenal insufficiency, we proposed a transcriptome signature predicting glucocorticoid excess.

Materials and methods

Patients and samples

Fifty-seven blood samples were collected from 43 patients with a confirmed diagnosis of endogenous Cushing’s syndrome, followed in Cochin Hospital (APHP, Paris, France). Diagnostic criteria of Cushing’s syndrome included increased 24-h urinary free cortisol, abnormal cortisol after 1 mg dexamethasone suppression, and altered circadian cortisol rhythm, following consensus guidelines.25

For 14 patients, blood samples were collected before correction of Cushing’s syndrome and at least 3 months after Cushing’s syndrome treatment. At the time of blood sampling, patients were classified as overt Cushing’s syndrome, mild Cushing’s syndrome, eucortisolism, or adrenal insufficiency, depending on clinical and hormonal evaluation. Briefly, overt Cushing’s syndrome patients presented clinical signs and increased 24-h urinary free cortisol (>240 nmol/24 h), increased midnight salivary cortisol (>6 nmol/L), and insufficient cortisol suppression after 1 mg dexamethasone (>50 nmol/L). The mild Cushing’s syndrome cohort included patients with mild hypercortisolism due to either Cushing’s disease or benign adrenal Cushing’s syndrome. The former were patients with persistent or recurrent hypercortisolism after pituitary surgery or during medical treatment; in these patients, the diagnosis of Cushing’s disease was confirmed by the histopathological report consistent with a corticotroph adenoma in the surgically treated patients (6 out of 7) and by the magnetic resonance imaging evidence of a pituitary adenoma in the upfront medically treated patient. Mild hypercortisolism in patients with Cushing’s disease was defined, as previously reported,16,26 by the absence of clinically overt signs of CS and a slight alteration in cortisol secretion, including either increased 24-h urinary free cortisol or increased midnight cortisol or inadequate cortisol suppression after 1 mg of dexamethasone. For mild hypercortisolism due to benign adrenal CS, MACS criteria were used—post-dexamethasone serum cortisol concentration above 50 nmol/L—following recent consensus guidelines.14 The term “mild” was retained for 1 patient with benign adrenal CS who had a borderline dexamethasone suppression test (48 nmol/L) but increased 24-h urinary free cortisol. Eucortisolism was defined as a combination of normalized 24-h urinary free cortisol and of restored cortisol circadian rhythm after either surgery or medical treatment. Adrenal insufficiency was secondary to pituitary surgery for Cushing’s disease. The diagnosis was based on low morning plasma cortisol (<160 nmol/L) and confirmed by the insufficient response to 250 µg corticotropin stimulation test (<500 nmol/L), following the current consensus guidelines.27,28 Detailed hormone values for each sample are provided in Table S1.

Thirty additional samples were collected from patients followed in Hôpital Européen Georges Pompidou Hospital (APHP, Paris, France). These patients presented pheochromocytoma (n = 19) and primary hyperaldosteronism (n = 11; Table S1). The diagnosis was made following the consensus guidelines.29,30

The study was conducted in accordance with the Declaration of Helsinki. Signed informed consent for molecular analysis of blood samples and for access to clinical data was obtained from all patients, and the study was approved by the institutional review board (Comité de Protection de Personnes Ile de France 1, projects 13495 and 13311).

RNA collection and extraction

Whole blood samples were collected into PAXgene Blood RNA Tube (PreAnalytiX, Hombrechtikon, Switzerland), following the manufacturer’s instructions. Total RNA was extracted by using PAXgene Blood RNA Kit, v2 (Qiagen, Hilden, Germany), following the manufacturer’s instructions.

Transcriptome data generation

After RNA extraction, RNA concentrations were obtained using nanodrop or a fluorometric Qubit RNA assay (Life Technologies, Grand Island, NY, USA). The quality of the RNA (RNA integrity number, RIN) was determined on the Agilent 2100 Bioanalyzer (Agilent Technologies, Palo Alto, CA, USA) following manufacturer’s instructions.

To construct the libraries, 250 ng of high-quality total RNA sample (RIN > 8) was processed using the Stranded mRNA Prep kit (Illumina, San Diego, CA, USA) according to the manufacturer’s instructions. Briefly, after purification of poly-A–containing mRNA molecules, mRNA molecules were fragmented and reverse-transcribed using random primers. Replacement of dTTP (deoxythymidine triphosphate) by dUTP (deoxyuridine triphosphate) during the second-strand synthesis permitted to achieve the strand specificity. Addition of a single A base to the cDNA was followed by ligation of Illumina adapters. Libraries were quantified on a Qubit fluorometer (Thermo Fisher Scientific, Waltham, MA, USA), and profiles were assessed using the DNA High Sensitivity LabChip kit on an Agilent Bioanalyzer (Agilent Technologies). Libraries were sequenced on a NovaSeq 6000 System (Illumina), using 51 base-lengths read in a paired-end mode.

Whole blood methylome data

Among the 57 samples included in the transcriptome analysis, 32 were also used for a methylome analysis recently published.22 For each gene, potentially methylated cytosines-referred to as CpGs- in the promoter regions were defined as CpGs belonging to the TSS1500, TSS200, 5′UTR, and first exon regions. CpG methylation levels were analyzed using M-values generated as previously reported.22

Bioinformatics and statistics

Quality control was performed on raw count matrix, with a target of >5 million reads per sample. All samples passed this control. Illumina adapters were removed using Trimmomatic (v0.39) in paired-end mode.31 Reads were aligned to the reference human genome (GRCh37) and counted using STAR (v2.7.9a).32 Counts were aggregated for transcripts corresponding to the same gene, and only genes with a count sum > 0 in all samples were further considered. Globin genes and sex-related genes were also discarded, as previously published.33

Counts were normalized with DESeq2, using rlog transformation34 (v.1.24.0): raw counts were converted to distributed data structures (dds), and lowly expressed genes were removed using a dds > 1 in at least 3 samples as cutoff, obtaining a final dataset of n = 21 116 and n = 57 samples. The 1500 most variable genes were selected to assess the global data structure by principal component analysis (PCA). Overrepresentation analysis of genes most contributing to PCA components was performed using clusterProfiler package35 (v.3.12.0).

From gene counts, blood cell composition was inferred using the online CIBERSORTx tool (Stanford University 2022),36 with the following parameters: B-mode batch correction, disabled quantile normalization, absolute mode, and n = 500 permutations. For each cell types, a score was generated, reflecting the absolute proportion of each cell type in a mixture.

For supervised differential expression analysis, the edgeR package37 (v.3.26.8) was used to read and preprocess the data before analysis: raw counts were converted to counts per million (CPM), and lowly expressed genes were removed using a CPM > 1 in at least 3 samples as cutoff. To remove heteroscedascity of count data, normalized data were transformed using the voom function.38 Differential expression analysis was performed by applying linear modeling using the limma package39 (v. 3.40.6). Differentially expressed genes were selected using a Benjamin–Hochberg adjusted P < .05 and a logFC > 1 as cutoffs. Overrepresentation analysis of differentially expressed genes was performed using the clusterProfiler package. Of note, the edgeR normalization did not significantly modify the normalized expression levels compared to DESeq2 (gene expression correlation r = .9924, P < 2.2e−16).

For predicting glucocorticoid status from transcriptome, we carried out a Ridge-regularized regression (α = 0) using the 1500 most variable genes, with a 4-fold cross-validation, using the glmnet package40 (v. 4.1-1). The optimization of the 1500 gene predictor was performed on a training cohort of 29 samples, randomly selected from the whole cohort and including 18 samples corresponding to overt Cushing’s syndrome and 11 samples corresponding to either eucortisolism or adrenal insufficiency (patients with mild Cushing’s syndrome were excluded). The accuracy of the 1500 gene predictor was assessed on 2 validation cohorts: a first one (n = 17) including overt Cushing’s syndrome, eucortisolism, and adrenal insufficiency samples, and a second one (n = 30) including pheochromocytoma and primary hyperaldosteronism samples. The latter cohort was used to test the specificity of the predictor, given the different nature of catecholamine excess and primary hyperaldosteronism from Cushing’s syndrome.

Quantitative variable comparisons between groups were performed using Student’s t-test for variables following a normal distribution, or Wilcoxon’s test and Kruskal–Wallis test for variables not following a normal distribution. Quantitative variable correlations were performed using Pearson’s or Spearman’s test according to data distribution. Multivariate logistic regression model including the 1500 gene transcriptome predictor and the neutrophil score was used to test the association with glucocorticoid status. All P-values were 2-sided, and the level of significance was set at .05. All tests were computed in R software environment (3.6.0 version).

Results

Cohort presentation

Fifty-seven blood samples were collected from 43 patients (Table 1;  Table S1). Samples were collected at different time points during the disease, thus reflecting different glucocorticoid status: overt Cushing’s syndrome (n = 28), mild Cushing’s syndrome (n = 11), eucortisolism (n = 10), and adrenal insufficiency (n = 8).

Table 1.

Overall cohort presentation and group comparisons.

Glucocorticoid status Whole cohort
median (IQR)
Training cohort
median (IQR)
First validation cohort
median (IQR)
P-valuea
Samples Total 57 29 17
 Overt Cushing’s syndrome N 28 18 10
Urinary free cortisol
nmol/24 h (<240)
879.5
(419)
879.5
(307.5)
904.5
(5469.25)
.688
Midnight salivary cortisol
nmol/L (<6)
14
(12)
11
(8.5)
17.5
(27.5)
.034
Plasma cortisol after 1 mg DST
nmol/L (<50)
232
(288)
218
(271)
232
(460)
.419
 Mild Cushing’s syndrome N 11 NA NA NA
Urinary free cortisol
nmol/24 h (<240)
273
(100)
NA NA NA
Midnight salivary cortisol
nmol/L (<6)
7
(5.5)
NA NA NA
Plasma cortisol after 1 mg DST
nmol/L (<50)
56
(19.75)
NA NA NA
 Eucortisolism N 10 6 4
Urinary free cortisol
nmol/24 h (<240)
183
(87.75)
159
(71.25)
204
(39.25)
.521
Midnight salivary cortisol
nmol/L (<6)
4
(1)
4
(0)
4.5
(1.25)
.797
Plasma cortisol after 1 mg DST nmol/L (<50) 35
(11)
31
(8.5)
41.5
(6.5)
.4
 Adrenal insufficiency N 8 5 3
Early morning plasma cortisol nmol/L (160–500) 95.5
(66.75)
95.5
(28.25)
98
(98)
1
Cortisol after ACTH stimulation nmol/L (<500) 405.5
(165.25)
435.5
(128.75)
308
(163)
.142

Cortisol values are provided as median values with interquartile range (IQR). aWilcoxon’s test comparing training and first validation cohorts.

Median age was 48 years (range: 26 to 73), with a female predominance (2.35 to 1). Cushing’s syndrome corresponded either to Cushing’s disease (n = 26) or to benign adrenal Cushing’s syndrome (n = 17). Mild Cushing’s syndrome cohort included 7 patients with Cushing’s disease and 4 patients with a benign adrenal tumor. Hypercortisolism-related complications, including hypertension, diabetes, and osteoporosis, were present in 41 (71.9%), 16 (28.0%), and 10 (17.5%) patients, respectively.

For the purpose of building and evaluating a glucocorticoid status predictor from blood transcriptome, we focused on patients with overt Cushing’s syndrome, eucortisolism, and adrenal insufficiency, excluding patients with mild Cushing’s syndrome (n = 11) due to their uncertain glucocorticoid status. Patients were randomly assigned either to a training (n = 29) or to a first validation cohort (n = 17). A second validation cohort of 30 samples was used to test the specificity of the predictor, including 19 patients with pheochromocytoma and 11 patients with primary hyperaldosteronism (Table S1).

Impact of glucocorticoid level on whole blood transcriptome

Unsupervised PCA on the 1500 most variable genes of the whole cohort (samples = 57) discriminated patients according to their glucocorticoid status (Figure 1A). This discrimination was mainly based on the first principal component (PC1; Table S2). In terms of gene expression signature, PC1 was enriched in signaling pathways related to immune response, particularly those relative to neutrophils’ activation and degranulation (Figure 1BTable S3). Beyond the immune response, PC1 was also enriched in genes more generally involved in the response to glucocorticoids,41 including FKBP5PBX1SPI1CDK5R1CXCL8NR4A1, and TBX21 (Table S2).

Impact of glucocorticoid levels on whole blood transcriptome. (A) Sample projections based on the combination of the first 2 principal components (PC1 and PC2) of unsupervised PCA performed on the 1500 most variable genes of the whole cohort (n = 57). (B) Dot plot of the 10 most GO-enriched signaling pathways in overt Cushing's syndrome, using the PC1 coefficients.

Figure 1.

Impact of glucocorticoid levels on whole blood transcriptome. (A) Sample projections based on the combination of the first 2 principal components (PC1 and PC2) of unsupervised PCA performed on the 1500 most variable genes of the whole cohort (n = 57). (B) Dot plot of the 10 most GO-enriched signaling pathways in overt Cushing’s syndrome, using the PC1 coefficients.

Accordingly, a supervised comparison of Cushing’s syndrome samples (n = 28) against eucortisolism/adrenal insufficiency samples (n = 18) provided similar results (Figure 2Table S4).

Differentially expressed genes in overt Cushing's syndrome. Volcano plot of the differentially expressed genes (n = 517) in overt Cushing's syndrome (n = 28) versus eucortisolism/adrenal insufficiency (n = 18).

Figure 2.

Differentially expressed genes in overt Cushing’s syndrome. Volcano plot of the differentially expressed genes (n = 517) in overt Cushing’s syndrome (n = 28) versus eucortisolism/adrenal insufficiency (n = 18).

Predicting glucocorticoid status by blood transcriptome

To predict glucocorticoid status by whole blood transcriptome, we performed a cross-validated Ridge-regularized regression, using the 1500 most variable genes. The 1500 transcriptome predictor was optimized in the training cohort to discriminate overt Cushing’s syndrome from eucortisolism/adrenal insufficiency (Table S5). The predictive value of this model was confirmed on both the first and the second validation cohorts (accuracy of .82 and 1, respectively, Table 2Table S6). Accordingly, samples from the second validation cohort clustered with eucortisolism/adrenal insufficiency samples, as assessed by PCA (Figure S1).

Table 2.

Performance of molecular predictors, based on the whole blood transcriptome signature and on FKBP5 expression level, in discriminating glucocorticoid excess.

Cohort Predictor Accuracy Sensitivity Specificity
First validation cohort Predictor based on 1500 genes .82 .90 .85
Predictor based on FKBP5 .76 .80 .71
Second validation cohort Predictor based on 1500 genes 1 NAa 1
Predictor based on FKBP5 .46 NAa .46

aNot applicable due to the lack of true positives in the second validation cohort.

Mild Cushing’s syndrome samples—excluded from the training and validation cohorts—were classified either as overt Cushing’s syndrome (n = 5/11, 45.5%) or as eucortisolism/adrenal insufficiency (n = 6/11, 54.5%). Of note, the Ridge scores for samples classified as overt Cushing’s syndrome in the mild Cushing’s syndrome cohort was lower than in the training and the first validation cohorts (Wilcoxon, P = .008). The Ridge scores for samples classified as eucortisolism/adrenal insufficiency in the mild Cushing’s syndrome cohort did not differ from the training and first validation cohorts (Wilcoxon, P = .9; Table S6). Accordingly, mild Cushing’s syndrome samples were projected in-between overt Cushing’s syndrome and eucortisolism samples on PCA (Figure 1A).

We then tested whether the glucocorticoid status could be predicted using a single gene. We focused on FKBP5, due to (1) its Ridge regression coefficient being among the highest (Table S5), (2) its potential ability to discriminate Cushing’s syndrome,22,23 and (3) its known implication in glucocorticoid signaling (Figure 3A).42 The prediction accuracy of FKBP5 expression was comparable to the 1500 gene transcriptome predictor in the first validation cohort (accuracy: .76), but lower in the second validation cohort (accuracy: .46; Table 2Table S7). The other genes involved in the glucocorticoid response found enriched in PC1 were not further analyzed as potential single biomarkers, since their association with Cushing’s syndrome was not confirmed in supervised analysis, and since their Ridge regression coefficients were lower than FKBP5 coefficient (Table S5).

FKBP5 expression related to the different glucocorticoid status. (A) Boxplot of FKBP5 gene expression in the different study groups. *Student's t-test P < .001. (B) Representation of the positive correlation between the 24-h urinary free cortisol and FKBP5 expression (r = .72, P = 2.032e−10). (C) Representation of the inverse correlation between FKBP5 expression and the mean methylation level (M-value) of FKBP5 promoter–associated CpG site (r = −.86, P = 1.312e−10).

Figure 3.

FKBP5 expression related to the different glucocorticoid status. (A) Boxplot of FKBP5 gene expression in the different study groups. *Student’s t-test P < .001. (B) Representation of the positive correlation between the 24-h urinary free cortisol and FKBP5 expression (r = .72, P = 2.032e−10). (C) Representation of the inverse correlation between FKBP5 expression and the mean methylation level (M-value) of FKBP5 promoter–associated CpG site (r = −.86, P = 1.312e−10).

We then tested the contribution of blood cell composition in the 1500 gene transcriptome predictor. We inferred the different blood cell subtype proportions from the whole blood transcriptome of each sample. An expected increase of neutrophil proportion in overt Cushing’s syndrome43,44 was observed (Kruskal–Wallis’s test, P = 8.5e−06; Table S1 and Figure S2). In a multivariate model combining the 1500 gene transcriptome predictor and the neutrophil score, the 1500 gene transcriptome predictor remained significant (P = .002; Table 3).

Table 3.

Multivariate model combining the 1500 gene transcriptome predictor and neutrophil scores.

Variables OR 95% CI P-value
1500-genes predictor 4.37 2.06–15.3 .002
Neutrophils score .48 .02–6.13 .6

Training and first validation cohorts were combined. Two statuses were considered: overt Cushing’s syndrome and eucortisolism/adrenal insufficiency.

Abbreviations: OR, odds ratio; CI, confidential Interval.

Association between blood transcriptome and Cushing’s syndrome complications

The 1500 gene transcriptome predictor was positively correlated to the 24-h urinary free cortisol (r = .78, P = 2.993e−13; Figure S3). The 1500 gene transcriptome predictor was higher in patients with osteoporosis (Wilcoxon, P = 2.9e−05), while the 24-h urinary free cortisol did not show any difference (Wilcoxon, P-value of .17, Figure 4A and B). No difference was observed between patients with and without diabetes (Wilcoxon, P = .31), nor with or without hypertension (Wilcoxon, P = .25), and the 1500 gene transcriptome predictor was not correlated to body mass index (BMI) (P-value = .108).

Potential markers of osteoporosis in overt Cushing's syndrome. Association between osteoporosis and 24-h urinary free cortisol (A), 1500 gene transcriptome predictor (B), and FKBP5 expression (C). For 24-h urinary free cortisol, values are expressed as log10.

Figure 4.

Potential markers of osteoporosis in overt Cushing’s syndrome. Association between osteoporosis and 24-h urinary free cortisol (A), 1500 gene transcriptome predictor (B), and FKBP5 expression (C). For 24-h urinary free cortisol, values are expressed as log10.

Similar findings were obtained with FKBP5 expression level, including a positive correlation with the 24-h urinary free cortisol (r = .72, P = 2.032e−10, Figure 3B), a higher expression in patients with osteoporosis (Wilcoxon, P = 2.9e−05; Figure 4C), no difference in patients with diabetes (Wilcoxon, P = .72) or hypertension (Wilcoxon, P = .4), and no correlation with BMI (P = .657).

Association of whole blood transcriptome with whole blood methylome

For 32 samples with both whole blood transcriptome and methylome22 available (n = 32), a correlation analysis was performed. A majority of genes differentially expressed in overt Cushing’s syndrome showed a negative correlation with CpG sites of their promoter regions (Table S8). FKBP5 was among the genes showing the strongest inverse correlation (r = − .86, P adjusted = 5.94e−09; Figure 3C).

Discussion

In this study, we identified a whole blood transcriptome signature predicting the glucocorticoid excess. This signature, in addition to the hormone assays currently used for diagnosis, could reflect the individual biological impact of glucocorticoids.

We designed a predictor with optimal selection of transcriptome biomarkers able to differentiate overt Cushing’s syndrome from eucortisolism and adrenal insufficiency. The predictive value of such transcriptome predictor was confirmed on 2 validation cohorts. For patients with mild Cushing’s syndrome, our predictor showed intermediate classification, confirming the clinical heterogeneity of this group. Indeed, these intermediate patients indisputably fall in-between patients with overt Cushing’s syndrome and eucortisolism, with some overlap in both groups. Whether such non hormonal biomarkers, directly measuring glucocorticoid action, can be useful for the specific management of these patients remains to be established. The question is important, considering the high prevalence of mild Cushing’s syndrome in the general population and the still-ongoing debate on complications’ surveillance and treatment of choice.45 Here, a proper evaluation of mild Cushing’s syndrome is difficult, due to both the lack of a clear clinical definition and to the size of the cohort, not large enough to assess the existence of a specific signature for these patients, thus representing a limitation of this study. Another open question is whether the markers presented here would have comparable relevance in patients with exogenous Cushing’s syndrome, related to glucocorticoid treatments, especially for the common situation of long-term treatment with low glucocorticoid doses or with “local” glucocorticoid treatments.

Noteworthy, this identified signature derives from whole blood, a mixture of various cell types with potentially cell-dependent impact of glucocorticoids on transcriptome profile. Indeed, glucocorticoids have a direct effect on white blood cell count inducing an increase in the neutrophil proportion.43,44 We inferred white blood cell count from transcriptome profile for each sample, and, as expected, overt Cushing’s syndrome samples were characterized by higher neutrophil score, and, accordingly, genes differentially expressed in this group were enriched in immunity-related pathways, mainly in the activation and degranulation of neutrophils. However, among the genes differentially expressed in overt Cushing’s syndrome, we also identified genes more specifically involved in glucocorticoid response, suggesting differences not only related to immunity. Moreover, we demonstrated that the prediction based on transcriptome signature remained significant after adjustment for neutrophil score and therefore that transcriptome profile does not only reflect blood composition variations.

Whole blood transcriptome analysis is not easily reproducible in clinical practice. Thus, we tried to simplify the marker by focusing on one single gene. FKBP5, as a potential surrogate of the 1500 gene transcriptome signature, was able to differentiate and predict Cushing’s syndrome with a good accuracy. FKBP5 (FK506-binding protein 51) is a co-chaperone of heat shock protein 90 (Hsp90) involved in the regulation of the glucocorticoid receptor activity, maintaining it unbound and inactive in the cytoplasm, thus restricting the nuclear translocation of the cortisol receptor complex.24,46 According to preclinical studies, in the presence of glucocorticoid excess, FKBP5 expression increases at both mRNA and protein levels as an effect of intracellular negative feedback.47 Previous studies also showed that FKBP5 expression is sensitive to exogenous glucocorticoids in healthy volunteers and that FKBP5 levels are higher in patients with Cushing’s syndrome, while decreasing to normal baseline levels after successful surgery.23 It has been also demonstrated that the methylation of FKBP5 is affected by stress and dynamically by glucocorticoid level in patients with endogenous Cushing’s syndrome.42 Of note, in our second validation cohort, including patients with pheochromocytoma and primary aldosteronism, the ability of FKBP5 expression level to properly call the absence of Cushing’s syndrome dropped compared to the first validation cohort, raising concerns about potential limits in specificity. These results also highlight the importance of using larger validation cohorts with a wide variety of conditions before using such a biomarker in routine.

Interestingly, in patients with overt Cushing’s syndrome, beyond the correlation between gene expression and 24-h urinary free cortisol, the variability of gene expression was higher in patients with moderate increase of 24-h urinary free cortisol. This suggests a potential informative role of gene expression markers in patients with moderate cortisol increase. In this line, Guarnotta et al. showed that the level of urinary hypercortisolism does not seem to correlate with Cushing’s syndrome severity and that clinical features and cortisol excess–related comorbidities are more reliable indicators in the assessment of disease severity.48 In our study, the transcriptomic profile could discriminate Cushing’s syndrome patients with and without osteoporosis, although the 24-h urinary free cortisol values did not differ between the two groups. However, these results need additional validation, due to the limited cohort size and because of potential confounders not considered, including pre-existing diagnosis of osteoporosis and other determinants of skeletal fragility. Although this preliminary finding further supports the potential value of gene expression markers in predicting catabolic complications, to which extent these biomarkers are relevant in clinical practice remains to be established and better explored in larger cohorts of patients with moderate Cushing’s syndrome.

The transcriptome profile identified in this study also confirmed the previous findings obtained by analyzing the whole blood methylome in Cushing’s syndrome. The negative correlation between promoter methylation and gene expression strengthens our results and underlines the importance of epigenetic alterations in Cushing’s syndrome.49

In conclusion, we showed that the whole blood transcriptome reflects the circulating levels of glucocorticoids and that FKBP5 expression level could be a single gene non hormonal marker of Cushing’s syndrome.

Acknowledgments

We thank the Genomic platform and the team “Genomic and Signaling of Endocrine Tumors” of Institut Cochin, the French COMETE research network, the European Network for the Study of Adrenal Tumor (ENSAT), and the European Reference Network on Rare Endocrine Conditions (Endo-ERN).

Supplementary material

Supplementary material is available at European Journal of Endocrinology online.

Funding

This project has received funding from the European Union’s Horizon 2020 Research and Innovation program under grant agreement no. 633983 and the Programme Hospitalier de Recherche Clinique “CompliCushing” (PHRC AOM 12-002-0064). This work was also supported by the Programme de Recherche Translationnelle en Cancérologie to the COMETE network (PRT-K COMETE-TACTIC).

Authors’ contribution

Maria Francesca Birtolo (Data curation [equal], Formal analysis [equal], Writing—original draft [equal]), Roberta Armignacco (Conceptualization [equal], Data curation [equal], Formal analysis [equal], Writing—review & editing [equal]), Nesrine Benanteur (Formal analysis [equal]), Bertrand Baussart (Writing—review & editing [equal]), Chiara Villa (Writing—review & editing [equal]), Daniel De Murat (Formal analysis [equal]), Laurence Guignat (Writing—review & editing [equal]), Lionel Groussin (Writing—review & editing [equal]), Rosella Libé (Writing—review & editing [equal]), Maria-Christina Zennaro (Data curation [equal], Writing—review & editing [equal]), Meriama Saidi (Data curation [equal]), Karine Perlemoine (Data curation [equal]), Franck Letourneur (Data curation [equal]), Laurence Amar (Data curation [equal], Writing—review & editing [equal]), Jérôme Bertherat (Writing—review & editing [equal]), Anne Jouinot (Conceptualization [equal], Formal analysis [equal], Writing—original draft [equal]), and Guillaume Assié (Conceptualization [equal], Formal analysis [equal], Funding acquisition [equal], Project administration [equal], Writing—original draft [equal]).

Data availability

Transcriptome data generated and analyzed in this study are available in the EMBL-EBI BioStudies repository (reference number: S-BSST1241).

Author notes

Conflict of interest: G.A. is on the editorial board of EJE. G.A. was not involved in the review or editorial process for this paper, on which he is listed as an author.

© The Author(s) 2024. Published by Oxford University Press on behalf of European Society of Endocrinology.
This is an Open Access article distributed under the terms of the Creative Commons Attribution License (https://creativecommons.org/licenses/by/4.0/), which permits unrestricted reuse, distribution, and reproduction in any medium, provided the original work is properly cited.


Day 13, Cushing’s Awareness Challenge

UVA 2004
Cushing’s Conventions have always been special times for me – we learn a lot, get to meet other Cushies, even get referrals to endos!

As early as 2001 (or before) my pituitary function was dropping.  My former endo tested annually but did nothing to help me with the symptoms.

In the fall of 2002 my endo refused to discuss my fatigue or anything at all with me until I lost 10 pounds. He said I wasn’t worth treating in my overweight condition and that I was setting myself up for a heart attack. He gave me 3 months to lose this weight. Those 3 months included Thanksgiving, Christmas and New Years.  Needless to say, I left his office in tears, again.

Fast forward 2 years to 2004.  I had tried for a while to get my records from this endo. He wouldn’t send them, even at doctors’ or my requests.

I wanted to go see Dr. Vance at UVa but I had no records so she wouldn’t see me until I could get them.

Finally, my husband went to the former endo’s office and threatened him with a court order. The office manager managed to come up with about 13 pages of records. For going to him from 1986 to 2001 including weeks and weeks at NIH and pituitary surgery, that didn’t seem like enough records to me.

In April of 2004, many of us from the message boards went to the UVa Pituitary Days Convention. That’s where the picture above comes in.  Other pictures from that convention are here.

By chance, we met a wonderful woman named Barbara Craven. She sat at our table for lunch on the last day and, after we learned that she was a dietitian who had had Cushing’s, one of us jokingly asked her if she’d do a guest chat for us. I didn’t follow through on this until she emailed me later. In the email, she asked how I was doing. Usually I say “fine” or “ok” but for some reason, I told her exactly how awful I was feeling.

Barbara emailed me back and said I should see a doctor at Johns Hopkins. I said I didn’t think I could get a recommendation to there, so SHE referred me. The doctor got right back to me, set up an appointment. Between his vacation and mine, that first appointment turned out to be Tuesday, Sept 14, 2004.

Just getting through the maze at Johns Hopkins was amazing. They have the whole system down to a science, moving from one place to another to sign in, then go here, then window 6, then… But it was very efficient.

My new doctor was wonderful. Understanding, knowledgeable. He never once said that I was “too fat” or “depressed” or that all this was my own fault. I feel so validated, finally.

He looked through my records, especially at my 2 previous Insulin Tolerance Tests (ITT). From those, he determined that my growth hormone has been low since at least August 2001 and I’ve been adrenal insufficient since at least Fall, 1999 – possibly as much as 17 years! I was amazed to hear all this, and astounded that my former endo not only didn’t tell me any of this, he did nothing. He had known both of these things – they were in the past records that I took with me. Perhaps that was why he had been so reluctant to share copies of those records. He had given me Cortef in the fall of 1999 to take just in case I had “stress” and that was it.

The new endo took a lot of blood (no urine!) for cortisol and thyroid stuff. I went back on Sept. 28, 2004 for arginine, cortrosyn and IGF testing.

He said that I would end up on daily cortisone – a “sprinkling” – and some form of GH, based on the testing the 28th.

For those who are interested, my new endo is Roberto Salvatori, M.D.
Assistant Professor of Medicine at Johns Hopkins

Medical School: Catholic University School of Medicine, Rome, Italy
Residency: Montefiore Medical Center
Fellowship: Cornell University, Johns Hopkins University
Board Certification: Endocrinology and Metabolism, Internal Medicine

Clinical Interests: Neuroendocrinology, pituitary disorders, adrenal disorders

Research Interests: Control of growth hormone secretion, genetic causes of growth hormone deficiency, consequences of growth hormone deficiency.

Although I have this wonderful doctor, a specialist in growth hormone deficiency at Johns Hopkins, in November, 2004, my insurance company saw fit to over-ride his opinions and his test results based on my past pharmaceutical history! Hello??? How could I have a history of taking GH when I’ve never taken it before?

Of course, I found out late on a Friday afternoon. By then it was too late to call my case worker at the drug company, so we had to appeal on Monday. My local insurance person also worked on an appeal, but the whole thing was  just another long ordeal of finding paperwork, calling people, FedExing stuff, too much work when I just wanted to start feeling better by Thanksgiving.

As it turned out the insurance company rejected the brand of hGH that was prescribed for me. They gave me the ok for a growth hormone was just FDA-approved for adults on 11/4/04. The day this medication was approved for adults was the day after my insurance said that’s what is preferred for me. In the past, this form of hGH was only approved for children with height issues. Was I going to be a ginuea pig again?

The new GH company assigned a rep for me, submitted info to pharmacy, and waited for insurance approval, again.

I finally started the Growth Hormone December 7, 2004.

Was the hassle and 3 year wait worth it?

Stay tuned for April 15, 2016 when all will be revealed.

Read

Read Dr. Barbara Craven’s Guest Chat, October 27, 2004

Thanks for reading 🙂

MaryO

Corcept Completes Enrollment in Phase 3 Gradient Trial of Relacorilant in Patients With Adrenal Cushing’s Syndrome

Corcept Therapeutics Incorporated (NASDAQ: CORT), a commercial-stage company engaged in the discovery and development of medications to treat severe endocrinologic, oncologic, metabolic and neurologic disorders by modulating the effects of the hormone cortisol, today announced completion of enrollment in GRADIENT, a Phase 3 trial of its proprietary selective cortisol modulator relacorilant in patients with Cushing’s syndrome (hypercortisolism) caused by an adrenal adenoma or adrenal hyperplasia.

“Hypercortisolism with adrenal etiology affects many patients and is associated with serious cardiometabolic comorbidities, including hypertension and hyperglycemia, and increased risk of premature death,” said Bill Guyer, PharmD, Corcept’s Chief Development Officer. “GRADIENT is the first prospective placebo-controlled study to be conducted exclusively in these patients with Cushing’s syndrome. We expect data from GRADIENT in the fourth quarter of this year.”

GRADIENT is a randomized, double-blind, placebo-controlled trial conducted at sites in the United States, Europe and Israel. One-hundred thirty-seven patients were randomized 1:1 to receive relacorilant or placebo for 22 weeks. Primary endpoints are improvement in glucose metabolism and hypertension.

About Cushing’s Syndrome (Hypercortisolism)
Cushing’s syndrome is caused by excessive activity of the hormone cortisol. Endogenous Cushing’s syndrome is an orphan disease that most often affects adults aged 20-50. Symptoms vary, but most patients experience one or more of the following manifestations: high blood sugar, diabetes, high blood pressure, upper-body obesity, rounded face, increased fat around the neck, thinning arms and legs, severe fatigue and weak muscles. Irritability, anxiety, cognitive disturbances and depression are also common. Cushing’s syndrome can affect every organ system and can be lethal if not treated effectively.

About Relacorilant
Relacorilant is a selective cortisol modulator that binds to the glucocorticoid receptor (GR), but does not bind to the body’s other hormone receptors. Corcept is studying relacorilant in a variety of serious disorders, including ovarian, adrenal and prostate cancer and Cushing’s syndrome. Relacorilant is proprietary to Corcept and is protected by composition of matter, method of use and other patents. Relacorilant has orphan drug designation in the United States and the European Union for the treatment of Cushing’s syndrome.

About Corcept Therapeutics
For over 25 years, Corcept’s focus on cortisol modulation and its potential to treat patients across a wide variety of serious disorders has led to the discovery of more than 1,000 proprietary selective cortisol modulators. Corcept’s advanced clinical trials are being conducted in patients with hypercortisolism, solid tumors, amyotrophic lateral sclerosis (ALS) and liver disease (NASH). In February 2012, the company introduced Korlym, the first medication approved by the U.S. Food and Drug Administration for the treatment of patients with Cushing’s syndrome. Corcept is headquartered in Menlo Park, California. For more information, visit Corcept.com.

Forward-Looking Statements
Statements in this press release, other than statements of historical fact, are forward-looking statements based on our current plans and expectations that are subject to risks and uncertainties that might cause our actual results to differ materially from those such statements express or imply. These risks and uncertainties include, but are not limited to, our ability to operate our business; risks related to the study and development of Korlym as well as relacorilant, miricorilant, dazucorilant and our other product candidates, including their clinical attributes, regulatory approvals, mandates, oversight and other requirements; and the scope and protective power of our intellectual property. These and other risks are set forth in our SEC filings, which are available at our website and the SEC’s website.

In this press release, forward-looking statements include those concerning the development of relacorilant as a treatment for Cushing’s syndrome, and design, timing and expectations regarding our GRADIENT trial. We disclaim any intention or duty to update forward-looking statements made in this press release.

From https://finance.yahoo.com/news/corcept-completes-enrollment-phase-3-120000179.html