Obesity is common at diagnosis of pituitary adenoma in childhood and may persist despite successful treatment, according to findings published in Clinical Endocrinology.
“The importance of childhood and adolescent obesity on noncommunicable disease in adult life is well recognized, and in this new cohort of patients, we report that obesity is common at presentation of pituitary adenoma in childhood and that successful treatment is not necessarily associated with weight loss,” Aashish Sethi, MD, MBBS, a pediatric endocrinologist in the department of endocrinology at Alder Hey Children’s Hospital in Liverpool, United Kingdom, and colleagues wrote. “We have reported obesity, and obesity-related morbidity in a mixed cohort of children and young adults previously, but [to] our knowledge, this is the first time this observation has been reported in a purely pediatric cohort.”
In a retrospective study, Sethi and colleagues analyzed clinical and radiological data from 24 white children from Alder Hey Children’s Hospital followed for a median of 3.3 years between 2000 and 2019 (17 girls; mean age at diagnosis, 15 years). Researchers assessed treatment modality (medical, surgical or radiation therapy), pituitary hormone deficiencies and BMI, as well as results of any genetic testing.
Within the cohort, 13 girls had prolactinomas (mean age, 15 years), including 10 macroadenomas between 11 mm and 35 mm in size. Children presented with menstrual disorders (91%), headache (46%), galactorrhea (46%) and obesity (38%). Nine children were treated with cabergoline alone, three also required surgery, and two were treated with the dopamine agonist cabergoline, surgery and radiotherapy.
Five children had Cushing’s disease (mean age, 14 years; two girls), including one macroadenoma. Those with Cushing’s disease presented with obesity (100%), short stature (60%) and headache (40%). Transsphenoidal resection resulted in biochemical cure; however, two patients experienced relapse 3 and 6 years after surgery, respectively, requiring radiotherapy. One patient also required bilateral adrenalectomy.
Six children had a nonfunctioning pituitary adenoma (mean age, 16 years; two girls), including two macroadenomas. These children presented with obesity (67%), visual field defects (50%) and headache (50%). Four required surgical resections, with two experiencing disease recurrence after surgery and requiring radiotherapy.
During the most recent follow-up exam, 13 children (54.1%) had obesity, including 11 who had obesity at diagnosis.
“The persistence of obesity following successful treatment, in patients with normal pituitary function, suggests that mechanisms other than pituitary hormone excess or deficiency may be important,” the researchers wrote. “It further signifies that obesity should be a part of active management in cases of pituitary adenoma from diagnosis.” – by Regina Schaffer
Disclosures: The authors report no relevant financial disclosures.
MiRNAs are important epigenetic players with tissue- and disease-specific effects. In this study, our aim was to investigate the putative differential expression of miRNAs in adrenal tissues from different forms of Cushing’s syndrome (CS). For this, miRNA-based next-generation sequencing was performed in adrenal tissues taken from patients with ACTH-independent cortisol-producing adrenocortical adenomas (CPA), from patients with ACTH-dependent pituitary Cushing’s disease (CD) after bilateral adrenalectomy, and from control subjects. A confirmatory QPCR was also performed in adrenals from patients with other CS subtypes, such as primary bilateral macronodular hyperplasia and ectopic CS. Sequencing revealed significant differences in the miRNA profiles of CD and CPA. QPCR revealed the upregulated expression of miR-1247-5p in CPA and PBMAH (log2 fold change > 2.5, p < 0.05). MiR-379-5p was found to be upregulated in PBMAH and CD (log2 fold change > 1.8, p < 0.05). Analyses of miR-1247-5p and miR-379-5p expression in the adrenals of mice which had been exposed to short-term ACTH stimulation showed no influence on the adrenal miRNA expression profiles. For miRNA-specific target prediction, RNA-seq data from the adrenals of CPA, PBMAH, and control samples were analyzed with different bioinformatic platforms. The analyses revealed that both miR-1247-5p and miR-379-5p target specific genes in the WNT signaling pathway. In conclusion, this study identified distinct adrenal miRNAs as being associated with CS subtypes.
Cushing’s syndrome (CS) results from the excessive secretion of cortisol, leading to visceral obesity, resistance to insulin, osteoporosis, and altered lipid and glucose metabolism [1,2]. Excessive production of cortisol by the adrenal glands can be either ACTH-dependent or -independent. In the majority of patients, hypercortisolism is due to ACTH secretion by corticotroph adenomas of the pituitary gland (Cushing’s disease, CD) or by ectopic tumors [3]. Approximately 20% of cases are ACTH-independent, where cortisol is secreted autonomously by the adrenal cortex. The pathology of ACTH-independent cases is diverse; they are most often caused by unilateral cortisol-producing adrenocortical adenomas (CPA). Rare causes are cortisol-secreting adrenocortical carcinomas (ACC), primary bilateral macronodular adrenocortical hyperplasia (PBMAH), bilateral CPAs, and primary pigmented nodular adrenal disease (PPNAD) [4,5]. Irrespective of the subtype, prolonged exposure to cortisol in CS is associated with increased mortality and cardiovascular morbidity in its patients [6]. Treatment is based on the underlying cause of hypercortisolism, with pituitary surgery or adrenalectomy being the preferred choice. Medical therapy options in CS are few and consist of pituitary-directed drugs, steroid synthesis inhibitors, and glucocorticoid receptor antagonists [7]. For the timely diagnosis and targeted management of CS and its subtypes, a comprehensive understanding of cortisol secretion, in terms of canonical signaling pathways as well as upstream epigenetic factors, is needed.
MiRNA molecules have emerged as key epigenetic players in the transcriptional regulation of cortisol production. Briefly, the deletion of Dicer in adrenals, a key miRNA processing enzyme, revealed diverse expression changes in miRNAs along with related changes in steroidogenic enzymes such as Cyp11b1 [8]. Furthermore, key enzymes in the cortisol biosynthesis pathway, namely Cyp11a1, Cyp21a1, Cyp17a1, Cyp11b1, and Cyp11b2, were also found to be regulated by various miRNAs (miRNA-24, miRNA-125a-5p, miRNA-125b-5p, and miRNA-320a-3p) in in vitro studies [9]. Consequently, various studies have also characterized miRNA expression profiles in CS subtypes. Importantly, miRNA expression in the corticotropinomas of CD patients was found to vary according to USP8 mutation status [10]. Other studies have also identified specific miRNA candidates and associated target genes in the adrenals of patients with PPNAD [11], PBMAH [12,13], and massive macronodular adrenocortical disease [14]. Interestingly, no common miRNA candidates were found among these studies, indicating the specificity of miRNAs to the different underlying pathologies in CS.
There are limited studies directly comparing miRNA expression profiles of ACTH-dependent and ACTH-independent CS patients. Consequently, in our previous study, we found differences in expression profiles when comparing circulating miRNAs in CD and CPA patients [15]. We hypothesized that the presence of ACTH possibly influences the miRNA profile in serum due to the upstream differential expression in the origin tissues. In this study, we aim to further explore this hypothesis by comparing the miRNA expression profile of adrenal tissues in ACTH-dependent and ACTH-independent CS. In brief, miRNA specific sequencing was performed in two prevalent subtypes of CS: in CD, the most prevalent ACTH-dependent form; and in CPA, the most prevalent ACTH-independent form. Specific miRNA candidates related to each subtype were further validated in other forms of CS. To further investigate our hypothesis, the response of miRNA candidates following ACTH stimulation was assessed in mice, and the expression of miRNAs in murine adrenals was subsequently investigated. Finally, an extensive targeted gene analysis was performed based on in silico predictions, RNA-seq data, and luciferase assays.
2. Results
2.1. Differentially Expressed miRNAs
NGS revealed differentially expressed miRNAs between the different groups analyzed (Figure 1). CD and CPA taken together as CS showed a differentially expressed profile (42 significant miRNAs) in comparison to controls. Moreover, individually, CPA and CD were found to show a significantly different expression profile in comparison to controls (n = 38 and n = 17 miRNAs, respectively). Interestingly, there were no significantly upregulated genes in the adrenals of patients with CD in comparison to the control adrenals. A comparative analysis of the top significant miRNAs (log2 fold change (log2 FC) > 1.25 & p < 0.005) between the two groups was performed and the representative Venn diagrams are given in Figure 2. Briefly, miR-1247-5p, miR-139-3p, and miR-503-5p were significantly upregulated in CPA, in comparison to both CD and controls. Furthermore, miR-150-5p was specifically upregulated in CPA as compared to CD. Several miRNAs (miR-486-5p, miR-551b-3p, miR-144-5p, miR-144-3p, and miR-363-3p) were found to be significantly downregulated in the groups of CPA and CD in comparison to controls. MiR-19a-3p and miR-873-5p were found to be commonly downregulated in CPA in comparison to both CD and controls. Principal component analyses based on miRNA sequencing did not identify any major clusters among the samples. Furthermore, the miRNA profile was not different among the CPA samples based on the mutation status of PRKACA (Supplementary Materials Figure S1).
Figure 1. Differentially expressed miRNAs from sequencing. Volcano plot showing the relationship between fold change (log2 fold change) and statistical significance (−log10 p value). The red points in the plot represent significantly upregulated miRNAs, while blue points represent significantly downregulated miRNAs. CPA, cortisol producing adenoma; CD, Cushing’s disease; Cushing’s syndrome represents CPA and CD, taken together.
Figure 2. Venn analyses of the common significant miRNAs from each group. The significantly expressed miRNAs from each sequencing analysis were shortlisted and compared between the groups. CPA, cortisol producing adenoma; CD, Cushing’s disease.
2.2. Validation and Selection of Candidate miRNAs
For validation by QPCR, the most significant differentially expressed miRNAs (log2 FC > 1.25 & p < 0.005) among the groups were chosen (Table S1). According to the current knowledge, upregulated miRNAs are known to contribute more to pathology than downregulated miRNAs [16]. Since the total number of significantly upregulated miRNAs was six, all these miRNAs were chosen for validation. Contrarily, 25 miRNAs were significantly downregulated among the groups. In particular, miR-486-5p, miR-551b-3p, miR-144-5p, miR-144-3p, and miR-363-3p were found to be commonly downregulated in the CS group in comparison to controls; therefore, these miRNAs were chosen for validation.
Among the upregulated miRNA candidates, miR-1247-5p QPCR expression confirmed the NGS data (Figure 3A, Table S1). Moreover, miR-150-5p and miR-139-3p were upregulated in CPA specifically in comparison to CD, and miR-379-5p was upregulated in CD in comparison to controls by QPCR. In the case of downregulated genes, none of the selected miRNAs could be confirmed by QPCR (Figure 3B). Thus, analysis of the six upregulated and five downregulated miRNAs from NGS yielded two significantly upregulated miRNA candidates, miR-1247-5p in CPA and miR-379-5p in CD, when compared to controls. These miRNA candidates were taken up for further QPCR validation in an independent cohort of other subtypes of CS (Figure 4), namely ACTH-dependent ectopic CS (n = 3) and ACTH-independent PBMAH (n = 10). The QPCR analysis in the other subtypes revealed miR-1247-5p to be consistently upregulated in ACTH-independent CS (PBMAH and CPA) in comparison to ACTH-dependent CS (CD and ectopic CS) and controls. On the other hand, miR-379-5p was upregulated in CD and PBMAH in comparison to controls.
Figure 3. QPCR analyses of significant miRNAs from sequencing analyses. Data are represented as mean ± standard deviation (SD) of −dCT values: (A) Expression analysis of significantly upregulated miRNAs; (B) Expression analysis of common significantly downregulated miRNAs. Housekeeping gene: miR-16-5p. Statistics: ANOVA test with Bonferroni correction to detect significant differences between patient groups with at least a significance of p-value < 0.05 (*).
Figure 4. QPCR analyses of significantly upregulated miRNAs from validation QPCR. Data are represented as mean ± standard deviation (SD) of −dCT values. Housekeeping gene: miR-16-5p. Statistics: ANOVA test with Bonferroni correction to detect significant differences between patient groups with at least a significance of p-value < 0.05 (*).
2.3. In Vivo Assessment of ACTH-Independent miR-1247-5p
To analyze the influence of ACTH on miRNA expression, the expression of miR-1247-5p and miR-379-5p were assessed in the adrenal tissues of ACTH stimulated mice at different time points. For this analysis, miR-96-5p was taken as a positive control, as it has previously been reported to be differentially expressed in ACTH stimulated mice [17]. The analyses revealed that the expression of miR-1247-5p and miR-379-5p did not change at different timepoints of the ACTH stimulation (Figure 5). Meanwhile, the positive control of mir-96-5p showed a dynamic expression pattern with upregulation after 10 min, followed by downregulation at the subsequent 30 and 60 min time points, in concordance with previously reported findings [18].
Figure 5. Analysis of miRNA expression in ACTH stimulated mice tissue. QPCR analyses of positive controls, miR-96-5p, and candidates miR-379-5p and miR-1247-5p. Mice were injected with ACTH, and adrenals were collected at different timepoints to assess the impact of ACTH on miRNA expression. Data are represented as mean ± standard deviation (SD) of −dCT values. Housekeeping gene: miR-26a-5p. Statistics: ANOVA test with Bonferroni correction to detect significant differences between patient groups with at least a significance of p-value < 0.05 (*).
2.4. In Silico Analyses of miRNA Targets
Two diverse approaches were employed for a comprehensive in silico analysis of the miRNA targets. First, the predicted targets of miR-1247-5p and miR-379-5p were taken from the TargetScan database, which identified miRNA–mRNA target pairs based on sequence analyses [19]. The expression status of these targets was then checked in the RNA sequencing data from CPA vs. controls (miR-1247-5p) and PBMAH vs. controls (miR-379-5p). Targets that showed significant expression changes in the sequencing data were shortlisted (Figure 6A). Among the 1061 predicted miR-1247-5p targets, 28 genes were found to show significant expression changes in CPA (20 upregulated, 8 downregulated). On the other hand, for 124 predicted miR-379-5p targets, 23 genes were found to show significant expression changes in PBMAH (20 upregulated, 3 downregulated). Interestingly, the selected targets were found to be unique for each miRNA, except for FICD (FIC domain protein adenylyltransferase) (Figure 6B).
Figure 6. (A) Differentially expressed target genes of miRNAs from sequencing. Data are represented as log2 fold change in comparison to the controls. Statistics: ANOVA test with Bonferroni correction to detect significant differences between patient groups with at least a significance of p-value < 0.05. (B) Venn analyses of common significant miRNA target genes and related pathways. The significantly expressed targets from each sequencing analysis were shortlisted and compared between the groups. Predicted pathways of the targets from the Panther database were shortlisted and compared between the groups.
2.5. In Vitro Analyses of miR-1247-5p Targets
For in vitro analyses, we focused on downregulated targets, as we expect our upregulated miRNA candidates to cause a downregulation of the target mRNAs. For our downregulated mRNAs, only targets of miR-1247-5p were found to have published links to CS, namely Cyb5a, Gabbr2, and Gnaq (Table 1). Therefore, these three targets were then verified by QPCR in the groups of CPA, CD, PBMAH, ectopic CS, and controls (Figure 6). Only Cyb5A was found to be significantly downregulated in ACTH-dependent forms (ectopic CS and CD) as well as in ACTH-independent CS (PBMAH and CPA) in comparison to controls. Consequently, to assess whether Cyb5a is indeed regulated by miR-1247-5p, a dual luciferase assay was performed. To prove our hypothesis, treatment of Cyb5a-WT cells with miR-1247-5p mimic was expected to lead to a reduced luminescence, whereas no effects were expected in cells treated with the miR-1247-5p inhibitor or the Cyb5a-mutant (with a mutation in the miR-1247-5p binding site). As shown in Figure 7, transfection of miR-1247-5p significantly reduced luminescence from Cyb5a-WT in comparison to cells transfected with Cyb5a-WT and miR-1247-5p inhibitors. However, these predicted binding results were not found to be specific, as there were no significant differences when compared to wells transfected with Cyb5a-WT alone (Figure 8). Consecutively, when the mutated Cyb5a-Mut were transfected along with the mimics and inhibitors, no significant differences in luminescence were observed in the transfected population. Thus, direct interaction between miR-1247-5p and its predicted target gene Cyb5A could not be conclusively proven using this luciferase assay.
Figure 7. QPCR analyses of the top predicted targets of miR-1247-5p. Data are represented as mean ± standard deviation (SD) of −dCT values. Housekeeping gene: PPIA. Statistics: ANOVA test with Bonferroni correction to detect significant differences between patient groups with at least a significance of p-value < 0.05 (*).
Figure 8. Results of dual luminescence assay on cells transfected with miR-1247-5p mimics and related controls. Cells were transfected with plasmids containing either the WT or Mut miRNA binding sequence in Cyb5a. Either miR-1247-5p mimics or miR-1247-5p inhibitors were transfected together with the respective plasmids. Data are represented as mean ± standard error of mean (SEM) of relative luminescence unit values. Statistics: ANOVA test with Bonferroni correction to detect significant differences between patient groups with at least a significance of p value < 0.05 (*).
Table 1. Analysis of the predicted targets of miR-1247-5p and their expression levels in comparison to controls (log2 fold change). Published literature on target genes in reference to CS is highlighted in bold.
2.6. Pathway Analyses of miRNA Targets
For the pathway analysis (Reactome) we used the 28 predicted miRNA-1247-5p targets and the 23 predicted miRNA-379-5p targets from TargetScan, which were significantly differently expressed in the RNA-seq (Figure 6). Concurrently, the pathways commonly enriched by both miRNAs included the WNT signaling pathway and N-acetyl-glucosamine synthesis (Figure 9A). As a complementary approach, in silico analyses were also performed based on the targets from miRTarBase. In this database, targets are shortlisted based on published experimental results. In this analysis, miR-1247-5p (n = 21) and miR-379-5p targets (n = 85) were unique. While the validated targets of miR-379-5p were found to show significant changes in expression in the RNA-seq data from PBMAH (n = 12), none of the validated miR-1247-5p targets were found to show significant expression changes in the RNA-seq data from CPA. Therefore, all the validated targets of the miRNAs were subjected to pathway analyses (Panther). Interestingly, the WNT signaling pathway was also found to be commonly regulated by both miRNAs using this approach (Figure 9B). Finally, the expression status of target genes related to WNT signaling pathways were checked in our RNA-seq data (Figure S2). Given the upregulated status of the miRNAs, a downregulated expression of its target genes was expected. However, a significantly upregulated expression was observed for DVL1 in CPA in comparison to controls and for ROR1 in PBMAH in comparison to controls.
Figure 9. Pathway analyses of miRNA target genes. (A) The predicted targets were matched with the RNA-seq expression data. For miR-1247-5p, CPA vs. controls expression data; and for miR-379-5p, PBMAH vs. controls expression data. The significantly expressed target genes were then subjected to pathway analyses by Reactome. The significantly enriched pathway networks (p < 0.05) and their related genes are given. (B) The experimentally validated target genes from miRTarBase were analyzed for their role in pathways by the Panther database. The target genes and their related pathways are given. The commonly represented pathways are marked in bold.
3. Discussion
MiRNAs are fine regulators of both physiology and pathology and have diverse roles as diagnostic biomarkers as well as therapeutic targets. While circulating miRNAs have been investigated as potential biomarkers for hypercortisolism in CS subtypes (36), comprehensive analyses of their pathological role in CS subtypes have not yet been performed. This study hoped to uncover the pathological role of miRNAs in different CS subtypes as well as identify unique epigenetic targets contributing to hypercortisolism in these subtypes. As such, miRNA sequencing was performed in the ACTH-independent CPA and ACTH-dependent CD, with additional QPCR validation in PBMAH and ectopic CS. As expected, miRNA expression profiles in CD and CPA were very different.
3.1. ACTH-Independent Upregulated miRNAs in CS
Among the analyzed miRNAs, only miR-1247-5p and miR-379-5p showed the most prominent changes in expression levels. Briefly, miR-1247-5p was significantly upregulated in ACTH-independent forms of CS, CPA, and PBMAH (Figure 1 and Figure 3) while miR-379-5p was found to be upregulated in CD and PBMAH, in comparison to controls. Even though CD and PBMAH represent CS subtypes with different ACTH dependence, albeit both with hyperplastic tissue, it is interesting to find a shared miRNA expression status. Concurrently, miRNAs have been identified as dynamic players in regulating the acute effect of ACTH on adrenal steroidogenesis in in vivo murine studies [20,21]. Further diverse miRNAs have been characterized to regulate steroidogenesis in ACTH and dexamethasone treated rats [22] (suppressed ACTH) as well as in in vitro studies [20]. It is possible that miR-379-5p contributes to the adrenal hyperplasia present in both PBMAH and CD by targeting specific genes related to hyperplasia, and miR-1247-5p by contributing to cortisol production independent of ACTH regulation in CPA and PBMAH.
Interestingly, the miRNA candidates (mir-1247-5p and miR-379-5p) in our study have not been previously characterized in any of these studies. Furthermore, the expression of mir-1247-5p and miR-379-5p were found to be independent of ACTH stimulation, underlying their role in CS independently of the HPA axis control and postulating specific regulatory processes.
3.2. Target Genes of miRNAs in CS
Initially, we focused on the selection of known CS specific target genes that could be directly repressed by miRNAs, thereby contributing to pathology. The predicted target genes of miR-1247-5p and miR-379-5p were assessed for their downregulated expression status in the RNA-seq data. Among the selected target genes, only Cyb5a was found to be significantly downregulated in all forms of CS (Figure 6). Cytochrome b5 (CYB5A) is a marker of the zona reticularis and is an important regulator of androstenedione production [23,24]. Based on its role in adrenal steroidogenesis, it is possible that Cyb5a is downregulated by miR1247-5p. To prove our hypothesis, a dual luciferase assay was performed in HELA cell line to identify a direct interaction between Cyb5a and miR-1247-5p (Figure 7). Unfortunately, a direct interaction could not be proven, indicating that miR-1247-5p perhaps regulates its target genes in different ways.
3.3. Pathway Analyses of miRNA Targets
To identify miRNA specific regulatory processes, comprehensive target and pathway analyses were performed. Independent pathway analyses of the respective targets with two different databases of Reactome and Panther showed the WNT signaling pathway as a common targeted pathway of both mir-1247-5p and miR-379-5p (Figure 8). The WNT signaling pathway represents a crucial regulator in diverse developmental as well as pathological processes with tissue-specific effects [25,26]. Consequently, the WNT pathway has been largely characterized as one of the dysregulated pathophysiological mechanisms in CPA. Mutations in PRKACA, one of the WNT signaling proteins, are present in approximately 40% of CPA [27]. In the case of CD, dysregulated WNT signaling has been characterized as promoting proliferation in ACTH-secreting pituitary adenomas [28]. Moreover, activating mutations in beta catenin, one of the WNT signaling pathways, has been characterized as driving adrenal hyperplasia through both proliferation-dependent and -independent mechanisms [29]. Thus, it could be hypothesized that by targeting specific genes in the pathway, miRNAs drive specific pathophysiological processes in diverse CS subtypes.
3.4. MiRNA Target Genes in WNT Signaling
DVL1 (TargetScan) and DVL3 (miRTar) are the shortlisted target genes of miR-1247-5p in the WNT signaling pathway. These genes are members of canonical WNT pathways and, importantly, activation of the cytoplasmic effector Dishevelled (Dvl) is a critical step in WNT/β-catenin signaling initiation [30,31]. Interestingly, no difference in DVL1 and DVL3 gene expression was found in the analyses of ACTH-secreting pituitary adenomas [32]. Therefore, it could be possible that DVL1 and DVL3 are only targeted by miR-1247-5p specifically in the adrenal of CPA and PBMAH patients, leading to its characterized tumor progression. EDN1, TGFBR1 (TargetScan), and ROR1 (miRTar) were the target genes of miR-379-5p related to the WNT pathway. In epithelial ovarian cancer, Endothelin-1 (EDN-1) was found to regulate the epithelial–mesenchymal transition (EMT) and a chemoresistant phenotype [33]. In the case of receptor tyrosine kinase-like orphan receptor 1 (ROR1), higher expression of the gene was associated with a poor prognosis in ovarian cancer [34]. Concurrently, suppression of TGFBR1-mediated signaling by conditional knockout in mice was found to drive the pathogenesis of endometrial hyperplasia, independent of the influence of ovarian hormones [35]. Therefore, it could be hypothesized that the dysregulated expression of these factors in adrenals could trigger similar hyperplastic effects mediated by these factors, as in ovarian tissues.
3.5. Bottlenecks and Future Outlook
Interestingly, among these genes, only DVL1 and ROR1 were found to be significantly upregulated in the RNA-seq data (Figure S2). The major regulatory role of miRNAs in gene expression come from their ability to repress gene expression at the level of transcription and translation. There are also reports of miRNA-mediated gene upregulation; however, the physiological evidence of the role is still unresolved [36]. Therefore, it is interesting to see the selected targets of miR-1247-5p and miR-379-5p upregulated. Moreover, it should be noted that most of the experimentally validated miRNA targets were identified by CLIP methods [37]. Crosslinking immunoprecipitation (CLIP) are binding assays that provide genome-wide maps of potential miRNA-target gene interactions based on sequencing. Moreover, these assays do not make functional predictions on the outcome of miRNA binding, and neither do upregulation or downregulation [38,39]. Therefore, in our current experimental setting, we could only identify potential miRNA target genes and speculate on their pathological role based on the published literature and in silico analyses. Furthermore, extensive mechanistic analyses based on these potential targets could help in elaborating the specific epigenetic pathways that fine-tune CS pathology in different subtypes.
4. Materials and Methods
4.1. Sample Collection and Ethics Approval
All patients were registered in the German Cushing’s Registry, the ENS@T or/and NeoExNET databases (project number protocol code 379-10 and 152-10). The study was approved by the Ethics Committee of the University of Munich. All experiments were performed according to relevant guidelines and protocols, and written informed consent was obtained from all patients involved. The adrenal samples used in the sequencing (miRNA and RNA) belong to the same patient.
For miRNA-specific next-generation sequencing (NGS), a total of 19 adrenocortical tissue samples were used. The cohort consisted of the following patient groups: ACTH-independent CPA, n = 7; ACTH-dependent hypertrophic adrenals of CD patients after bilateral adrenalectomy, n = 8; normal adjacent adrenal tissue from patients with pheochromocytoma as controls, n = 8. For QPCR validation, the patient groups included adrenal tissue from ACTH-independent PBMAH, n = 10, and ACTH-dependent ectopic CS, n = 3.
In the case of mRNA sequencing, a total of 23 adrenocortical tissue samples were used. This includes the following patient groups: CPA, n = 7; PBMAH, n = 8; normal adjacent adrenal tissue from patients with pheochromocytoma as controls, n = 8.
The clinical characteristics of the patients are given in Table 2. Furthermore, of the eight CPA samples in the study, three of them carried known somatic driver mutations in the PRKACA gene and in the ten PBMAH samples, two carried germline mutations in the ARMC5 gene.
Table 2. Clinical characteristics of the patient groups. Data are given as median with 25th and 75th percentiles in brackets. CPA, cortisol producing adenoma; CD, Cushing’s disease.
The adrenal tissues were stored at −80 °C. Total RNA isolation was carried out from all adrenal cortex samples by an RNeasy Tissue Kit (Qiagen, Hilden, Germany). The isolated RNA was kept frozen at −80 °C until further use.
4.2. MiRNA and RNA Sequencing
RNA integrity and the absence of contaminating DNA were confirmed by Bioanalyzer RNA Nano (Agilent Technologies, Santa Clara, CA, USA) and by Qubit DNA High sensitivity kits, respectively. Sequencing libraries were prepared using the Illumina TruSeq Small RNA Library Preparation Kit. NGS was performed on 2 lanes of an Illumina HiSeq2500 (Illumina, CA, USA) multiplexing all samples (paired end read, 50 bp). The quality of sequencing reads was verified using FastQC0.11.5 (http://www.bioinformatics.babraham.ac.uk/projects/fastqc, date last accessed: 13 March 2020) before and after trimming. Adapters were trimmed using cutadapt [40]. Reads with <15 bp and >40 bp insert sequences were discarded. An alignment of reads was performed using miRBase V21 [41,42] with sRNAbench [43]. EdgeR and DeSeq in R were used for further analyses [44,45]. MiRNAs with at least 5 raw counts per library were included. RNA-seq was performed by Qiagen, Hilden, Germany. For mRNA, sequencing was performed on Illumina NextSeq (single end read, 75 bp). Adapter and quality trimming were performed by the “Trim Reads” tool from CLC Genomics Workbench. Furthermore, reads were trimmed based on quality scores. The QC reports were generated by the “QC for Sequencing Reads” tool from CLC Genomics Workbench. Read mapping and gene quantification were performed by the “RNA-seq Analysis” tool from CLC Genomics Workbench [46]. The miRNA-seq data generated in this study have been submitted to the NCBI (PRJNA847385).
4.3. Validation of Individual miRNAs
MiRNAs and genes significantly differentially expressed by NGS were validated by QPCR. Reverse transcription of miRNA-specific cDNA was performed by using the TaqMan MicroRNA Reverse Transcription Kit (Thermo Fisher Scientific, Munich, Germany), and the reverse transcription of RNA genes was done by using the Superscript VILO cDNA synthesis Kit (Thermo Fisher Scientific, Munich, Germany). 50 ng of RNA was used for each of the reverse transcription reactions. Quantitative real-time PCR was performed using the TaqMan Fast Universal PCR Master Mix (2×) (Thermo Fisher Scientific, Munich, Germany) on a Quantstudio 7 Flex Real-Time PCR System (Thermo Fisher Scientific, Munich, Germany) in accordance with the manufacturer’s protocol. All QPCR reactions were performed in a final reaction volume of 20 μL and with 1 μL of 1:5 diluted cDNA. Negative control reactions contained no cDNA templates. Gene expression was quantified using the relative quantification method by normalization with reference gene [47]. Statistical analysis using the bestkeeper tool was used to compare and select the best reference gene with stable expression across the human adrenal samples [48]. Reference genes with significantly different Ct values (p-value < 0.01) between the samples were excluded. Furthermore, primer efficiency and the associated correlation coefficient R2 of the selected reference gene were determined by the standard curve method in serially diluted cDNA samples [49]. In the case of miRNA reference genes, miR-16-5p [48,50,51] and RNU6B [52] previously used in similar studies were compared. MiR-16-5p was found to show the most stable expression levels across the samples with a p-value of 0.452 in comparison to RNU6B which had a p-value of 0.001. In the case of RNA reference genes, PPIA [53] and GAPDH [54] were compared. Here, PPIA was found to show the most stable expression levels across the samples with a p-value of 0.019 in comparison to GAPDH which had a p-value of 0.003. Therefore, these genes were used for the normalization of miRNA and RNA expression in human adrenal samples.
4.4. Target Screening
In silico prediction of the possible miRNA targets was performed using the miRNA target database, TargetScan, and miRTarBase [19,37]. The top predicted targets were further screened based on their expression status in the RNA-seq data from the adrenocortical tissues of CPA, PBMAH, and controls (unpublished data). Pathway analyses of the targets were performed using Reactome [55] and Panther [56] online platforms. The selected downregulated targets were analyzed by QPCR in the adrenocortical samples to confirm their expression status. The successfully validated candidates were then analyzed for regulation by the miRNA using a dual luciferase assay [57].
4.5. Dual Luciferase Assay
The interaction between the predicted 3′-UTR region of Cyb5a and miR-1247-5p was detected using a luciferase activity assay. The 3′UTR sequences of Cyb5a (129 bp) containing the predicted miR-1247-5p binding sites (psiCHECK-2 Cyb5a 3′UTR WT) were cloned into the psiCHECK-2 vector (Promega, Fitchburg, WI, USA). A QuikChange Site-Directed Mutagenesis kit (Agilent Technologies, CA, USA) was used to mutate the miR-1247-5p binding site (psiCHECK-2 Cyb5a 3′UTR mutant) according to the manufacturer’s protocol. All the sequences were verified by Sanger sequencing. Then, 200 ng of the plasmid was used for each transfection. Synthetic miR-1247-5p mimics and specific oligonucleotides that inhibit endogenous miR-1247-5p (miR-1247-5p inhibitors) were purchased from Promega and 100 nmol of the molecules were used for each transfection according to the manufacturer’s protocol. For the assay, HeLa cells were seeded in 96-well plates and incubated for 24 h. The following day, cells were transfected using the following different conditions: (1) psiCHECK-2 Cyb5a 3′UTR WT + miR-1247-5p mimic; (2) psiCHECK-2 Cyb5a 3′UTR WT + miR-1247-5p inhibitor; (3) psiCHECK-2 Cyb5a 3′UTR WT + water; (4) psiCHECK-2 Cyb5a 3′UTR mutant + miR-1247-5p mimic; (5) psiCHECK-2 Cyb5a 3′UTR mutant + miR-1247-5p inhibitor; (6) psiCHECK-2 Cyb5a 3′UTR mutant + water. Forty-eight hours later, luciferase activity in the cells was measured using the dual luciferase assay system (Promega, Fitchburg, WI, USA) in accordance with the manufacturer’s instructions. Renilla luciferase activity was normalized to firefly luciferase activity. Each treatment was performed in triplicate. Any interaction between the cloned gene, Cyb5a (WT and mutant), and miR-1247-5p mimic is accompanied by a decrease in luminescence. This decrease in luminescence would not be observed when the plasmids are transfected with the miR-1247-5p inhibitor, indicating that observed luminescence differences are caused by specific interactions between the plasmid and the miR-1247-5p mimic. Transfection of the plasmid with water corrects any background interactions between the cloned gene and endogenous miRNAs in the culture.
4.6. In Vivo ACTH Stimulation
Experiments were performed on 13-week-old C57BL/6 J female mice (Janvier, Le Genest-Saint-Isle, France). Mice were intraperitoneally injected with 1 mg/kg of ACTH (Sigma Aldrich, Munich, Germany) and adrenals were collected after 10, 30, and 60 min of injections. In addition, control adrenals were collected from mice at baseline conditions (0 min). Mice were killed by cervical dislocation and adrenals were isolated, snap-frozen in liquid nitrogen, and stored at −80 °C for later RNA extraction. MiR-26a was taken as a housekeeping gene in the QPCR [58]. All mice were maintained in accordance with facility guidelines on animal welfare and approved by Landesdirektion Sachsen, Chemnitz, Germany.
4.7. Statistical Analysis and Software
R version 3.6.1 was used for the statistical analyses. To identify RNAs differentially expressed, a generalized linear model (GLM, a flexible generalization of ordinary linear regression that allows for variables that have distribution patterns other than a normal distribution) in the software package edgeR (Empirical Analysis of DGE in R) was employed to calculate p-values [45,59]. p-values were adjusted using the Benjamin–Hochberg false discovery rate (FDR) procedure [60]. Disease groups were compared using the unpaired Mann–Whitney test, and to decrease the false discovery rate a corrected p-value was calculated using the Benjamin–Hochberg method. p adjusted < 0.05 and log2 fold change >1.25 was applied as the cut-off for significance for NGS data. GraphPad Prism Version 8 was used for the statistical analysis of QPCR. To calculate differential gene expression, the dCt method (delta Ct (cycle threshold) value equals target miRNA’s Ct minus housekeeping miRNA’s Ct) was used (Microsoft Excel 2016, Microsoft, Redmond, WA, USA). For QPCR, an ANOVA test with Bonferroni correction was used [61] to assess significance; p-values < 0.05 were considered significant.
5. Conclusions
In conclusion, while comprehensive information regarding the role of miRNAs in acute and chronic phases of steroidogenesis is available, there is little known about the pathological independent role of miRNAs in the pathology of CS. In our study, we have described ACTH-independent miR-1247-5p and miR-379-5p expression in CS for the first time. Thus, by regulating different genes in the WNT signaling pathway, the miRNAs may individually contribute to the Cushing’s pathology in specific subtypes.
Conceptualization, S.V., A.C. and A.R.; methodology, S.V., R.Z. and M.E.; software, S.V. and M.E.; validation, R.Z., A.O., D.W. and B.W.; formal analysis, S.V.; investigation, S.V., R.Z., M.E., A.O. and D.W.; resources, A.C., B.W., M.R. and A.R.; data curation, S.V. and R.Z.; writing—original draft preparation, S.V., R.Z. and A.R.; writing—review and editing, S.S., M.R. and A.R.; visualization, S.V.; supervision, A.R.; project administration, A.R.; funding acquisition, A.C., S.S., M.R. and A.R. All authors have read and agreed to the published version of the manuscript.
Funding
This work was supported by a grant from the Deutsche Forschungsgemeinschaft (DFG) (within the CRC/Transregio 205/1 “The Adrenal: Central Relay in Health and Disease”) to A.C., B.W., S.S., M.R. and A.R., and individual grant SB 52/1-1 to S.S. This work is part of the German Cushing’s Registry CUSTODES and has been supported by a grant from the Else Kröner-Fresenius Stiftung to MR (2012_A103 and 2015_A228). A.R. was supported by the FöFoLe Program of the Ludwig Maximilian University, Munich. We thank I. Shapiro, A. Parl, C. Kühne, and S. Zopp for their technical support.
Institutional Review Board Statement
The study was conducted according to the guidelines of the Declaration of Helsinki and approved by the Ethics Committee of the Ludwig Maximilian University, Munich (protocol code 379-10, 152-10 and 20 July2021).
Informed Consent Statement
Informed consent was obtained from all subjects involved in the study.
Data Availability Statement
The miRNA-seq data generated in this study have been submitted to the NCBI (PRJNA847385).
Conflicts of Interest
The authors declare no conflict of interest.
References
Kotłowska, A.; Puzyn, T.; Sworczak, K.; Stepnowski, P.; Szefer, P. Metabolomic biomarkers in urine of cushing’s syndrome pa-tients. Int. J. Mol. Sci. 2017, 18, 294. [Google Scholar] [CrossRef] [PubMed][Green Version]
Valassi, E.; Tabarin, A.; Brue, T.; Feelders, R.A.; Reincke, M.; Netea-Maier, R.; Toth, M.; Zacharieva, S.; Webb, S.M.; Tsagarakis, S.; et al. High mortality within 90 days of diagnosis in patients with Cushing’s syndrome: Results from the ERCUSYN registry. Eur. J. Endocrinol. 2019, 181, 461–472. [Google Scholar] [CrossRef]
Stratakis, C. Cushing syndrome caused by adrenocortical tumors and hyperplasias (corticotropin-independent Cushing syn-drome). Endocr. Dev. 2008, 13, 117–132. [Google Scholar]
Bimpaki, E.I.; Iliopoulos, D.; Moraitis, A.; Stratakis, C.A. MicroRNA signature in massive macronodular adrenocortical disease and implications for adrenocortical tumorigenesis. Clin. Endocrinol. 2010, 72, 744–751. [Google Scholar] [CrossRef]
Vetrivel, S.; Zhang, R.; Engel, M.; Altieri, B.; Braun, L.; Osswald, A.; Bidlingmaier, M.; Fassnacht, M.; Beuschlein, F.; Reincke, M.; et al. Circulating microRNA Expression in Cushing’s Syndrome. Front. Endocrinol. 2021, 12, 10. [Google Scholar] [CrossRef] [PubMed]
O’Brien, J.; Hayder, H.; Zayed, Y.; Peng, C. Overview of microRNA biogenesis, mechanisms of actions, and circulation. Front. Endocrinol. 2018, 9, 402. [Google Scholar] [CrossRef][Green Version]
Butz, H.; Patócs, A. MicroRNAs in endocrine tumors. Electron. J. Int. Fed. Clin. Chem. Lab. Med. 2019, 30, 146–164. [Google Scholar]
Riester, A.; Issler, O.; Spyroglou, A.; Rodrig, S.H.; Chen, A.; Beuschlein, F. ACTH-Dependent Regulation of MicroRNA As Endogenous Modulators of Glucocorticoid Receptor Expression in the Adrenal Gland. Endocrinology 2012, 153, 212–222. [Google Scholar] [CrossRef][Green Version]
Huang, X.; Zhong, R.; He, X.; Deng, Q.; Peng, X.; Li, J.; Luo, X. Investigations on the mechanism of progesterone in inhibiting endo-metrial cancer cell cycle and viability via regulation of long noncoding RNA NEAT1/microRNA-146b-5p mediated Wnt/β-catenin signaling. IUBMB Life 2019, 71, 223–234. [Google Scholar] [CrossRef][Green Version]
Azhar, S.; Dong, D.; Shen, W.-J.; Hu, Z.; Kraemer, F.B. The role of miRNAs in regulating adrenal and gonadal steroidogenesis. J. Mol. Endocrinol. 2020, 64, R21–R43. [Google Scholar] [CrossRef]
Allen, M.J.; Sharma, S. Physiology, Adrenocorticotropic Hormone (ACTH). StatPearls 2021. Available online: https://www.ncbi.nlm.nih.gov/books/NBK500031/ (accessed on 8 December 2021).
Hu, Z.; Shen, W.-J.; Cortez, Y.; Tang, X.; Liu, L.-F.; Kraemer, F.B.; Azhar, S. Hormonal Regulation of MicroRNA Expression in Steroid Producing Cells of the Ovary, Testis and Adrenal Gland. PLoS ONE 2013, 8, e78040. [Google Scholar] [CrossRef][Green Version]
Ghayee, H.K.; Rege, J.; Watumull, L.M.; Nwariaku, F.E.; Carrick, K.S.; Rainey, W.E.; Miller, W.L.; Auchus, R.J. Clinical, biochemical, and molecular characterization of macronodular adrenocortical hyperplasia of the zona reticularis: A new syndrome. J. Clin. Endocrinol. Metab. 2011, 96, E243–E250. [Google Scholar] [CrossRef] [PubMed][Green Version]
Grumolato, L.; Liu, G.; Mong, P.; Mudbhary, R.; Biswas, R.; Arroyave, R.; Vijayakumar, S.; Economides, A.N.; Aaronson, S.A. Canonical and noncanonical Wnts use a common mechanism to activate completely unrelated coreceptors. Genes Dev. 2010, 24, 2517–2530. [Google Scholar] [CrossRef][Green Version]
Tauriello, D.V.F.; Jordens, I.; Kirchner, K.; Slootstra, J.W.; Kruitwagen, T.; Bouwman, B.A.M.; Noutsou, M.; Rüdiger, S.G.D.; Schwamborn, K.; Schambony, A.; et al. Wnt/β-catenin signaling requires interaction of the Dishevelled DEP domain and C terminus with a discontinuous motif in Frizzled. Proc. Natl. Acad. Sci. USA 2012, 109, E812–E820. [Google Scholar] [CrossRef][Green Version]
Colli, L.M.; Saggioro, F.; Neder Serafini, L.; Camargo, R.C.; Machado, H.; Moreira, A.C.; Antonini, S.R.; De Castro, M. Components of the Canonical and Non-Canonical Wnt Pathways Are Not Mis-Expressed in Pituitary Tumors. PLoS ONE 2013, 8, e62424. [Google Scholar] [CrossRef] [PubMed][Green Version]
Rosanò, L.; Cianfrocca, R.; Tocci, P.; Spinella, F.; Di Castro, V.; Caprara, V.; Semprucci, E.; Ferrandina, G.; Natali, P.G.; Bagnato, A. En-dothelin A receptor/β-arrestin signaling to the Wnt pathway renders ovarian cancer cells resistant to chemotherapy. Cancer Res. 2014, 74, 7453–7464. [Google Scholar] [CrossRef] [PubMed][Green Version]
Zhang, H.; Qiu, J.; Ye, C.; Yang, D.; Gao, L.; Su, Y.; Tang, X.; Xu, N.; Zhang, D.; Xiong, L.; et al. ROR1 expression correlated with poor clinical outcome in human ovarian cancer. Sci. Rep. 2014, 4, 5811. [Google Scholar] [CrossRef] [PubMed][Green Version]
Gao, Y.; Li, S.; Li, Q. Uterine epithelial cell proliferation and endometrial hyperplasia: Evidence from a mouse model. Mol. Hum. Reprod. 2014, 20, 776–786. [Google Scholar] [CrossRef]
Orang, A.V.; Safaralizadeh, R.; Kazemzadeh-Bavili, M. Mechanisms of miRNA-Mediated Gene Regulation from Common Downregulation to mRNA-Specific Upregulation. Int. J. Genom. 2014, 2014, 970607. [Google Scholar]
Robinson, M.D.; McCarthy, D.J.; Smyth, G.K. EdgeR: A Bioconductor package for differential expression analysis of digital gene expression data. Bioinformatics 2010, 26, 139–140. [Google Scholar] [CrossRef][Green Version]
Liu, C.-H.; Di, Y.P. Analysis of RNA Sequencing Data Using CLC Genomics Workbench. Methods Mol. Biol. 2020, 2102, 61–113. [Google Scholar] [CrossRef]
Pfaffl, M.W.; Tichopad, A.; Prgomet, C.; Neuvians, T.P. Determination of stable housekeeping genes, differentially regulated target genes and sample integrity: BestKeeper–Excel-based tool using pair-wise correlations. Biotechnol. Lett. 2004, 26, 509–515. [Google Scholar] [CrossRef]
Wang, X.; Zhang, X.; Yuan, J.; Wu, J.; Deng, X.; Peng, J.; Wang, S.; Yang, C.; Ge, J.; Zou, Y. Evaluation of the performance of serum miRNAs as normalizers in microRNA studies focused on cardiovascular disease. J. Thorac. Dis. 2018, 10, 2599–2607. [Google Scholar] [CrossRef]
Geigges, M.; Gubser, P.M.; Unterstab, G.; Lecoultre, Y.; Paro, R.; Hess, C. Reference Genes for Expression Studies in Human CD8 + Naïve and Effector Memory T Cells under Resting and Activating Conditions. Sci. Rep. 2021, 10, 9411. [Google Scholar] [CrossRef]
Song, J.; Bai, Z.; Han, W.; Zhang, J.; Meng, H.; Bi, J.; Ma, X.; Han, S.; Zhang, Z. Identification of Suitable Reference Genes for qPCR Analysis of Serum microRNA in Gastric Cancer Patients. Dig. Dis. Sci. 2011, 57, 897–904. [Google Scholar] [CrossRef]
Szabó, D.R.; Luconi, M.; Szabó, P.M.; Tóth, M.; Szücs, N.; Horányi, J.; Nagy, Z.; Mannelli, M.; Patócs, A.; Rácz, K.; et al. Analysis of cir-culating microRNAs in adrenocortical tumors. Lab. Investig. 2014, 94, 331–339. [Google Scholar] [CrossRef][Green Version]
Butz, H.; Mészáros, K.; Likó, I.; Patocs, A. Wnt-Signaling Regulated by Glucocorticoid-Induced miRNAs. Int. J. Mol. Sci. 2021, 22, 11778. [Google Scholar] [CrossRef] [PubMed]
Muñoz, J.J.; Anauate, A.C.; Amaral, A.G.; Ferreira, F.M.; Watanabe, E.H.; Meca, R.; Ormanji, M.S.; Boim, M.A.; Onuchic, L.F.; Heilberg, I.P. Ppia is the most stable housekeeping gene for qRT-PCR normalization in kidneys of three Pkd1-deficient mouse models. Sci. Rep. 2021, 11, 19798. [Google Scholar] [CrossRef] [PubMed]
Xia, X.; Liu, Y.; Liu, L.; Chen, Y.; Wang, H. Selection and verification of the combination of reference genes for RT-qPCR analysis in rat adrenal gland development. J. Steroid. Biochem. Mol. Biol. 2021, 208, 105821. [Google Scholar] [CrossRef] [PubMed]
Gillespie, M.; Jassal, B.; Stephan, R.; Milacic, M.; Rothfels, K.; Senff-Ribeiro, A.; Griss, J.; Sevilla, C.; Matthews, L.; Gong, C.; et al. The reactome pathway knowledgebase 2022. Nucleic Acids Res. 2022, 50, D687–D692. [Google Scholar] [CrossRef]
Mi, H.; Ebert, D.; Muruganujan, A.; Mills, C.; Albou, L.-P.; Mushayamaha, T.; Thomas, P.D. PANTHER version 16: A revised family classification, tree-based classification tool, enhancer regions and extensive API. Nucleic Acids Res. 2021, 49, D394–D403. [Google Scholar] [CrossRef]
Wu, T.; Lin, Y.; Xie, Z. MicroRNA-1247 inhibits cell proliferation by directly targeting ZNF346 in childhood neuroblastoma. Biol. Res. 2018, 51, 13. [Google Scholar] [CrossRef][Green Version]
Love, M.I.; Huber, W.; Anders, S. Moderated estimation of fold change and dispersion for RNA-seq data with DESeq2. Genome Biol. 2014, 15, 550. [Google Scholar] [CrossRef][Green Version]
Hu, Z.; Gao, S.; Lindberg, D.; Panja, D.; Wakabayashi, Y.; Li, K.; Kleinman, J.E.; Zhu, J.; Li, Z. Temporal dynamics of miRNAs in human DLPFC and its association with miRNA dysregulation in schizophrenia. Transl. Psychiatry 2019, 9, 196. [Google Scholar] [CrossRef]
Esteva-Socias, M.; Gómez-Romano, F.; Carrillo-Ávila, J.A.; Sánchez-Navarro, A.L.; Villena, C. Impact of different stabilization methods on RT-qPCR results using human lung tissue samples. Sci. Rep. 2020, 10, 3579. [Google Scholar] [CrossRef]
Publisher’s Note: MDPI stays neutral with regard to jurisdictional claims in published maps and institutional affiliations.
Neuroendocrine tumors can cause ectopic Cushing syndrome, and most patients have metastatic disease at diagnosis. We identified risk factors for outcome, evaluated ectopic Cushing syndrome management, and explored the role of bilateral adrenalectomy in this population.
Methods
This was a retrospective study including patients with diagnosis of ectopic Cushing Syndrome secondary to neuroendocrine tumors with adrenocorticotropic hormone secretion treated at our quaternary referral center over a 40-year period (1980–2020).
Results
Seventy-six patients were included. Mean age at diagnosis was 46.3 ± 15.8 years. Most patients (N = 61, 80%) had metastases at ectopic Cushing syndrome diagnosis. Average follow-up was 2.9 ± 3.7 years (range, 4 months–17.2 years). Patients with neuroendocrine tumors before ectopic Cushing syndrome had more frequent metastatic disease and resistant ectopic Cushing syndrome. Patients with de novo hyperglycemia, poor neuroendocrine tumor differentiation, and metastatic disease had worse survival. Of those with nonmetastatic disease, 8 (53%) had ectopic Cushing syndrome resolution after neuroendocrine tumor resection, 3 (20%) were medically controlled, and 4 (27%) underwent bilateral adrenalectomy. In patients with metastatic neuroendocrine tumors, hypercortisolism was initially medically managed in 92%, 3% underwent immediate bilateral adrenalectomy, 2% had control after primary neuroendocrine tumor debulking, and 2% were lost to follow-up. Medical treatment resulted in hormonal control in 7 (13%) patients. Of the 49 patients with metastatic disease and medically resistant ectopic Cushing syndrome, 23 ultimately had bilateral adrenalectomy with ectopic Cushing syndrome cure in all.
Conclusion
Patients with neuroendocrine tumors before ectopic Cushing syndrome development were more likely metastatic and had worse survival. De novo hyperglycemia and poor neuroendocrine tumor differentiation were predictive of worse prognosis. Medical control of hypercortisolism is difficult to achieve in patients with neuroendocrine tumors–ectopic Cushing syndrome. Well-selected patients may benefit from bilateral adrenalectomy early in the treatment algorithm, and multidisciplinary management is essential in this complex disease.
Bilateral adrenalectomy (BA) still plays an important role in the management of Cushing’s disease (CD). Nelson’s syndrome (NS) is a severe complication of BA, but conflicting data on its prevalence and predicting factors have been reported. The aim of this study was to determine the prevalence of NS, and identify factors associated with its development.
Data sources
Systematic literature search in four databases.
Study Selection
Observational studies reporting the prevalence of NS after BA in adult patients with CD.
Data extraction
Data extraction and risk of bias assessment were performed by three independent investigators.
Data synthesis
Thirty-six studies, with a total of 1316 CD patients treated with BA, were included for the primary outcome. Pooled prevalence of NS was 26% (95% CI 22–31%), with moderate to high heterogeneity (I2 67%, P < 0.01). The time from BA to NS varied from 2 months to 39 years. The prevalence of NS in the most recently published studies, where magnet resonance imaging was used, was 38% (95% CI 27–50%). The prevalence of treatment for NS was 21% (95% CI 18–26%). Relative risk for NS was not significantly affected by prior pituitary radiotherapy [0.9 (95% CI 0.5–1.6)] or pituitary surgery [0.6 (95% CI 0.4–1.0)].
Conclusions
Every fourth patient with CD treated with BA develops NS, and every fifth patient requires pituitary-specific treatment. The risk of NS may persist for up to four decades after BA. Life-long follow-up is essential for early detection and adequate treatment of NS.
Introduction
Cushing´s disease (CD) is a rare disorder associated with excess morbidity and increased mortality [1, 2]. Previously, bilateral adrenalectomy (BA) was the mainstay treatment for CD. During the last decades, however, other treatment modalities have emerged, including pituitary surgery, radiotherapy and medical treatments. Despite this, BA is still considered when other treatment options have failed to achieve remission, or when a rapid relief of hypercortisolism is necessary [3].
BA is considered to be a safe and effective treatment for CD [4], especially after the laparoscopic approach was introduced during the 1990s [5]. There are, however, significant drawbacks with BA, mainly the unavoidable chronic adrenal insufficiency, as well as the risk for Nelson’s syndrome (NS), i.e., growth of the remaining pituitary tumor and excessive production of ACTH, that may cause optic nerve or chiasmal compression and mucocutaneous hyperpigmentation [6].
The prevalence of NS varies between studies, mainly due to a lack of consensus on the definition and diagnostic criteria for the syndrome [7, 8]. Previously published studies are also inconsistent as to whether factors such as previous radiotherapy, age at BA, gender and duration of CD, may affect the risk of developing NS. Furthermore, high ACTH concentrations after BA have been suggested as a risk factor for developing NS [9,10,11,12].
Thus, the primary aim of this systematic review and meta-analysis was to estimate the prevalence of NS after BA for CD, both the total prevalence of NS as well the prevalence of NS requiring treatment with pituitary surgery and/or radiotherapy. The secondary aim was to investigate risk factors associated with development of NS.
Methods
A systematic review and meta-analysis was conducted according to the Preferred Reporting Items for Systematic Reviews and Meta-Analyses (PRISMA) [13]. The PICO process was applied for the definition of the research question and eligibility criteria for the literature search. The protocol of this review was registered in the PROSPERO database (CRD42020163918).
Search strategy
We searched PubMed, Embase, Cochrane Library and Web of Science on February 25th 2020, with no start date restriction, for relevant articles by using the following terms: “Cushing´s syndrome” or “Cushing´s disease” or “Hypercortisolism” or “Pituitary ACTH hypersecretion” or “corticotroph tumor” or “corticotroph tumors” or “corticotroph adenoma” or “corticotroph adenomas” or “corticotropinoma” or “corticotropinomas” or “corticotrophinoma” or “corticotrophinomas” or “ACTH pituitary adenoma” or “ACTH pituitary adenomas” or “adrenocorticotropin pituitary adenoma” or “adrenocorticotropin pituitary adenomas” AND “bilateral adrenalectomy” or “bilateral adrenalectomies” or “total adrenalectomy” or “total adrenalectomies”. A detailed description of the search strategy is given in the Supplementary. Also, references of the included studies and relevant review articles were checked manually for additional articles. A new search was performed on January 12th 2021, prior submission, to identify any new publications.
Study selection and eligibility criteria
Eligible studies were observational studies (cohort or cross-sectional studies) reporting the prevalence of NS in adult patients with CD treated with BA. Studies including only children (age < 18 years), review articles, letters, commentaries and meeting abstracts were excluded. Moreover, case reports, case-series and studies with a population of fewer than 10 cases were excluded. Also, studies written in languages other than English were not considered for inclusion.
Data collection process and data extraction
Titles and abstracts from all identified articles were screened for eligibility and further full-text assessment by three independent investigators (EP, MP, OR). Discrepancies were resolved through discussion and consensus. Duplicate articles and studies with overlapping populations were excluded. In the latter case, the publication with the largest population, more comprehensive information on relevant clinical variables and/or lowest risk of bias was included.
Full-text assessment and data extraction were conducted independently by the same investigators as above. Data on the following predefined variables were extracted: first author, year of publication, region/hospital, study period, characteristics of the study population (number of patients, gender, follow-up, age at CD, age at BA, previous treatment with radiotherapy and/or pituitary surgery, ACTH concentrations at BA, MRI findings at CD and at BA), intervention (BA as primary or secondary treatment, remission status) and outcome (criteria for NS, number of patients with NS, age at NS, time from BA to NS, ACTH concentrations one year after BA, number of patients treated for NS, type of treatment; pituitary radiotherapy and/or pituitary surgery).
One of the studies included in the meta-analysis is our nationwide Swedish study on CD [2]. Additional clinical data, not provided in the original publication, was retrieved and used in the current analysis (Table 1).Table 1 Characteristics of the included studiesFull size table
Risk of bias assessment
The Newcastle–Ottawa Scale [14], modified to suit the current study, was used for assessment of risk of bias of all included studies. Three investigators (EP, MP, OR) assessed the studies independently, and any disagreements were resolved by discussion. Selection, comparability and outcome were assessed through predefined criteria. All studies that provided information on NS as outcome, and/or corticotroph tumor progression, were included, and the definition as well as the treatment of NS were recorded (Table 1 and Table S1). A clear definition of NS and information on treatment were considered to be two of the most important components of the quality assessment. We considered the definition of NS to be clear when it included either a new visible pituitary tumor or progression of a pituitary tumor remnant following BA, alone, or in combination with high ACTH concentrations and/or hyperpigmentation. Detailed description of the criteria for the risk of bias assessment is provided in the Supplementary file. Studies with an overall score ≥ 5 (max overall grade 8) and a clear definition of NS, were considered to have a low risk of bias.
Data synthesis and statistical analysis
Primary endpoints were the prevalence of NS, as well as the prevalence of pituitary-specific treatment for NS. Descriptive data are presented as median (range or interquartile range; IQR). Meta-analysis was performed by using the meta package in R (version 4.0.3) [15]. Statistical pooling was performed according to random-effects model due to the clinical heterogeneity among the included studies [16]. For all analyses, indices of heterogeneity, I2 statistics and Cochrane’s Q test, are reported. For the primary outcomes we estimated pooled prevalence with 95% confidence intervals (95% CI). Statistical significance was defined as P < 0.05. The possibility of publication bias was assessed by visual inspection of funnel plots as well as with the Egger’s test [17].
Sensitivity analyses were performed by excluding studies with an overall risk of bias < 5, and studies where information on diagnostic criteria for NS was lacking. By choosing the overall risk of bias < 5, all studies without adequate follow-up were also excluded (Table S2). Also, another sensitivity analysis was performed by including all studies reporting the number of patients with NS who received treatment for NS (Table 1).
Subgroup analyses were performed to investigate factors that may affect the prevalence of NS, namely pituitary radiotherapy prior to BA, prophylactic pituitary radiotherapy, overall radiotherapy (prior to BA or prophylactic), pituitary surgery (transcranial or transsphenoidal surgery) prior to BA, and BA as primary or secondary treatment. For these outcomes, we estimated relative risks (RRs), or pooled prevalence, with 95% CIs. Also, in a subgroup analysis, the prevalence (with 95% CI) of NS and treatment for NS were estimated in studies where MRI was used at diagnosis and during follow-up.
Uni- and bivariate meta-regression was used to investigate whether the prevalence of NS was influenced by median follow-up time or age at BA. The meta-analysis was performed by using the Metareg command in R. The estimated association is reported as β coefficient.
Role of funding source
The funding source had no role in the design and conduction of the study; i.e., collection, management, analysis, and interpretation of the data; preparation, review, or approval of the manuscript; and decision to submit the manuscript for publication.
Results
Identification and description of included studies
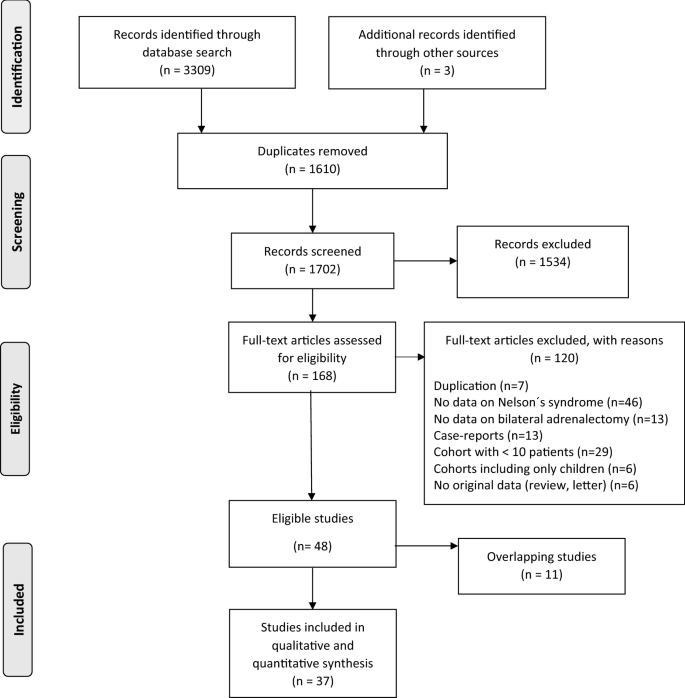
After removal of duplicates, 1702 articles were identified (Fig. 1). Three additional articles were found after checking the reference lists of identified articles and review papers. After reviewing titles, abstracts and full-text articles, 48 articles were considered eligible for further analysis. Of these, however, 11 articles were excluded due to overlapping or identical patient cohorts. Thus, 37 studies published between 1976 and 2020, were included in the current meta-analysis (Fig. 1). All studies had a retrospective observational design. Characteristics of the included studies are presented in Table 1. Two of the included studies had an overlapping cohort where one was used for the main outcome [18] and one [19] for the subgroup analyses on the influence of radiotherapy on the development of NS. An overview of risk of bias assessment of the eligible studies is provided in Table S2.
Fig. 1
In total, 1316 patients with CD treated with BA were included. The median follow-up after BA was 7 years (23 studies, range 3.3–22). Median age at BA in patients with NS was 31 years (13 studies, IQR 26–34). Median time from BA to the diagnosis of NS was 4 years (19 studies) with the shortest reported time being 2 months [20] and the longest 39 years [2]. At diagnosis of NS, hyperpigmentation was reported in 155 of 188 (82%) patients (19 studies) and chiasmal compression in 24 of 129 (19%) patients [11 studies].
Prevalence of NS
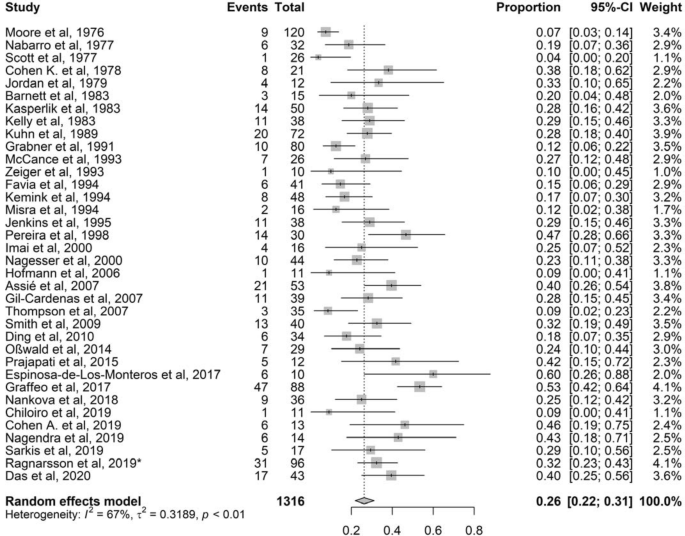
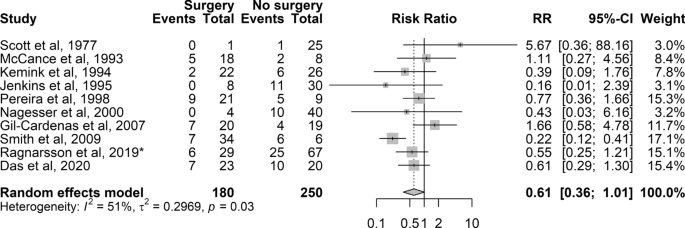
Thirty-six of 37 studies, with total 1316 patients with CD treated with BA, were included [2, 18, 20,21,22,23,24,25,26,27,28,29,30,31,32,33,34,35,36,37,38,39,40,41,42,43,44,45,46,47,48,49,50,51,52,53]. Reported prevalence of NS ranged from 4 to 60%. The mean pooled prevalence was 26% (95% CI 22–31%) with a moderate to high heterogeneity (I2 67%, P < 0.01) (Fig. 2). The Egger’s test was statistically significant (P = 0.01), but visual inspection showed no obvious asymmetry. The significant Egger’s test indicates publication bias, probably explained by the fact that case reports and cohorts with fewer than 10 participants were excluded (Fig. S1).
Fig. 2
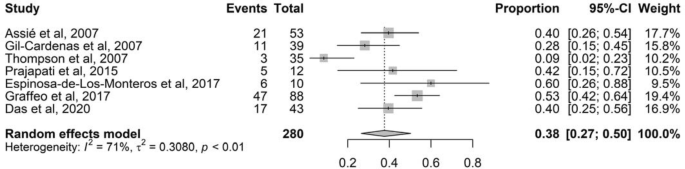
In a sensitivity analysis, excluding all studies with high risk of bias (overall score < 5) and no clear definition of NS, the pooled prevalence was 31% (95% CI 24–38%; I2 76%, 17 studies, 822 patients; P < 0.01) (Fig. S2). In a subgroup analysis, the prevalence of NS in studies where MRI was used at diagnosis and during follow-up was 38% (Fig. 3; 95% CI 27–50%; I2 71%, 7 studies, 280 patients; P < 0.01).
Fig. 3
Prevalence of treated NS
The pooled prevalence of treatment for NS was 21% (95% CI 18–26%; I2 52%, P < 0.01) (Table 1; 29 studies with 1074 patients). Thus, the pooled prevalence was slightly lower, compared to the pooled prevalence of NS in total, as well as the heterogeneity (Fig. S3). The funnel plot showed no asymmetry and Egger’s test was not statistically significant, indicating low possibility of publication bias (Fig. S4). In a subgroup analysis, the prevalence of treated NS in studies where MRI was used at diagnosis and during follow-up was 25% (95% CI 17–35%; I2 61%, 7 studies; P = 0.02).
The indication for treatment was progression of the pituitary tumor in 23 out of 28 patients (82%, five studies), optic chiasmal compression in 11 out of 91 patients (12%, 11 studies), while four patients out of 14 (one study) had both these indications for treatment. Twenty-six studies provided information on treatment modalities (pituitary surgery and/or radiotherapy). Seventy-three out of 201 patients with NS (36%) were treated with pituitary surgery, 86 (43%) with radiotherapy and 41 (20%) received both treatments.
Radiotherapy
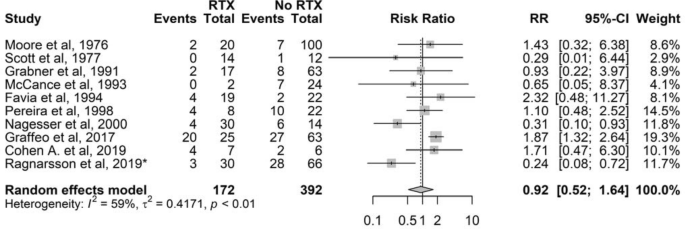
Nineteen studies provided information on radiotherapy prior to BA. However, nine studies had no events and no patients in one of the arms (radiotherapy or no radiotherapy) (Table S3). Thus, ten studies were eligible for further estimation, showing that the risk for NS in patients treated with radiotherapy prior to BA was comparable to the risk in patients not treated with radiotherapy (RR 0.9, 95% CI 0.5–1.6; 10 studies with 564 patients) (Fig. 4).
Fig. 4
Thirteen studies provided information on prophylactic radiotherapy. However, only one study provided applicable data for calculating RR, thus subgroup analysis was not performed (Table S4). In that study [20], none of the seventeen patients who received prophylactic radiotherapy developed NS, while 11 of 22 patients without radiotherapy developed NS after a mean follow-up of 4.4 years (range 10–16 years).
By using studies with information on either previous or prophylactic radiotherapy (11 studies with 603 patients; Table S5), the pooled RR was 0.8 (95% CI 0.5–1.5).
Pituitary surgery prior to BA
Of 21 studies with information on pituitary surgery prior to BA (Table S6), only ten provided information for estimation of RR. A pooled RR of 0.6 (10 studies with 430 patients; 95% CI 0.4–1.0) was found (Fig. 5), indicating that the risk for developing NS was not influenced by previous pituitary surgery.
Fig. 5
BA as primary or secondary treatment for CD
Information on whether patients with NS were treated primarily with BA or not, was provided in ten and nine studies, respectively (Fig. S5 and S6). The pooled prevalence of NS was 26% (95% CI 20–33%) for patients treated primarily with BA and 22% (95% CI 15–31%) for patients who had been treated with pituitary surgery and/or radiotherapy prior to BA.
ACTH concentrations one year after BA
Four studies provided information on ACTH concentrations during the first year after BA [45, 49, 52, 53]. In a study by Assié et al. the median ACTH concentration in patients who developed NS was 301 pmol/L, compared to 79 pmol/L in patients without NS (upper range of limit; URL 13 pmol/L) [52]. The median ACTH concentration in a study by Cohen et al. was 105 pmol/L in the NS group compared to 18 pmol/L in patients without NS (P = 0.007) (URL 10 pmol/L) [49]. Also, in a study by Das et al., there was a statistically significant difference in ACTH concentrations one year after BA between patients with and without NS (110 vs 21 pmol/L respectively; P = 0.002) [53]. On the contrary, Espinosa-de-Los-Monteros et al.found no difference in ACTH concentrations between the patients with NS and those without NS [45]. Thus, three of four studies found that high ACTH concentrations one year after BA were associated with the development of NS. However, since the ACTH assays and the conditions when ACTH was collected were different in these studies (Table S7), further comparison or a meta-analysis on ACTH levels after BA was not considered feasible.
Influence of age at BA and duration of follow-up on prevalence of NS
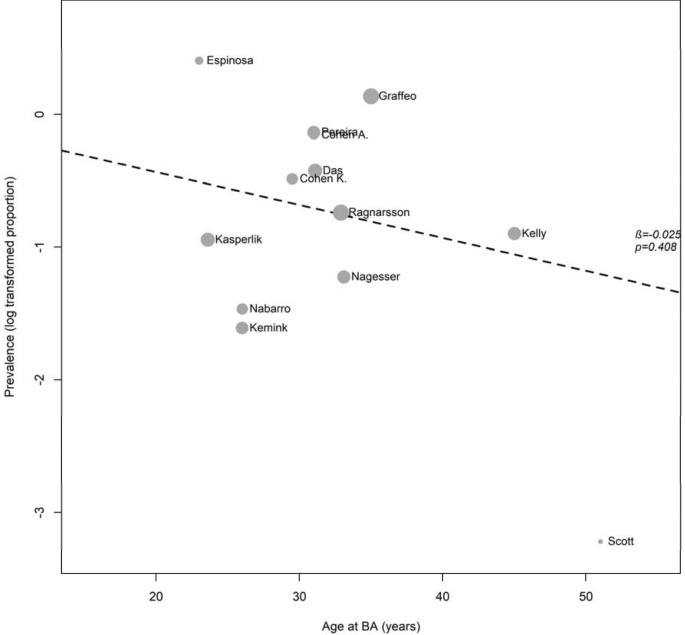
In a meta-regression analysis, age at BA (β-coefficient = – 0.03, P = 0.4; Fig. 6) and median duration of follow-up (β-coefficient = 0.01, P = 0.7; Fig. S7) were not associated with prevalence of NS. After adjustment for follow-up, age at BA was still not associated with prevalence of NS (β-coefficient = -0.03, P = 0.4).
Fig. 6
Discussion
In this study we have for the first time evaluated the pooled prevalence of NS by using a meta-analysis on data from 36 studies, including more than 1300 patients with CD treated with BA. The overall prevalence of NS was 26% and the median time from BA to diagnosis of NS was 4 years, ranging from 0.2 to 39 years. The prevalence of patients requiring pituitary-specific treatment for NS was 21%. Furthermore, radiotherapy and pituitary surgery prior to BA, as well as age at BA, did not seem to affect the risk of developing NS.
Various definitions have been used for NS over the past decades [12]. Historically, the diagnosis was based on clinical findings related to mucocutaneous hyperpigmentation and chiasmal compression, together with signs of an enlarged sella turcica on skull radiography [6]. Since then, the diagnosis of NS in most studies has been based on (i) radiological evidence of a pituitary tumor that becomes visible, or a progression of a preexisting tumor, (ii) “high” ACTH concentrations, and (iii) hyperpigmentation [54]. In the studies with the highest prevalence of NS [45, 46], the diagnosis was based on rising ACTH concentrations and an expanding pituitary mass, where 2 mm increment in tumor size on MRI was considered to be a significant growth. On the contrary, the criteria for NS in studies with the lowest prevalence were based on hyperpigmentation, often but not always combined with a pituitary tumor responding to radiotherapy and/or a radiographic evidence of pituitary tumor on skull radiography [21, 23]. Thus, the great variance in the prevalence of NS between studies can, at least partly, be explained by the different definitions of NS. Consequently, in an expert opinion published in 2010, it was suggested that the diagnosis of NS should be based on an elevated level of ACTH >500 ng/L (110 pmol/L) in addition to rising levels of ACTH on at least three consecutive occasions and/or an expanding pituitary mass on MRI or CT following BA [54]. Similarly, in a recently published expert consensus recommendation, based on a systematic review, it was suggested that NS should be defined as radiological progression or new detection of a pituitary tumor on a thin-section MRI [55]. Furthermore, the authors recommend active surveillance with MRI three months after BA, and every 12 months for the first 3 years, and every 2–4 years thereafter, based on clinical findings. The meta-regression of the current analysis did not show an association between median follow-up time and prevalence of NS. Nevertheless, NS occurred as early as 2 months [20], and up to 39 years after BA [2], supporting that life-long surveillance after BA is necessary for patients with CD.
Active surveillance with MRI was more common in studies published during the last two decades. In fact, the use of MRI in recent studies resulted in earlier detection of a growing pituitary adenoma and, subsequently, contributed to a higher prevalence of NS. Namely, the seven studies including patients treated with BA after 1990 and using MRI reported higher prevalence of NS, both overall NS and treated NS.
Whether factors such as pituitary radiotherapy affects the risk for development of NS has been evaluated in several studies. Some studies have shown that radiotherapy prior to BA, or administrated prophylactically, can prevent or delay the development of NS [20, 39]. On the contrary, other studies have not demonstrated a protective effect of radiotherapy prior to BA [18, 37] and, moreover, one study found an association with tumor progression [46]. Nevertheless, the current meta-analysis indicates that radiotherapy prior to BA does not decrease the risk of developing NS. Neither did previous pituitary surgery affect the risk for NS.
Elevated ACTH concentrations during the first year after BA have been considered to be a strong predictor of NS [49, 52]. In fact, seven studies in the current analysis included cut-off levels for ACTH concentration, arbitrarily defined, for the diagnosis of NS [18, 25, 34, 36, 41, 45, 49]. Due to the different ACTH assays, and different conditions when ACTH was collected, no further analysis on ACTH levels was performed. Nevertheless, four studies [45, 49, 52, 53] reported ACTH concentrations one year after BA in both patients with and without NS. Three of these studies found that high ACTH concentrations one year after BA [49, 52, 53] were associated with pituitary tumor progression. Thus, these findings support the suggestion that ACTH should be monitored following BA in patients with CD [54, 55].
The prevalence of treatment for NS (21%), and the heterogeneity index (52%), were slightly lower than in the analysis of total prevalence of NS (26%, I2 67%). The majority of the patients was treated with radiotherapy, followed by pituitary surgery and combination of pituitary surgery and radiotherapy. Today, surgical removal of the pituitary tumor is considered to be the first-line therapy of NS whereas radiotherapy is considered if surgery has failed or is not possible [12, 54, 56]. In a large multi-center study by Fountas et al., the 10-year progression-free survival rates after surgery alone, or with radiotherapy, for patients with NS was 80% and 81%, respectively [57]. In comparison, progression-free survival rate in patients who did not receive treatment was 51%. Reports on the efficacy of medical therapy for NS have shown inconsistent results [56].
Strengths and limitations
This is the largest systematic review, and the first meta-analysis, on NS published to date. However, some limitations have to be acknowledged. Most important are the different diagnostic methods used to detect NS, and the different definitions of the syndrome between the studies. The majority of the studies have used the combination of hyperpigmentation, high ACTH concentrations and radiological findings for the diagnosis of NS. Notwithstanding these common criteria, there were still differences in the cut-offs of ACTH levels, the use of different radiological modalities over time as well as the radiological definition of progress of pituitary tumors. Moreover, in some studies radiological findings were used solely or in combination with either hyperpigmentation and/or bitemporal hemianopsia, ACTH concentrations or response to treatment of NS. Furthermore, in several studies a clear definition of NS was not provided. Nevertheless, we consider our attempt to address the heterogeneity of the included studies, through systematic review, quality assessment, and sensitivity and subgroup analyses to be a strength.
Conclusions
The risk of NS after BA in patients with CD is considerable and may first become clinically evident many decades later. Thus, life-long close follow-up is necessary for an early detection of a growing pituitary tumor, and adequate treatment when needed. Although this meta-analysis did not find prior surgery or radiotherapy to be associated with risk of NS, the findings are based on a limited number of studies. Thus, in order to individualize the treatment for patients with CD, further studies are needed where these and other factors possibly associated with risk of NS are evaluated.
Data availability
The data generated or analyzed during this study are included in this published article or in the Supplementary file.
Abbreviations
CD:
Cushing’s diseaseBA:
Bilateral adrenalectomyNS:
Nelson’s syndromeACTH:
Adrenocorticotropic hormoneRR:
Relative riskMRI:
Magnet resonance imagingCT:
Computer tomography
References
1.Papakokkinou E, Olsson DS, Chantzichristos D, Dahlqvist P, Segerstedt E, Olsson T, Petersson M, Berinder K, Bensing S, Hoybye C, Eden-Engstrom B, Burman P, Bonelli L, Follin C, Petranek D, Erfurth EM, Wahlberg J, Ekman B, Akerman AK, Schwarcz E, Bryngelsson IL, Johannsson G, Ragnarsson O (2020) Excess morbidity persists in patients with cushing’s disease during long-term remission: a swedish nationwide study. J Clin Endocrinol Metab 105(8):2616–2624
2.Ragnarsson O, Olsson DS, Papakokkinou E, Chantzichristos D, Dahlqvist P, Segerstedt E, Olsson T, Petersson M, Berinder K, Bensing S, Hoybye C, Eden-Engstrom B, Burman P, Bonelli L, Follin C, Petranek D, Erfurth EM, Wahlberg J, Ekman B, Akerman AK, Schwarcz E, Bryngelsson IL, Johannsson G (2019) Overall and disease-specific mortality in patients with cushing disease: a swedish nationwide study. J Clin Endocrinol Metab 104(6):2375–2384PubMedArticleGoogle Scholar
3.Nieman LK, Biller BM, Findling JW, Murad MH, Newell-Price J, Savage MO, Tabarin A, Endocrine S (2015) Treatment of cushing’s syndrome: an endocrine society clinical practice guideline. J Clin Endocrinol Metab 100(8):2807–2831CASPubMedPubMed CentralArticleGoogle Scholar
4.Ritzel K, Beuschlein F, Mickisch A, Osswald A, Schneider HJ, Schopohl J, Reincke M (2013) Clinical review: outcome of bilateral adrenalectomy in Cushing’s syndrome: a systematic review. J Clin Endocrinol Metab 98(10):3939–3948CASPubMedArticleGoogle Scholar
5.Reincke M, Ritzel K, Osswald A, Berr C, Stalla G, Hallfeldt K, Reisch N, Schopohl J, Beuschlein F (2015) A critical reappraisal of bilateral adrenalectomy for ACTH-dependent Cushing’s syndrome. Eur J Endocrinol 173(4):M23-32CASPubMedArticleGoogle Scholar
6.Nelson DH, Meakin JW, Dealy JB Jr, Matson DD, Emerson K Jr, Thorn GW (1958) ACTH-producing tumor of the pituitary gland. N Engl J Med 259(4):161–164CASPubMedArticleGoogle Scholar
7.Guerin C, Taieb D, Treglia G, Brue T, Lacroix A, Sebag F, Castinetti F (2016) Bilateral adrenalectomy in the 21st century: when to use it for hypercortisolism? Endocr Relat Cancer 23(2):R131-142CASPubMedArticleGoogle Scholar
8.Katznelson L (2015) Bilateral adrenalectomy for Cushing’s disease. Pituitary 18(2):269–273CASPubMedArticleGoogle Scholar
9.Banasiak MJ, Malek AR (2007) Nelson syndrome: comprehensive review of pathophysiology, diagnosis, and management. Neurosurg Focus 23(3):E13PubMedArticleGoogle Scholar
10.Assie G, Bahurel H, Bertherat J, Kujas M, Legmann P, Bertagna X (2004) The Nelson’s syndrome revisited. Pituitary. 7(4):209–215PubMedArticleGoogle Scholar
11.Ragnarsson O (2020) Cushing’s syndrome disease monitoring: recurrence, surveillance with biomarkers or imaging studies. Best Pract Res Clin Endocrinol Metab. 34(2):101382PubMedArticleGoogle Scholar
12.Fountas A, Karavitaki N (2020) Nelson’s syndrome: an update. Endocrinol Metab Clin North Am 49(3):413–432PubMedArticleGoogle Scholar
13.Moher D, Liberati A, Tetzlaff J, Altman DG, Group P (2009) Preferred reporting items for systematic reviews and meta-analyses: the PRISMA statement. PLoS Med 6(7):e1000097PubMedPubMed CentralArticleGoogle Scholar
15.Balduzzi S, Rucker G, Schwarzer G (2019) How to perform a meta-analysis with R: a practical tutorial. Evid Based Ment Health 22(4):153–160PubMedArticleGoogle Scholar
16.Lau J, Ioannidis JP, Schmid CH (1998) Summing up evidence: one answer is not always enough. Lancet 351(9096):123–127CASPubMedArticleGoogle Scholar
17.Egger M, Davey Smith G, Schneider M, Minder C (1997) Bias in meta-analysis detected by a simple, graphical test. BMJ 315(7109):629–634CASPubMedPubMed CentralArticleGoogle Scholar
18.Smith PW, Turza KC, Carter CO, Vance ML, Laws ER, Hanks JB (2009) Bilateral adrenalectomy for refractory Cushing disease: a safe and definitive therapy. J Am Coll Surg 208(6):1059–1064PubMedArticleGoogle Scholar
19.Mehta GU, Sheehan JP, Vance ML (2013) Effect of stereotactic radiosurgery before bilateral adrenalectomy for Cushing’s disease on the incidence of Nelson’s syndrome. J Neurosurg 119(6):1493–1497PubMedArticleGoogle Scholar
20.Gil-Cardenas A, Herrera MF, Diaz-Polanco A, Rios JM, Pantoja JP (2007) Nelson’s syndrome after bilateral adrenalectomy for Cushing’s disease. Surgery. 141(2):147–151
21.Moore TJ, Dluhy RG, Williams GH, Cain JP (1976) Nelson’s syndrome: frequency, prognosis, and effect of prior pituitary irradiation. Ann Intern Med 85(6):731–734CASPubMedArticleGoogle Scholar
24.Cohen KL, Noth RH, Pechinski T (1978) Incidence of pituitary tumors following adrenalectomy. A long-term follow-up study of patients treated for Cushing’s disease. Arch Internal Med 138(4):575–579CASArticleGoogle Scholar
26.Barnett AH, Livesey JH, Friday K, Donald RA, Espiner EA (1983) Comparison of preoperative and postoperative ACTH concentrations after bilateral adrenalectomy in Cushing’s disease. Clin Endocrinol (Oxf) 18(3):301–305CASArticleGoogle Scholar
28.Kelly WF, MacFarlane IA, Longson D, Davies D, Sutcliffe H (1983) Cushing’s disease treated by total adrenalectomy: long-term observations of 43 patients. Q J Med 52(206):224–231CASPubMedGoogle Scholar
29.Kuhn JM, Proeschel MF, Seurin DJ, Bertagna XY, Luton JP, Girard FL (1989) Comparative assessment of ACTH and lipotropin plasma levels in the diagnosis and follow-up of patients with Cushing’s syndrome: a study of 210 cases. Am J Med 86(6 Pt 1):678–684CASPubMedArticleGoogle Scholar
30.Grabner P, Hauerjensen M, Jervell J, Flatmark A (1991) Long-term results of treatment of cushings-disease by adrenalectomy. Acta Chirurgica- Eur J Surgery 157(8):461–464CASGoogle Scholar
31.McCance DR, Russell CF, Kennedy TL, Hadden DR, Kennedy L, Atkinson AB (1993) Bilateral adrenalectomy: low mortality and morbidity in Cushing’s disease. Clin Endocrinol 39(3):315–321CASArticleGoogle Scholar
32.Zeiger MA, Fraker DL, Pass HI, Nieman LK, Cutler GB Jr, Chrousos GP, Norton JA (1993) Effective reversibility of the signs and symptoms of hypercortisolism by bilateral adrenalectomy. Surgery 114(6):1138–1143CASPubMedGoogle Scholar
33.Favia G, Boscaro M, Lumachi F, D’Amico DF (1994) Role of bilateral adrenalectomy in Cushing’s disease. World J Surg 18(4):462–466CASPubMedArticleGoogle Scholar
34.Kemink L, Pieters G, Hermus A, Smals A, Kloppenborg P (1994) Patient’s age is a simple predictive factor for the development of Nelson’s syndrome after total adrenalectomy for Cushing’s disease. J Clin Endocrinol Metab 79(3):887–889CASPubMedGoogle Scholar
35.Misra D, Kapur MM, Gupta DK (1994) Incidence of Nelson’s syndrome and residual adrenocortical function in patients of Cushing’s disease after bilateral adrenalectomy. J Assoc Physicians India 42(4):304–305CASPubMedGoogle Scholar
36.Jenkins PJ, Trainer PJ, Plowman PN, Shand WS, Grossman AB, Wass JA, Besser GM (1995) The long-term outcome after adrenalectomy and prophylactic pituitary radiotherapy in adrenocorticotropin-dependent Cushing’s syndrome. J Clin Endocrinol Metab 80(1):165–171CASPubMedGoogle Scholar
37.Pereira MA, Halpern A, Salgado LR, Mendonca BB, Nery M, Liberman B, Streeten DH, Wajchenberg BL (1998) A study of patients with Nelson’s syndrome. Clin Endocrinol (Oxf) 49(4):533–539CASArticleGoogle Scholar
38.Imai T, Kikumori T, Funahashi H, Nakao A (2000) Surgical management of Cushing’s syndrome. Biomed Pharmacother 54(1):140–145ArticleGoogle Scholar
39.Nagesser SK, van Seters AP, Kievit J, Hermans J, Krans HM, van de Velde CJ (2000) Long-term results of total adrenalectomy for Cushing’s disease. World J Surg 24(1):108–113CASPubMedArticleGoogle Scholar
40.Hofmann BM, Fahlbusch R (2006) Treatment of Cushing’s disease: A retrospective clinical study of the latest 100 cases. Pituitary Surgery – A Modern Approach 34:158–184ArticleGoogle Scholar
41.Thompson SK, Hayman AV, Ludlam WH, Deveney CW, Loriaux DL, Sheppard BC (2007) Improved quality of life after bilateral laparoscopic adrenalectomy for Cushing’s disease: a 10-year experience. Ann Surg 245(5):790–794PubMedPubMed CentralArticleGoogle Scholar
42.Ding XF, Li HZ, Yan WG, Gao Y, Li XQ (2010) Role of adrenalectomy in recurrent Cushing’s disease. Chin Med J 123(13):1658–1662PubMedGoogle Scholar
43.Osswald A, Plomer E, Dimopoulou C, Milian M, Blaser R, Ritzel K, Mickisch A, Knerr F, Stanojevic M, Hallfeldt K, Schopohl J, Kuhn KA, Stalla G, Beuschlein F, Reincke M (2014) Favorable long-term outcomes of bilateral adrenalectomy in Cushing’s disease. Eur J Endocrinol 171(2):209–215CASPubMedArticleGoogle Scholar
44.Prajapati OP, Verma AK, Mishra A, Agarwal G, Agarwal A, Mishra SK (2015) Bilateral adrenalectomy for Cushing’s syndrome: pros and cons. Indian J Endocrinol Metabol 19(6):834–840CASArticleGoogle Scholar
45.Espinosa-de-Los-Monteros AL, Sosa-Eroza E, Espinosa E, Mendoza V, Arreola R, Mercado M (2017) Long-term outcome of the different treatment alternatives for recurrent and persistent cushing disease. Endocrine Pract: Off J Am College Endocrinol Am Assoc Clin Endocrinol 23(7):759–767ArticleGoogle Scholar
46.Graffeo CS, Perry A, Carlstrom LP, Meyer FB, Atkinson JLD, Erickson D, Nippoldt TB, Young WF, Pollock BE, Van Gompel JJ (2017) Characterizing and predicting the Nelson-Salassa syndrome. J Neurosurg 127(6):1277–1287CASPubMedArticleGoogle Scholar
47.Nankova A, Yaneva M, Elenkova A, Tcharaktchiev D, Marinov M, Hadzhiyanev A, Sechanov T, Gantchev G, Todorov G, Kirilov G, Kalinov K, Andreeva M, Zacharieva S (2018) Cushing’s syndrome: a historic review of the treatment strategies and corresponding outcomes in a single tertiary center over the past half-century. Hormone Metab Res 50(4):280–289CASArticleGoogle Scholar
48.Chiloiro S, Giampietro A, Raffaelli M, D’Amato G, Bima C, Lauretti L, Anile C, Lombardi CP, Rindi G, Bellantone R, De Marinis L, Pontecorvi A, Bianchi A (2019) Synchronous bilateral adrenalectomy in ACTH-dependent hypercortisolism: predictors, biomarkers and outcomes. Endocrine 66(3):642–649CASPubMedArticleGoogle Scholar
49.Cohen AC, Goldney DC, Danilowicz K, Manavela M, Rossi MA, Gomez RM, Cross GE, Bruno OD (2019) Long-term outcome after bilateral adrenalectomy in Cushing’s disease with focus on Nelson’s syndrome. Arch Endocrinol Metab 63(5):470–477
50.Nagendra L, Bhavani N, Pavithran PV, Kumar GP, Menon UV, Menon AS, Kumar L, Kumar H, Nair V, Abraham N, Narayanan P (2019) Outcomes of bilateral adrenalectomy in Cushing’s syndrome. Indian J Endocrinol Metab 23(2):193–197PubMedPubMed CentralArticleGoogle Scholar
51.Sarkis P, Rabilloud M, Lifante JC, Siamand A, Jouanneau E, Gay E, Chaffanjon P, Chabre O, Raverot G (2019) Bilateral adrenalectomy in Cushing’s disease: altered long-term quality of life compared to other treatment options. Ann Endocrinol 80(1):32–37ArticleGoogle Scholar
52.Assie G, Bahurel H, Coste J, Silvera S, Kujas M, Dugue MA, Karray F, Dousset B, Bertherat J, Legmann P, Bertagna X (2007) Corticotroph tumor progression after adrenalectomy in Cushing’s disease: a reappraisal of Nelson’s Syndrome. J Clin Endocrinol Metab 92(1):172–179CASPubMedArticleGoogle Scholar
53.Das L, Bhansali A, Pivonello R, Dutta P, Bhadada SK, Ahuja CK, Mavuduru R, Kumar S, Behera A, Saikia UN, Dhandapani S, Walia R (2020) ACTH increment post total bilateral adrenalectomy for Cushing’s disease: a consistent biosignature for predicting Nelson’s syndrome. Pituitary 23(5):488–497CASPubMedArticleGoogle Scholar
54.Barber TM, Adams E, Ansorge O, Byrne JV, Karavitaki N, Wass JA (2010) Nelson’s syndrome. Eur J Endocrinol 163(4):495–507CASPubMedArticleGoogle Scholar
55.Reincke M, Albani A, Assie G, Bancos I, Brue T, Buchfelder M, Chabre O, Ceccato F, Daniele A, Detomas M, Di Dalmazi G, Elenkova A, Findling J, Grossman AB, Gomez-Sanchez CE, Heaney AP, Honegger J, Karavitaki N, Lacroix A, Laws ER, Losa M, Murakami M, Newell-Price J, Pecori Giraldi F, Perez-Rivas LG, Pivonello R, Rainey WE, Sbiera S, Schopohl J, Stratakis CA, Theodoropoulou M, van Rossum EFC, Valassi E, Zacharieva S, Rubinstein G, Ritzel K (2021) Corticotroph tumor progression after bilateral adrenalectomy (Nelson’s syndrome): systematic review and expert consensus recommendations. Eur J Endocrinol. https://doi.org/10.1530/EJE-20-1088
56.Patel J, Eloy JA, Liu JK (2015) Nelson’s syndrome: a review of the clinical manifestations, pathophysiology, and treatment strategies. Neurosurg Focus 38(2):E14PubMedArticleGoogle Scholar
57.Fountas A, Lim ES, Drake WM, Powlson AS, Gurnell M, Martin NM, Seejore K, Murray RD, MacFarlane J, Ahluwalia R, Swords F, Ashraf M, Pal A, Chong Z, Freel M, Balafshan T, Purewal TS, Speak RG, Newell-Price J, Higham CE, Hussein Z, Baldeweg SE, Dales J, Reddy N, Levy MJ, Karavitaki N (2020) Outcomes of patients with Nelson’s syndrome after primary treatment: a multicenter study from 13 UK pituitary centers. J Clin Endocrinol Metab 105(5):1527–1537
We would like to thank Therese Svanberg, librarian at the Medical Library at Sahlgrenska University Hospital for her expert assistance with the literature search.
Funding
Open access funding provided by University of Gothenburg. The study was financed by grants from the Swedish state under the agreement between the Swedish government and the county councils, the ALF-agreement (ALFGBG-593301) and a grant from the Gothenburg Society of Medicine.
Author information
Affiliations
Department of Internal Medicine and Clinical Nutrition, Institute of Medicine at Sahlgrenska Academy, University of Gothenburg, 413 45, Gothenburg, SwedenEleni Papakokkinou, Marta Piasecka, Dimitrios Chantzichristos, Daniel S. Olsson, Gudmundur Johannsson & Oskar Ragnarsson
The Department of Endocrinology, Sahlgrenska University Hospital, Blå stråket 5, 413 45, Gothenburg, SwedenEleni Papakokkinou, Marta Piasecka, Dimitrios Chantzichristos, Daniel S. Olsson, Gudmundur Johannsson & Oskar Ragnarsson
Department of Environmental and Occupational Health School of Public Health and Community Medicine, University of Gothenburg, 4053, Gothenburg, SwedenHanne Krage Carlsen
Department of Public Health and Clinical Medicine, Umeå University, 901 87, Umeå, SwedenPer Dahlqvist
Department of Molecular Medicine and Surgery, Karolinska Institutet, 17176, Stockholm, SwedenMaria Petersson, Katarina Berinder, Sophie Bensing, Charlotte Höybye & Henrik Falhammar
Department of Endocrinology, Karolinska University Hospital, 171 76, Stockholm, SwedenMaria Petersson, Katarina Berinder, Sophie Bensing, Charlotte Höybye & Henrik Falhammar
Department of Endocrinology and Diabetes, Uppsala University Hospital, and Department of Medical Sciences, Endocrinology and Mineral Metabolism, Uppsala University, 751 85, Uppsala, SwedenBritt Edén Engström
Department of Endocrinology, Skåne University Hospital, University of Lund, 205 02, Malmö, SwedenPia Burman
Department of Endocrinology, Skåne University Hospital, 222 42, Lund, SwedenCecilia Follin, David Petranek & Eva Marie Erfurth
Department of Endocrinology and Department of Medical and Health Sciences, Linköping University, 581 83, Linköping, SwedenJeanette Wahlberg & Bertil Ekman
Department of Internal Medicine, School of Health and Medical Sciences, Örebro University, 702 81, Örebro, SE, SwedenJeanette Wahlberg, Anna-Karin Åkerman & Erik Schwarcz
Open Access This article is licensed under a Creative Commons Attribution 4.0 International License, which permits use, sharing, adaptation, distribution and reproduction in any medium or format, as long as you give appropriate credit to the original author(s) and the source, provide a link to the Creative Commons licence, and indicate if changes were made. The images or other third party material in this article are included in the article’s Creative Commons licence, unless indicated otherwise in a credit line to the material. If material is not included in the article’s Creative Commons licence and your intended use is not permitted by statutory regulation or exceeds the permitted use, you will need to obtain permission directly from the copyright holder. To view a copy of this licence, visit http://creativecommons.org/licenses/by/4.0/.
Papakokkinou, E., Piasecka, M., Carlsen, H.K. et al. Prevalence of Nelson’s syndrome after bilateral adrenalectomy in patients with cushing’s disease: a systematic review and meta-analysis. Pituitary (2021). https://doi.org/10.1007/s11102-021-01158-z
Approximately 20% of a cohort of adults with Cushing’s syndrome experienced at least one thrombotic event after undergoing pituitary or adrenal surgery, with the highest risk observed for those undergoing bilateral adrenalectomy, according to findings from a retrospective analysis published in the Journal of the Endocrine Society.
“We have previously showed in a recent meta-analysis that Cushing’s syndrome is associated with significantly increased venous thromboembolic events odds vs. the general population, though the risk is lower than in patients undergoing major orthopedic surgery,” Maria Fleseriu, MD, FACE, professor of neurological surgery and professor of medicine in the division of endocrinology, diabetes and clinical nutrition in the School of Medicine at Oregon Health & Science University and director of the OHSU Northwest Pituitary Center, told Healio. “However, patients undergoing many types of orthopedic surgeries have scheduled thromboprophylaxis, especially postsurgery, which is not the standard of care in patients with Cushing’s syndrome. In this study, we wanted to look in more detail at the rates of all thrombotic events, both arterial and venous, in patients at our specialized pituitary center over more than a decade.”
In a retrospective, longitudinal study, Fleseriu and colleagues analyzed data from 208 individuals with Cushing’s syndrome undergoing surgical (pituitary, unilateral and bilateral adrenalectomy) and medical treatment at a single center (79.3% women; mean age at presentation, 45 years; mean BMI, 33.9 kg/m²; 41.8% with diabetes). Individuals with severe illness and immediate mortality were excluded. Thromboembolic events (myocardial infarction, deep venous thrombosis [DVT], and pulmonary embolism or stroke) were recorded at any point up until last patient follow-up. Researchers assessed all patients who received anticoagulation in the immediate postoperative period and up to 3 months after surgery, recording doses and complications for anticoagulation.
Within the cohort, 39 patients (18.2%) experienced at least one thromboembolic event (56 total events; 52% venous), such as extremity DVT (32%), cerebrovascular accident (27%), MI (21%), and pulmonary embolism (14%). Of those who experienced a thromboembolic event, 40.5% occurred within 60 days of surgery.
Researchers found that 14 of 36 patients who underwent bilateral adrenalectomy experienced a thromboembolic event, for an OR of 3.74 (95% CI, 1.69-8.27). Baseline 24-hour urinary free cortisol levels did not differ for patients with or without thromboembolic event after bilateral adrenalectomy.
“Despite following these patients over time, results almost surprised us,” said Fleseriu, also an Endocrine Today Editorial Board Member. “The risk of thromboembolic events in patients with Cushing’s syndrome was higher than we expected, approximately 20%. Many patients had more than one event, with higher risk at 30 to 60 days postoperatively. Use of a peripherally inserted central catheter line clearly increased risk of upper extremity DVT.”
Among 197 patients who underwent surgery, 50 (25.38%) received anticoagulation after surgery with 2% experiencing bleeding complications.
“We clearly need to understand more about what happens in patients with Cushing’s syndrome for all comorbidities, but especially thrombosis, and find the factors that predict higher risk and use anticoagulation in those patients,” Fleseriu said. “We have shown that among patients who had anticoagulation, risks were minimal. We also have to think more about timelines for these thromboembolic events and the duration of anticoagulation, and probably to expand it up to 30 to 60 days postoperatively if there are no contraindications, especially for patients undergoing bilateral adrenalectomy.”
Fleseriu cautioned that the findings do not necessarily suggest that every individual with Cushing’s syndrome needs anticoagulation therapy, as the study was retrospective. Additionally, sex, age, BMI, smoking status, estrogen or testosterone supplementation, diabetes and hypertension — all known factors for increased thrombosis risk among the general population — were not found to significantly increase the risk for developing a thromboembolic event, Fleseriu said.
“As significantly more patients have exogenous Cushing’s syndrome than endogenous Cushing’s syndrome and many of these patients undergo surgeries, we hope that our study increased awareness regarding thromboembolic risks and the need to balance advantages of thromboprophylaxis with risk of bleeding,” Fleseriu said. – by Regina Schaffer
Disclosure: Fleseriu reports she has received research funding paid to her institution from Novartis and Strongbridge and has received consultant fees from Novartis and Strongbridge.
RSS Error: A feed could not be found at `http://www.oconnormusic.org/feed.xml`; the status code is `503` and content-type is `text/html; charset=us-ascii`
RSS Error: A feed could not be found at `http://www.oconnormusic.org/bios.xml`; the status code is `503` and content-type is `text/html; charset=us-ascii`


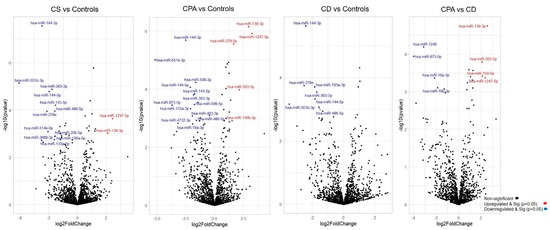
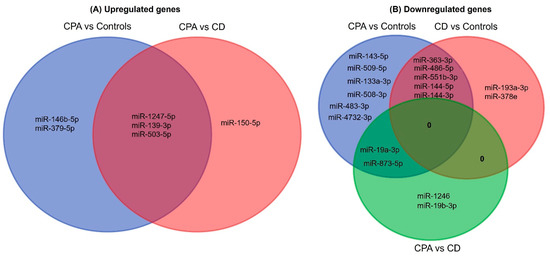
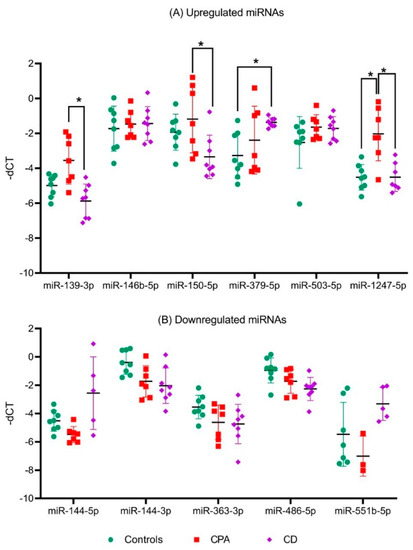
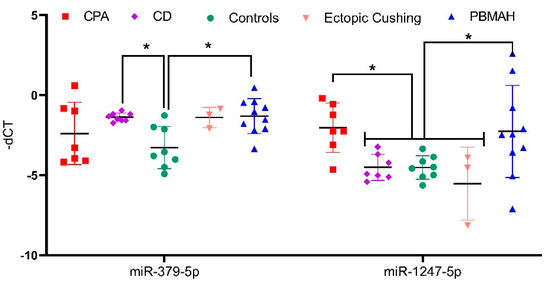
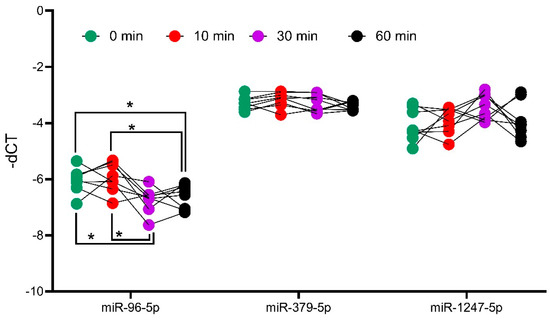
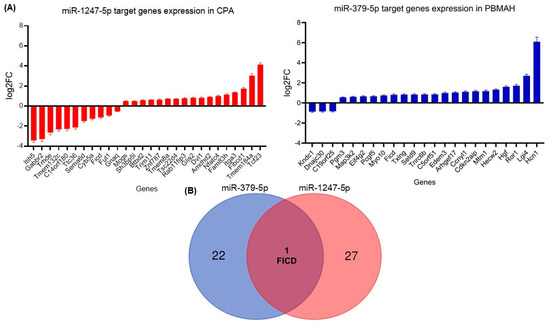
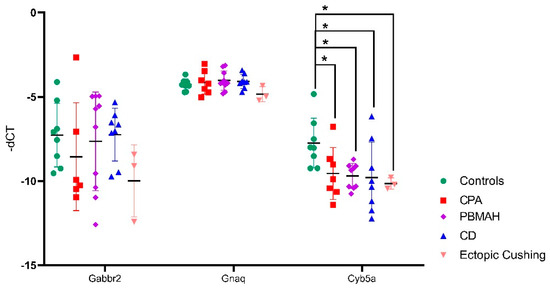
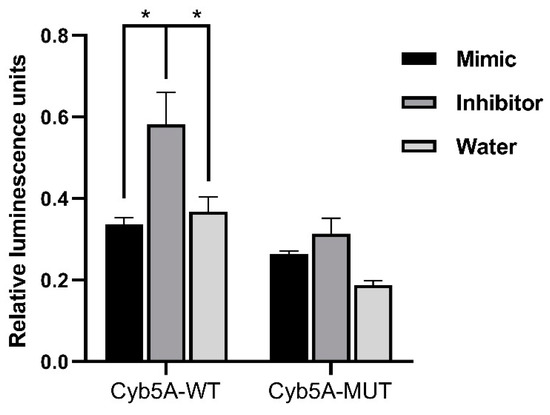

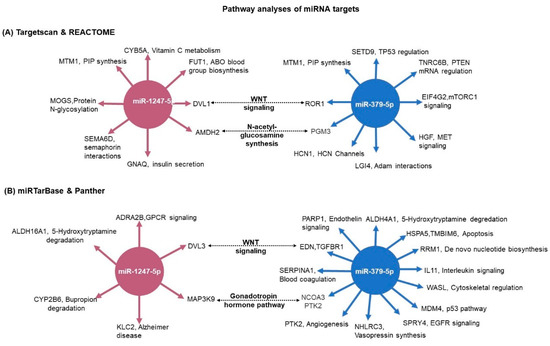
 More information at