According to the clinical practice guidelines developed by the European Society of Endocrinology and European Network for the Study of Adrenal Tumors, AI is an adrenal mass incidentally detected on imaging not performed for a suspected adrenal disease [3]. The prevalence of AI is approximately 4%, and the incidence increases with age [4]. Most adult AIs are nonfunctioning benign adrenal adenomas (up to 75%), while others include functioning adrenal adenomas, pheochromocytomas, and adrenocortical carcinomas [5]. In contrast to the disease spectrum of adult AI cases, NB is the most common tumor type among children with AI, and benign cortical adenomas, which account for the vast majority of adult AI, accounting for less than 0.5% of cases in children [6]. According to several guidelines, urgent assessment of an AI is recommended in children because of a greater likelihood of malignancy [3, 7].
When an adult patient is initially diagnosed with AI, it should be clear whether the lesion is malignant and functional. In several studies, the use of noncontrast CT has been recommended as the initial imaging method for adrenal incidentaloma; a CT attenuation value ≤ 10 HU is used as the diagnostic criterion for benign adenomas; and these methods have a specificity of 71-79% and a sensitivity of 96-98% [8, 9]. A CT scan of tumors with diameters greater than 4 to 6 cm, irregular margins or heterogeneity, a CT attenuation value greater than 10 HU, or a relative contrast enhancement washout of less than 40% 10 or 15 min after administration of contrast media on enhanced CT is considered to indicate potential malignancy [7]. As the most common AI in children, NB often appears as a soft tissue mass with uneven density on CT, often accompanied by high-density calcified shadows, low-density cystic lesions or necrotic areas. CT scans can easily identify more typical NBs, and for those AIs that do not show typical calcified shadows on CT, it is sometimes difficult to differentiate neurogenic tumors from adenomas. In these patients, except for the 1 patient with adrenal cysts who had a CT value of 8 HU, very few of the remaining AI patients had a CT value less than 10 HU. Therefore, the CT value cannot be used simply as a criterion for determining the benign or malignant nature of AI, and additional imaging examinations, such as CT enhancement, MRI, and FDG-PET if necessary, should be performed immediately for AI in children.
Initial hormonal testing is also needed for functional assessment, and aldosterone secretion should also be assessed when the patient is hypertensive or hypokalemic [7]. Patients with AI who are not suitable for surgery should be observed during the follow-up period, and if abnormal adrenal secretion is detected or suggestive of malignancy during this period, prompt adrenal tumor resection is needed. For adult patients with AI, laparoscopic adrenal tumor resection is one of the most effective treatments that has comparative advantages in terms of hospitalization time and postoperative recovery speed; however, there is still some controversy over whether to perform laparoscopic surgery for some malignant tumors with large diameters, especially adrenocortical carcinomas, and some studies have shown that patients who undergo laparoscopic surgery are more prone to peritoneal seeding of tumors [10].
The maximum diameter of an adult AI is a predictor of malignancy, and a study by the National Italian Study Group on Adrenal Tumors, which included 887 AIs, showed that adrenocortical carcinoma was significantly correlated with the size of the mass, and the sensitivity of detecting adrenocortical carcinoma with a threshold of 4 cm was 93% [11]. According to the National Institutes of Health, patients with tumors larger than 6 cm should undergo surgical treatment, while patients with tumors smaller than 4 cm should closely monitored; for patients with tumors between 4 and 6 cm, the choice of whether to be monitored or surgically treated can be based on other indicators, such as imaging [12]. A diameter of 4 cm is not the initial threshold for determining the benign or malignant nature of a mass in children.
In a study of 26 children with AI, Masiakos et al. reported that 9 of 18 benign lesions had a maximal diameter less than 5 cm, 4 of 8 malignant lesions had a maximal diameters less than 5 cm, and 2 had a diameter less than 3 cm. The mean maximal diameter of benign lesions was 4.2 ± 1.7 cm, whereas the mean maximum diameter of malignant lesions was 5.1 ± 2.3 cm. There was no statistically significant difference between the two comparisons; therefore, this study concluded that children with AI diameters less than 5 cm cannot be treated expectantly [6]. Additionally, this study revealed that malignant lesions occurred significantly more frequently than benign lesions in younger children (mean age 1.7 ± 1.8 years v 7.8 ± 5.9 years; P = 0.02).
In the nonneonatal group of this study, 20 patients with malignant tumors had maximum diameters ranging from 20 to 131 mm, 10 had malignant tumors larger than 60 mm, and 3 had tumors smaller than 40 cm; 18 patients with benign tumors had maximum diameters ranging from 17 to 70 mm, 5 had diameters ranging from 40 to 60 mm, and 5 had diameters larger than 60 mm. Therefore, it is not recommended to use the size of the largest diameter of the tumor to decide whether to wait and observe or intervene surgically for children with AI. Instead, it is necessary to consider the age of the child; laboratory test results, such as whether the tumor indices are elevated or not; whether the tumor has an endocrine function; etc.; and imaging test results to make comprehensive judgments and decisions. Preoperative aggressive evaluation and prompt surgical treatment are recommended for nonneonatal pediatric AI patients.
Adrenal hematoma and NBs are the most common types of adrenal area masses in children, while pheochromocytoma, adrenal cyst, and teratoma are rarer masses [13]. In clinical practice, adrenal hematoma and NB are sometimes difficult to differentiate, especially when adrenal masses are found during the prenatal examination and neonatal period, and such children need to be managed with caution. The Children’s Oncology Group (COG ANBL00B1) implemented the watchful waiting treatment for children under 6 months of age with a solid adrenal mass < 3.1 cm in diameter (or a cystic mass < 5 cm) without evidence of distant metastasis, and if there is a > 50% increase in the adrenal mass volume, there is no return to the baseline VMA or HVA levels, or if there is a > 50% increase in the urinary VMA/HVA ratio or an inversion, surgical resection should be performed [14]. Eighty-three children in this study underwent expectant observation, 16 of whom ultimately underwent surgical resection (8 with INSS stage 1 NB, 1 with INSS stage 2B, 1 with INSS stage 4 S, 2 with low-grade adrenocortical neoplasm, 2 with adrenal hemorrhage, and 2 with extralobar pulmonary sequestration). Most of the children who were observed had a reduced adrenal mass volume. Of the 56 patients who completed the final 90 weeks of expectant observation, 27 (48%) had no residual mass, 13 (23%) had a residual mass volume of 0–1 ml, 8 (14%) had a mass volume of 1–2 ml, and 8 (14%) had a volume of > 2 ml; ultimately, 71% of the residual masses had a volume ≤ 1 ml and 86% had a residual volume ≤ 2 ml. In this study, a total of 16 patients were included in the watchful waiting treatment group; 3 patients underwent surgical treatment during the follow-up period, and 13 patients ultimately completed watchful waiting treatment. After 1–31 months of follow-up, 8 patients’ swelling completely disappeared, and 5 patients’ swelling significantly decreased. After strict screening for indications and thorough follow-up review, AIs in the neonatal period can be subjected to watchful waiting treatment, and satisfactory results can be achieved.
For benign adrenal tumors, laparoscopic surgery is superior to open surgery in terms of successful resection, whereas the feasibility of minimally invasive surgery for AI with preoperative suspicion of malignancy is controversial. The European Cooperative Study Group for Pediatric Rare Tumors recommends that minimally invasive surgery be considered only for early childhood tumors and should be limited to small, localized tumors; additionally, imaging should suggest no invasion of surrounding tissue structures or lymph nodes; and this strategy requires surgeons with extensive experience in oncologic and adrenal surgery [15]. NB is the most common pediatric AI, and open tumor resection remains the mainstay of treatment. For small, early tumors without evidence of invasion on preoperative examination, laparoscopic resection may be considered if the principles of oncologic surgery can be adhered to. If the patient responds to chemotherapy, the decision to perform laparoscopic tumor resection can also be re-evaluated after chemotherapy. According to the current study, the recurrence and mortality rates of laparoscopic surgery are comparable to those of open surgery [16, 17]. The relative contraindications for laparoscopic NB resection include a tumor diameter greater than 6 cm, venous dilatation, and the involvement of adjacent organs or blood vessels [18]. Patients who undergo open adrenalectomy have higher overall survival and recurrence-free survival rates than patients who undergo laparoscopic adrenalectomy [19]. Open adrenalectomy remains the gold standard for surgical resection of adrenocortical carcinoma, whereas laparoscopic adrenalectomy should be reserved for highly selected patients and performed by surgeons with appropriate expertise [20].
Cortical tumors are particularly rare among children with AIs and are sometimes not clearly distinguishable from neurogenic tumors on preoperative imaging; in such patients, the presence of subclinical Cushing’s syndrome needs to be carefully evaluated preoperatively; otherwise, a perioperative adrenal crisis may occur [21]. In patients in whom the possibility of an adrenocortical tumor was considered preoperatively, the assessment for subclinical Cushing’s syndrome mainly involved assessing the serum dehydroepiandrosterone sulfate level and performing an overnight dexamethasone suppression test.
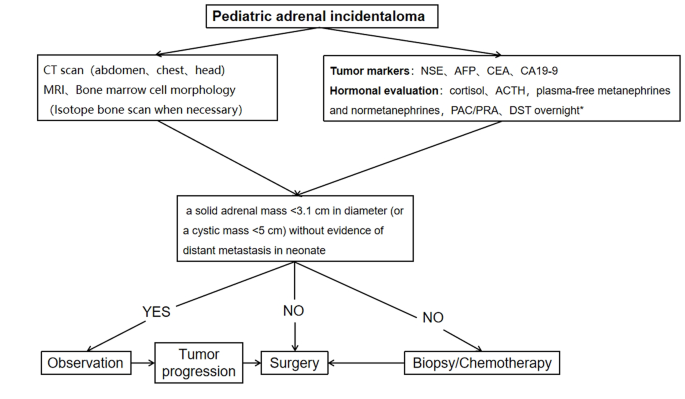
A procedure for evaluating pediatric AI is shown in Fig. 1. Imaging is the first step in the evaluation of AI in children. CT can be used to clarify the nature of most tumors. MRI can be used to evaluate imaging risk factors (IDRFs) for NB. Bone marrow cytomorphology is recommended for all children with AI, along with microscopic residual neuroblastoma testing and further bone scanning if the bone marrow examination is positive. In addition, serum tumor marker levels and other relevant tests should be performed, and hormone levels should be evaluated. If adrenal adenomas cannot be completely excluded during the preoperative examination, a 1 mg overnight dexamethasone suppression test should be performed to exclude subclinical Cushing’s syndrome. In patients with hypertensive hypokalemia, the presence of aldosteronism should be evaluated by testing plasma aldosterone concentrations and plasma renin activity. Adrenal masses found in the neonatal period can be observed if the tumor is small, confined to the adrenal gland and shows no evidence of distant metastasis, while tumors that increase significantly in size during the follow-up period or that are associated with persistently elevated tumor markers require aggressive surgical treatment.


