Long-Term Efficacy and Safety of Osilodrostat in Patients with Cushing’s Disease

Objective: To evaluate the long-term efficacy and safety of osilodrostat in patients with Cushing’s disease.

Methods: The multicenter, 48-week, Phase III LINC 4 clinical trial had an optional extension period that was initially intended to continue to week 96. Patients could continue in the extension until a managed-access program or alternative treatment became available locally, or until a protocol amendment was approved at their site that specified that patients should come for an end-of-treatment visit within 4 weeks or by week 96, whichever occurred first. Study outcomes assessed in the extension included: mean urinary free cortisol (mUFC) response rates; changes in mUFC, serum cortisol and late-night salivary cortisol (LNSC); changes in cardiovascular and metabolic-related parameters; blood pressure, waist circumference and weight; changes in physical manifestations of Cushing’s disease; changes in patient-reported outcomes for health-related quality of life; changes in tumor volume; and adverse events. Results were analyzed descriptively; no formal statistical testing was performed.

Results: Of 60 patients who entered, 53 completed the extension, with 29 patients receiving osilodrostat for more than 96 weeks (median osilodrostat duration: 87.1 weeks). The proportion of patients with normalized mUFC observed in the core period was maintained throughout the extension. At their end-of-trial visit, 72.4% of patients had achieved normal mUFC. Substantial reductions in serum cortisol and LNSC were also observed. Improvements in most cardiovascular and metabolic-related parameters, as well as physical manifestations of Cushing’s disease, observed in the core period were maintained or continued to improve in the extension. Osilodrostat was generally well tolerated; the safety profile was consistent with previous reports.

Conclusion: Osilodrostat provided long-term control of cortisol secretion that was associated with sustained improvements in clinical signs and physical manifestations of hypercortisolism. Osilodrostat is an effective long-term treatment for patients with Cushing’s disease.

Clinical trial registration: ClinicalTrials.gov, identifier NCT02180217

Introduction

Cushing’s disease is a rare but serious disorder resulting from an adrenocorticotropic hormone (ACTH)-producing pituitary adenoma that, in turn, promotes excess adrenal cortisol (1). Chronic exposure to excess cortisol is associated with numerous comorbidities, including hypertension, muscle weakness, hirsutism, central obesity, hypercoagulability and diabetes mellitus, all of which lead to an increased risk of mortality and poor health-related quality of life (HRQoL) (13). The longer the exposure to excess cortisol, the lower the chance of reversing morbidity (2).

Although transsphenoidal surgery is the recommended first-line treatment, approximately one-third of patients experience persistent or recurrent disease following surgery (4), and some patients are ineligible for or refuse surgery (46). Steroidogenesis inhibitors are usually the first choice for medical treatment (6). The effect of medical treatment can be easily monitored by measurement of serum and urine cortisol. Owing to the unremitting nature of Cushing’s disease, patients often require continued medical therapy to maintain long-term control of cortisol excretion. To date, long-term efficacy and safety data for steroidogenesis inhibitors from prospective clinical trials are limited (78).

Osilodrostat is a potent oral inhibitor of 11β-hydroxylase and is approved for the treatment of adult patients with Cushing’s disease (USA) or endogenous Cushing’s syndrome (EU and Japan) who are eligible for medical therapy (912). The LINC 4 study was a multicenter, 48-week, Phase III clinical trial in patients with Cushing’s disease that included an upfront 12-week randomized, double-blind, placebo-controlled period. Osilodrostat led to rapid normalization of mean urinary free cortisol (mUFC) excretion and was significantly superior to placebo at week 12; normal mUFC excretion was sustained in most patients throughout the 48-week core period (13).

Following the 48-week core period, patients could enter an optional open-label extension period intended to run for an additional 48 weeks. Here, we report the long-term efficacy and safety data from the extension of LINC 4. These data augment the existing efficacy and safety profile of osilodrostat (781314).

Methods

Patients

Eligibility criteria have been described previously (13). Briefly, the study enrolled adult patients with a confirmed diagnosis of persistent or recurrent Cushing’s disease after pituitary surgery and/or irradiation, or de novo Cushing’s disease (if not surgical candidates), with mUFC >1.3 times the upper limit of normal (ULN; 138 nmol/24 h or 50 μg/24 h; calculated from three samples collected on three consecutive days, with ≥2 values >1.3 x ULN). Patients who continued to receive clinical benefit from osilodrostat, as assessed by the study investigator, could enter the extension phase.

The study was conducted in accordance with the Declaration of Helsinki, with an independent ethics committee/institutional review board at each site approving the study protocol; patients provided written informed consent to participate and consented again at week 48 to taking part in the extension phase. The trial is registered at ClinicalTrials.gov (NCT02180217).

Study design

Data from the 48-week core period of this Phase III study, consisting of a 12-week randomized, placebo-controlled, double-blind period followed by a 36-week open-label treatment period, have been published previously (13). The optional open-label extension phase was initially planned to run for an additional 48 weeks (to week 96 for the last patient enrolled). However, patients could continue in the extension only until a managed-access program or alternative treatment became available locally, or until a protocol amendment was approved at their site that specified that patients enrolled in the optional extension phase should come for an end-of-treatment (EOT) visit within 4 weeks or by week 96, whichever occurred first. Patients still receiving clinical benefit from osilodrostat at their EOT visit were eligible to join a separate long-term safety follow-up study (NCT03606408). Consequently, the extension phase ended when all patients had transitioned to the long-term safety follow-up study, if eligible, or had discontinued from the study. Patients continued to receive open-label osilodrostat at the established effective dose from the core phase (dose adjustments were permitted based on efficacy and tolerability; the maximum dose was 30 mg twice daily [bid]).

Outcomes

Study outcomes assessed during the extension phase were as follows: complete (mUFC ≤ULN), partial (mUFC decrease ≥50% from baseline and >ULN) and mUFC response rate at weeks 60, 72, 84, 96 and 108, then every 24 weeks until the extension EOT visit; change in mUFC, serum cortisol and late-night salivary cortisol (LNSC) at weeks 60, 72, 84, 96 and 108, then every 24 weeks until the extension EOT visit; time to loss of mUFC control, defined as the time (in weeks) from the first collection of post-baseline normal mUFC (≤ULN) to the first mUFC >1.3 x ULN on two consecutive scheduled visits on the highest tolerated dose of osilodrostat and not related to a dose interruption or reduction for safety reasons after week 26; change in cardiovascular/metabolic-related parameters associated with Cushing’s disease (fasting plasma glucose [FPG] and glycated hemoglobin [HbA1c]) at weeks 60, 72, 84, 96 and 108, then every 24 weeks until the extension EOT visit; blood pressure, waist circumference and weight every 4 weeks until week 72, then every 12 weeks until week 108, then every 24 weeks until the extension EOT visit; change from baseline in physical manifestations of hypercortisolism at weeks 72, 96 and 108, then every 24 weeks until the extension EOT visit; changes in HRQoL (determined by Cushing’s Quality of Life Questionnaire [CushingQoL] and Beck Depression Inventory II [BDI-II]) at weeks 72 and 96 and the extension EOT visit; and proportion of patients with ≥20% decrease or increase in tumor volume. mUFC (mean of two or three 24-hour urine samples), serum cortisol (measured between 08:00 and 10:00) and LNSC (measured from two samples collected between 22:00 and 23:00) were evaluated using liquid chromatography-tandem mass spectrometry and assessed centrally. Pituitary magnetic resonance imaging with and without gadolinium enhancement was performed locally at weeks 72 and 96 and the extension EOT visit; images were assessed centrally for change in tumor size. Safety was continually assessed from core study baseline throughout the extension for all enrolled patients by monitoring for adverse events (AEs); all AEs from first patient first visit to last patient last visit are reported. AEs of special interest (AESIs) included events related to hypocortisolism, accumulation of adrenal hormone precursors, arrhythmogenic potential and QT prolongation, and enlargement of the pituitary tumor.

Statistical methods

Analyses presented here are based on cumulative data generated for the full analysis set (all patients enrolled at core study start who received at least one dose of osilodrostat) up to last patient last visit. Safety analyses included all enrolled patients who received at least one dose of osilodrostat and had at least one valid post-baseline safety assessment. All analyses excluded data for patients in the placebo arm collected during the placebo-controlled period. Results were analyzed descriptively, and no formal statistical testing was performed. Correlations were evaluated using the Pearson’s correlation coefficient; extreme outliers were defined as >(Q3 + 3 x IQR) or <(Q1 − 3 x IQR), where Q1 and Q3 are the first and third quartiles and IQR is the interquartile range (Q3 − Q1).

Results

Patient disposition and baseline characteristics

LINC 4 was conducted from October 3, 2016 to December 31, 2020. Of the 73 patients who were enrolled and received treatment in the core phase, 65 completed the core phase and 60 (82.2%) opted to enter the extension; 53 (72.6%) patients completed the extension (Figure 1). At core study baseline, most patients had undergone previous pituitary surgery (87.7%) or received prior medical therapy (61.6%; Table 1). Patients had a variety of comorbidities at core study baseline, most commonly hypertension (61.6%); physical manifestations of hypercortisolism were common (Table 1).

Figure 1
www.frontiersin.org
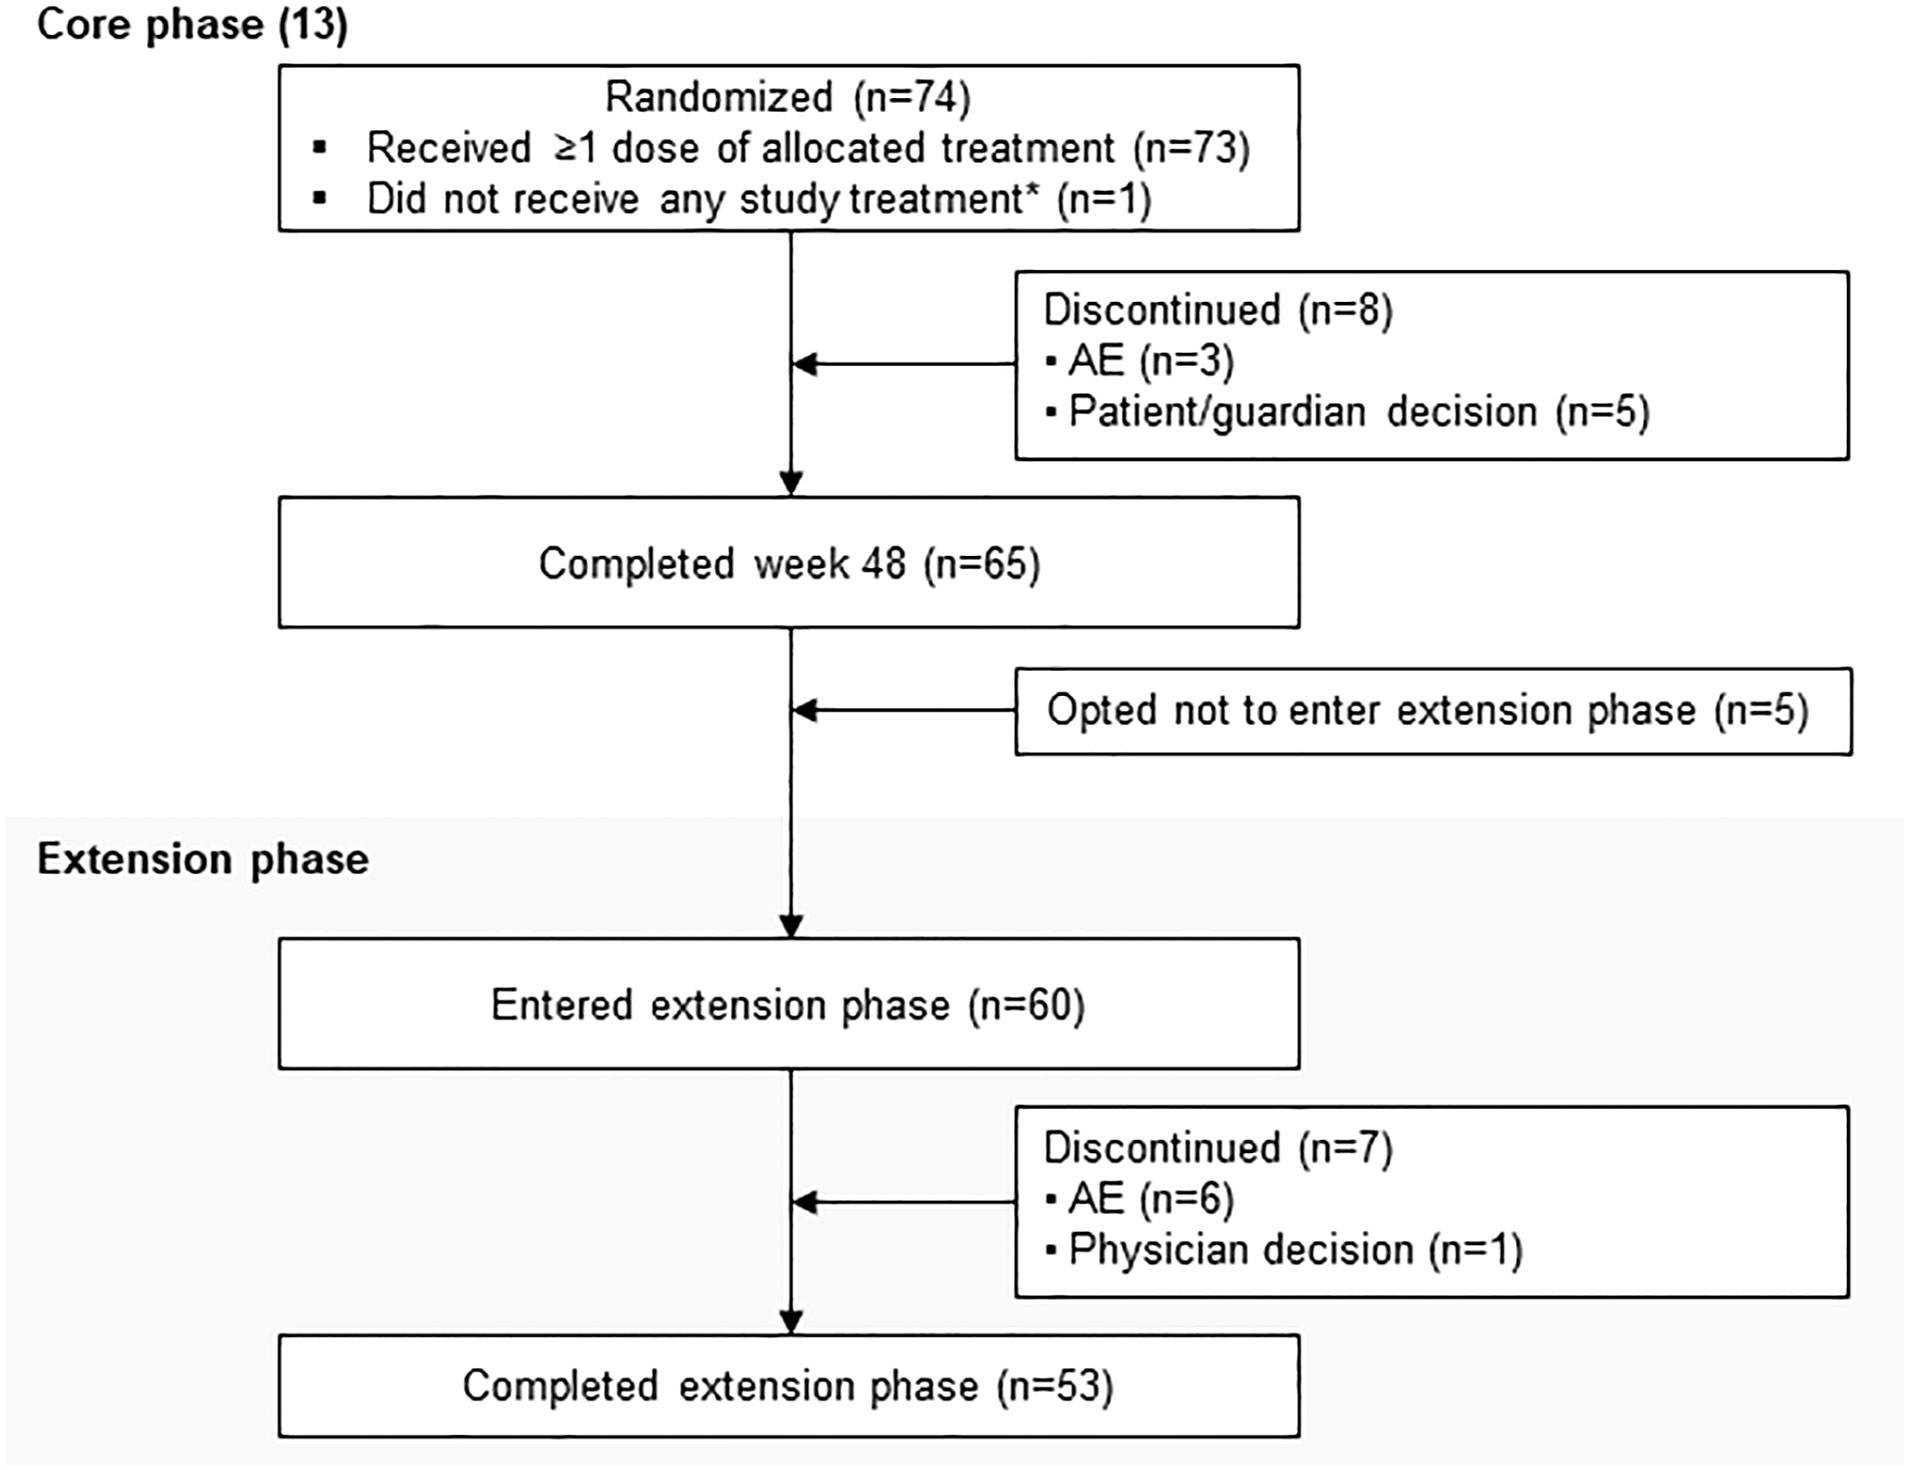
Figure 1 Patient disposition. *Patient was randomly allocated to osilodrostat but did not receive any study treatment because of a serious AE (grade 4 pituitary apoplexy that required hospitalization prior to receiving any study drug) that was not considered related to treatment.

Table 1
www.frontiersin.org
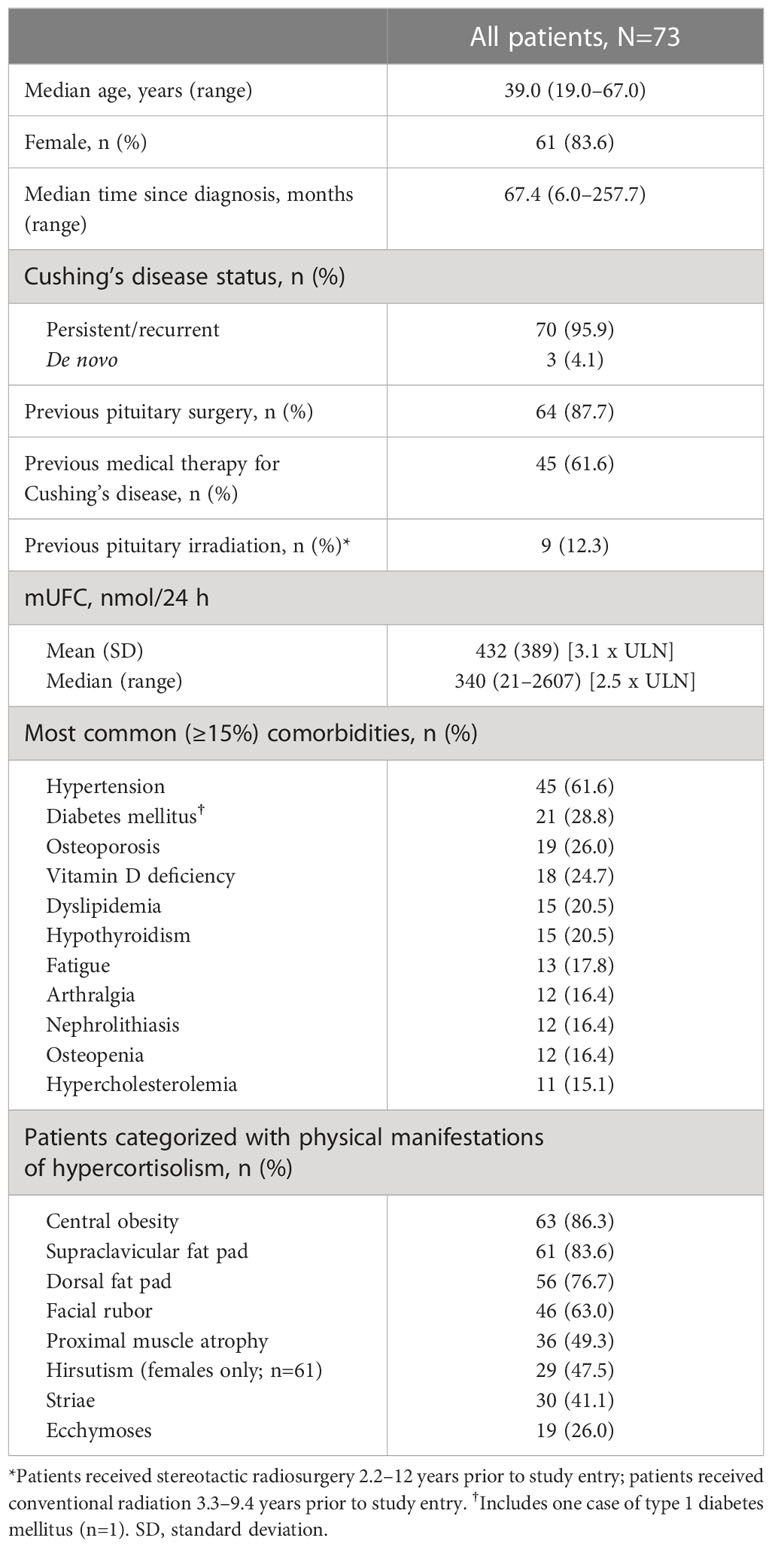
Table 1 Core study patient baseline characteristics.

Exposure to osilodrostat

From core baseline to study end, median (range) osilodrostat exposure was 87.1 (2.0–126.6) weeks; 29 (39.7%) patients were exposed to osilodrostat for more than 96 weeks. The median (25th–75th percentiles) average osilodrostat dose received during the overall study period was 4.6 (3.7–9.2) mg/day; during the core study, median (25th–75th percentiles) average dose was 5.0 (3.8–9.2) mg/day (13). The osilodrostat dose being taken for the longest duration was most frequently 4.0 mg/day (27.4%). Following titration, daily osilodrostat dose remained stable during long-term treatment (Figure 2).

Figure 2
www.frontiersin.org
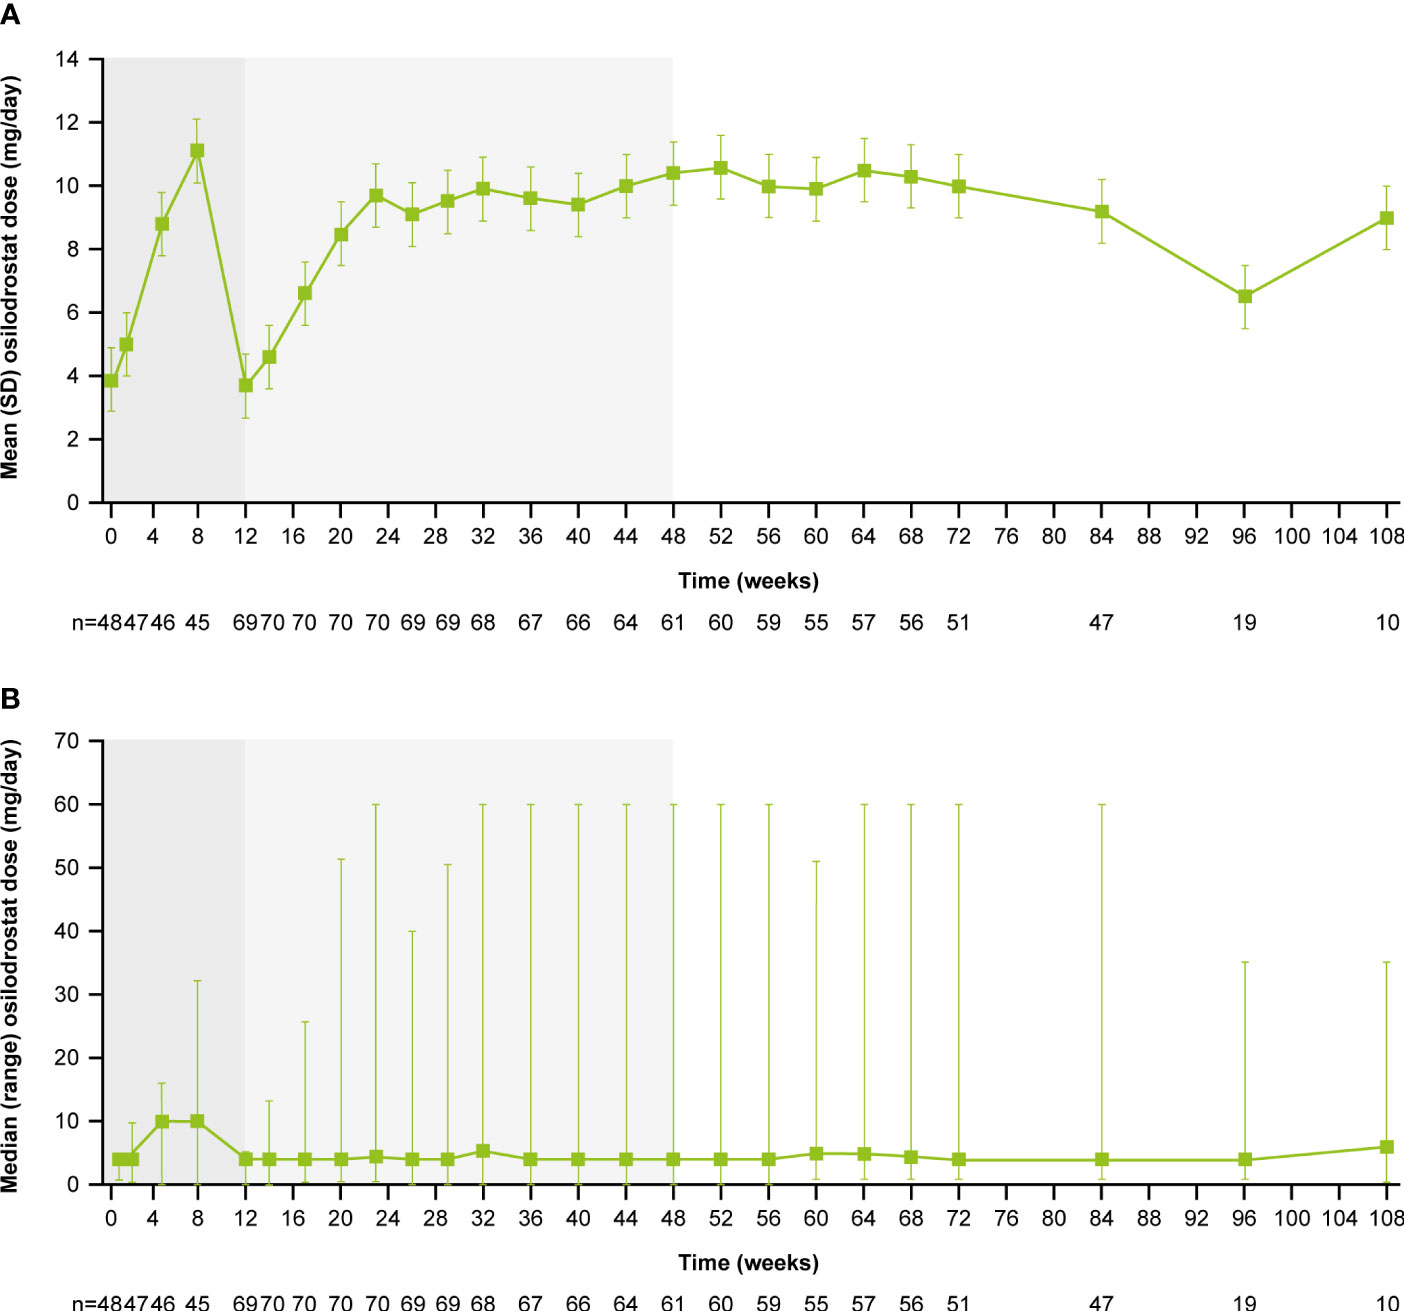
Figure 2 (A) Mean and (B) median osilodrostat dose over time. Shaded areas indicate the randomized, double-blind period and the open-label period of the core phase. According to the study protocol, all patients restarted the open-label period on osilodrostat 2 mg bid unless they were on a lower dose at week 12. All patients on <2 mg bid osilodrostat (or matched placebo) at week 12 continued to receive the same dose, regardless of initial treatment allocation. n is the number of patients who contributed to the mean/median.

Long-term efficacy of osilodrostat treatment

Of patients who had received at least one dose of osilodrostat, 68.5% (n=50/73) had mUFC ≤ULN at the end of the core period, and 54.8% (n=40/73) had mUFC ≤ULN at week 72. Of patients who opted to enter the extension, 66.7% had mUFC ≤ULN (n=40/60) and 8.3% (n=5/60) had mUFC decreased by ≥50% from baseline and >ULN at week 72 (Figure 3A). Of patients with an assessment at their extension EOT visit, 72.4% (n=42/58) had mUFC ≤ULN and 8.6% (n=5/58) had mUFC decreased by ≥50% from baseline and >ULN.

Figure 3
www.frontiersin.org
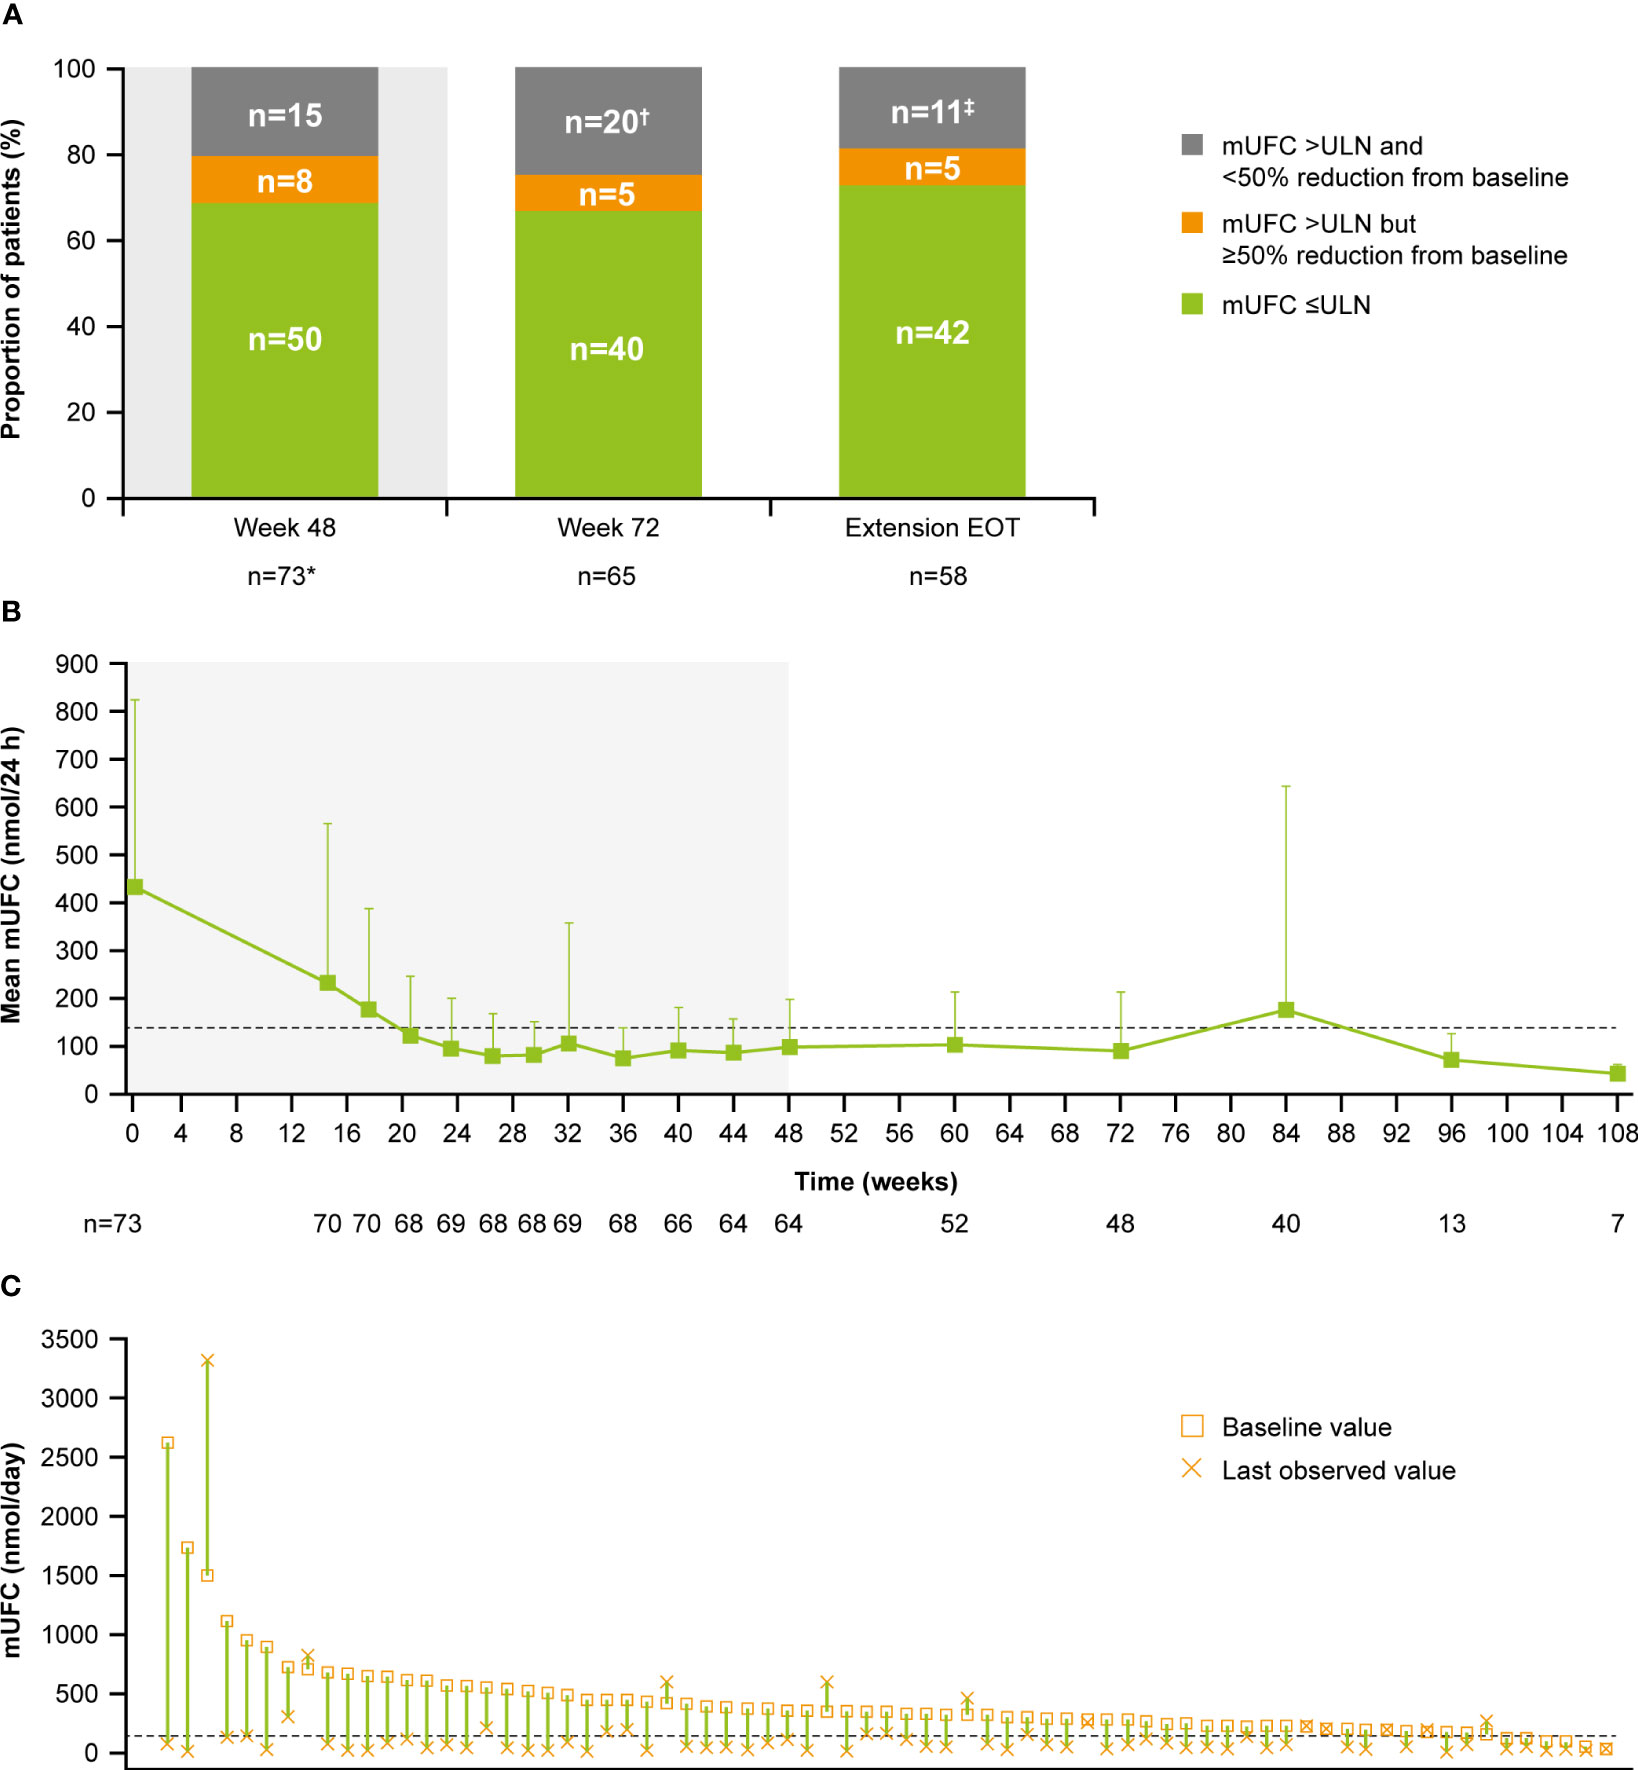
Figure 3 (A) Proportion of patients with mUFC response over time, (B) mean mUFC over time, and (C) individual patient changes in mUFC. (A) Patients with missing mUFC at any visit, including those who had discontinued treatment, were counted as non-responders. Shaded area represents the 48-week core phase; excludes data in placebo arm collected during placebo-control period. *The proportion of patients with mUFC ≤ULN at week 48 was calculated using the full analysis set (patients who had discontinued treatment were classified as non-responders). Discontinued, n=12; missing because of the COVID-19 pandemic, n=4; mUFC not meeting response criteria, n=3; missing (any other reason), n=1. mUFC not meeting response criteria, n=8; missing because of the COVID-19 pandemic, n=2; missing (any other reason), n=1. (B) Shaded areas indicate the randomized, double-blind period and the open-label period of the core phase. n is the number of patients who contributed to the mean. Analysis includes scheduled visits only. (B, C) Dashed line is the ULN for UFC (138 nmol/24 h).

Mean mUFC excretion for the 48-week core period of the study has been reported previously (13); mUFC excretion normalized in patients who received osilodrostat, either during the 12-week randomized period (osilodrostat arm) or during the subsequent 36-week open-label period (all patients) (13). Mean mUFC excretion was maintained within the normal range in the extension period (week 72 (n=48), 90.5 [SD 122.6] nmol/24 h; 0.7 [0.9] x ULN; Figure 3B). Median (range) mUFC excretion is shown in Supplementary Figure 1A. Individual patient changes in mUFC from core study baseline to their last observed visit are shown in Figure 3C. There were no escape-from-response events during the extension phase following the primary analysis cut-off (February 25, 2020) (13).

During the core period, mean (SD) serum cortisol levels decreased from 538.1 (182.3) nmol/L (0.9 [0.3] x ULN) at baseline to 353.9 (124.9) nmol/L (0.6 [0.2] x ULN) at week 48. Serum cortisol levels then remained stable throughout the extension period (week 72: 319.1 [129.8] nmol/L, 0.6 [0.2] x ULN; Figure 4A). LNSC also decreased and then remained stable, although >ULN, throughout the study (baseline: 10.8 [23.5] nmol/L, 4.3 [9.4] x ULN; week 48: 3.7 [2.6] nmol/L, 1.5 [1.0] x ULN; week 72: 3.8 [3.0] nmol/L, 1.5 [1.2] x ULN; Figure 4B). Median serum cortisol and LNSC are shown in Supplementary Figures 1B, C. Of patients with baseline and last observed value (LOV) measurements, 25.0% had normal LNSC at baseline (n=6/24) and 47.8% had normal LNSC at their last visit (n=11/23). Interpretation of this result is limited by the high degree of missing data (baseline: 67.1%, n=49/73; LOV: 68.5%, n=50/73).

Figure 4
www.frontiersin.org
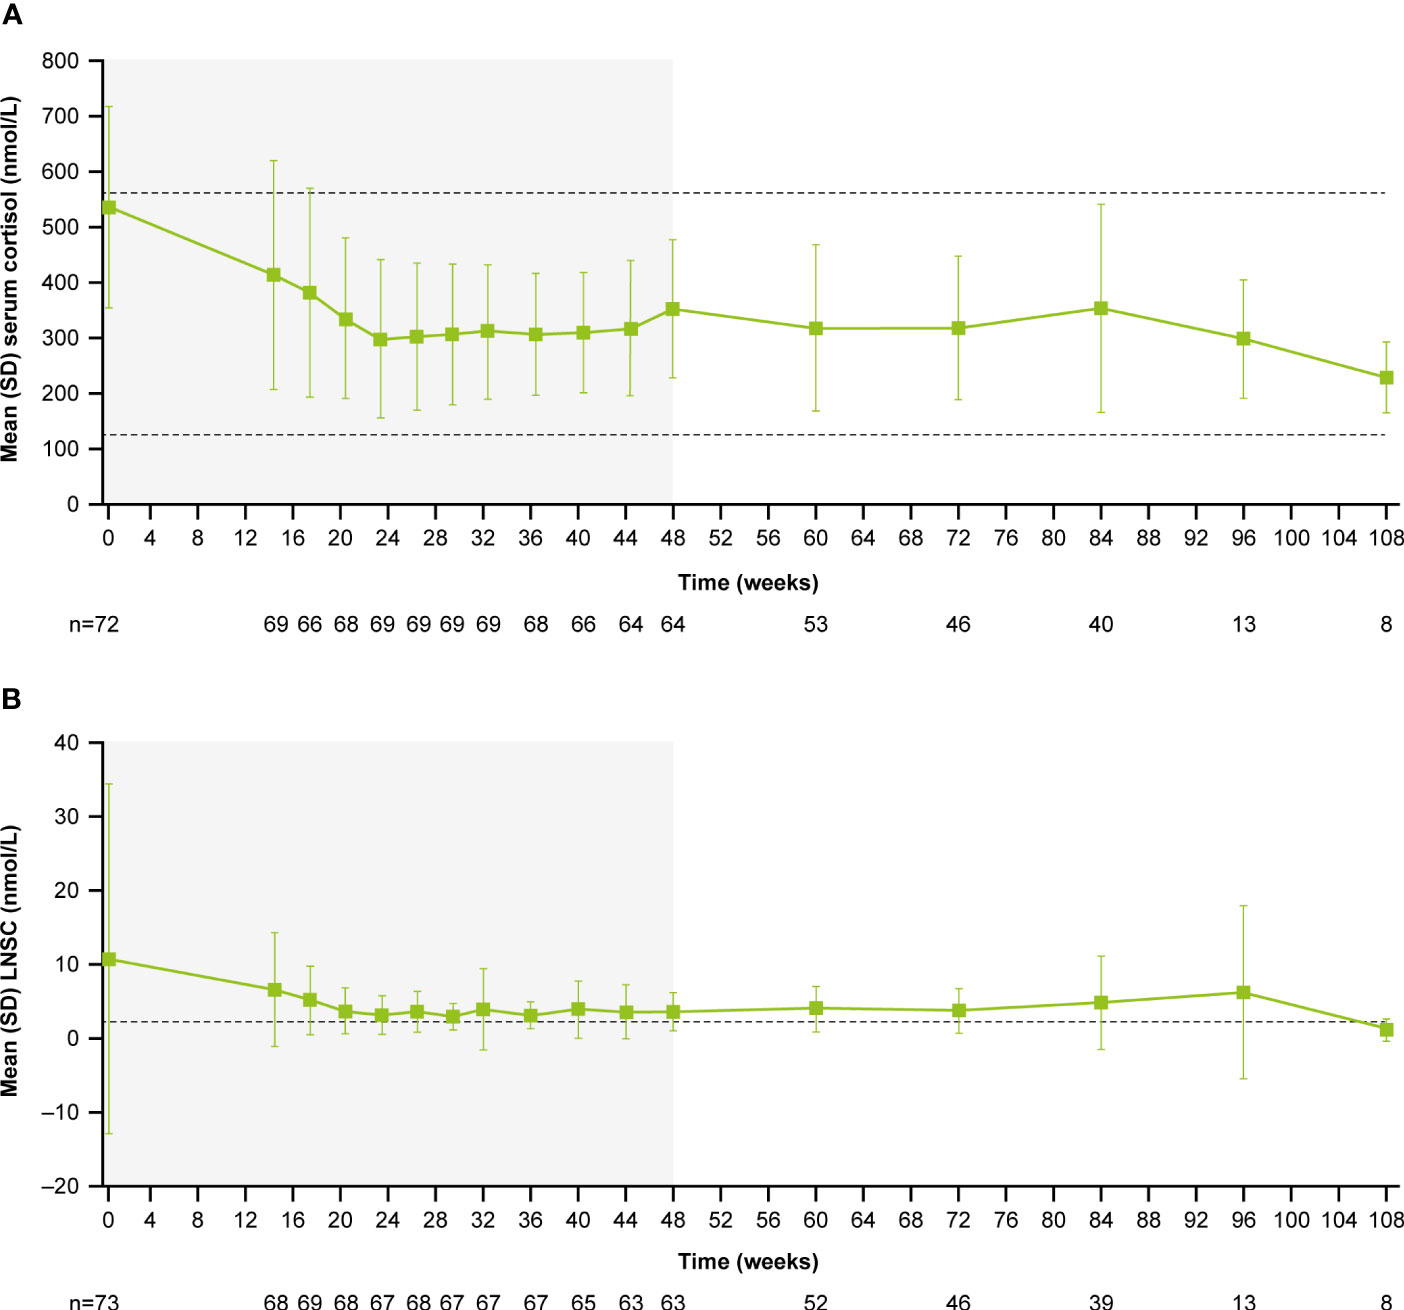
Figure 4 (A) Mean serum cortisol and (B) mean LNSC from baseline to the end of treatment. Shaded areas indicate the randomized, double-blind period and the open-label period of the core phase. n is the number of patients who contributed to the mean. Dashed line in (A) indicates reference serum cortisol range for males and females ≥18 years old (127–567 nmol/L). Dashed line in (B) indicates reference LNSC (22:00–23:00) range for males and females ≥18 years old (≤2.5 nmol/L).

Changes in cardiovascular and metabolic parameters, physical manifestations of Cushing’s disease and patient-reported outcomes

As previously reported, improvements from baseline occurred in most cardiovascular and metabolic-related parameters in the core period following osilodrostat treatment (9). This trend continued during the extension phase and included a reduction in FPG, HbA1c, cholesterol, systolic and diastolic blood pressure, waist circumference, and weight (Figure 5). Similarly, the improvements from baseline in physical features of hypercortisolism observed by week 48 were maintained for most parameters throughout the extension (Figure 6A), with either no change or improvement observed from baseline in ≥90% patients for all parameters at week 72. Facial rubor, supraclavicular fat pad, dorsal fat pad and central obesity had a favorable shift from baseline in ≥40% of patients at week 72. Few patients reported worsening from baseline of specific manifestations (Figure 6A).

Figure 5
www.frontiersin.org
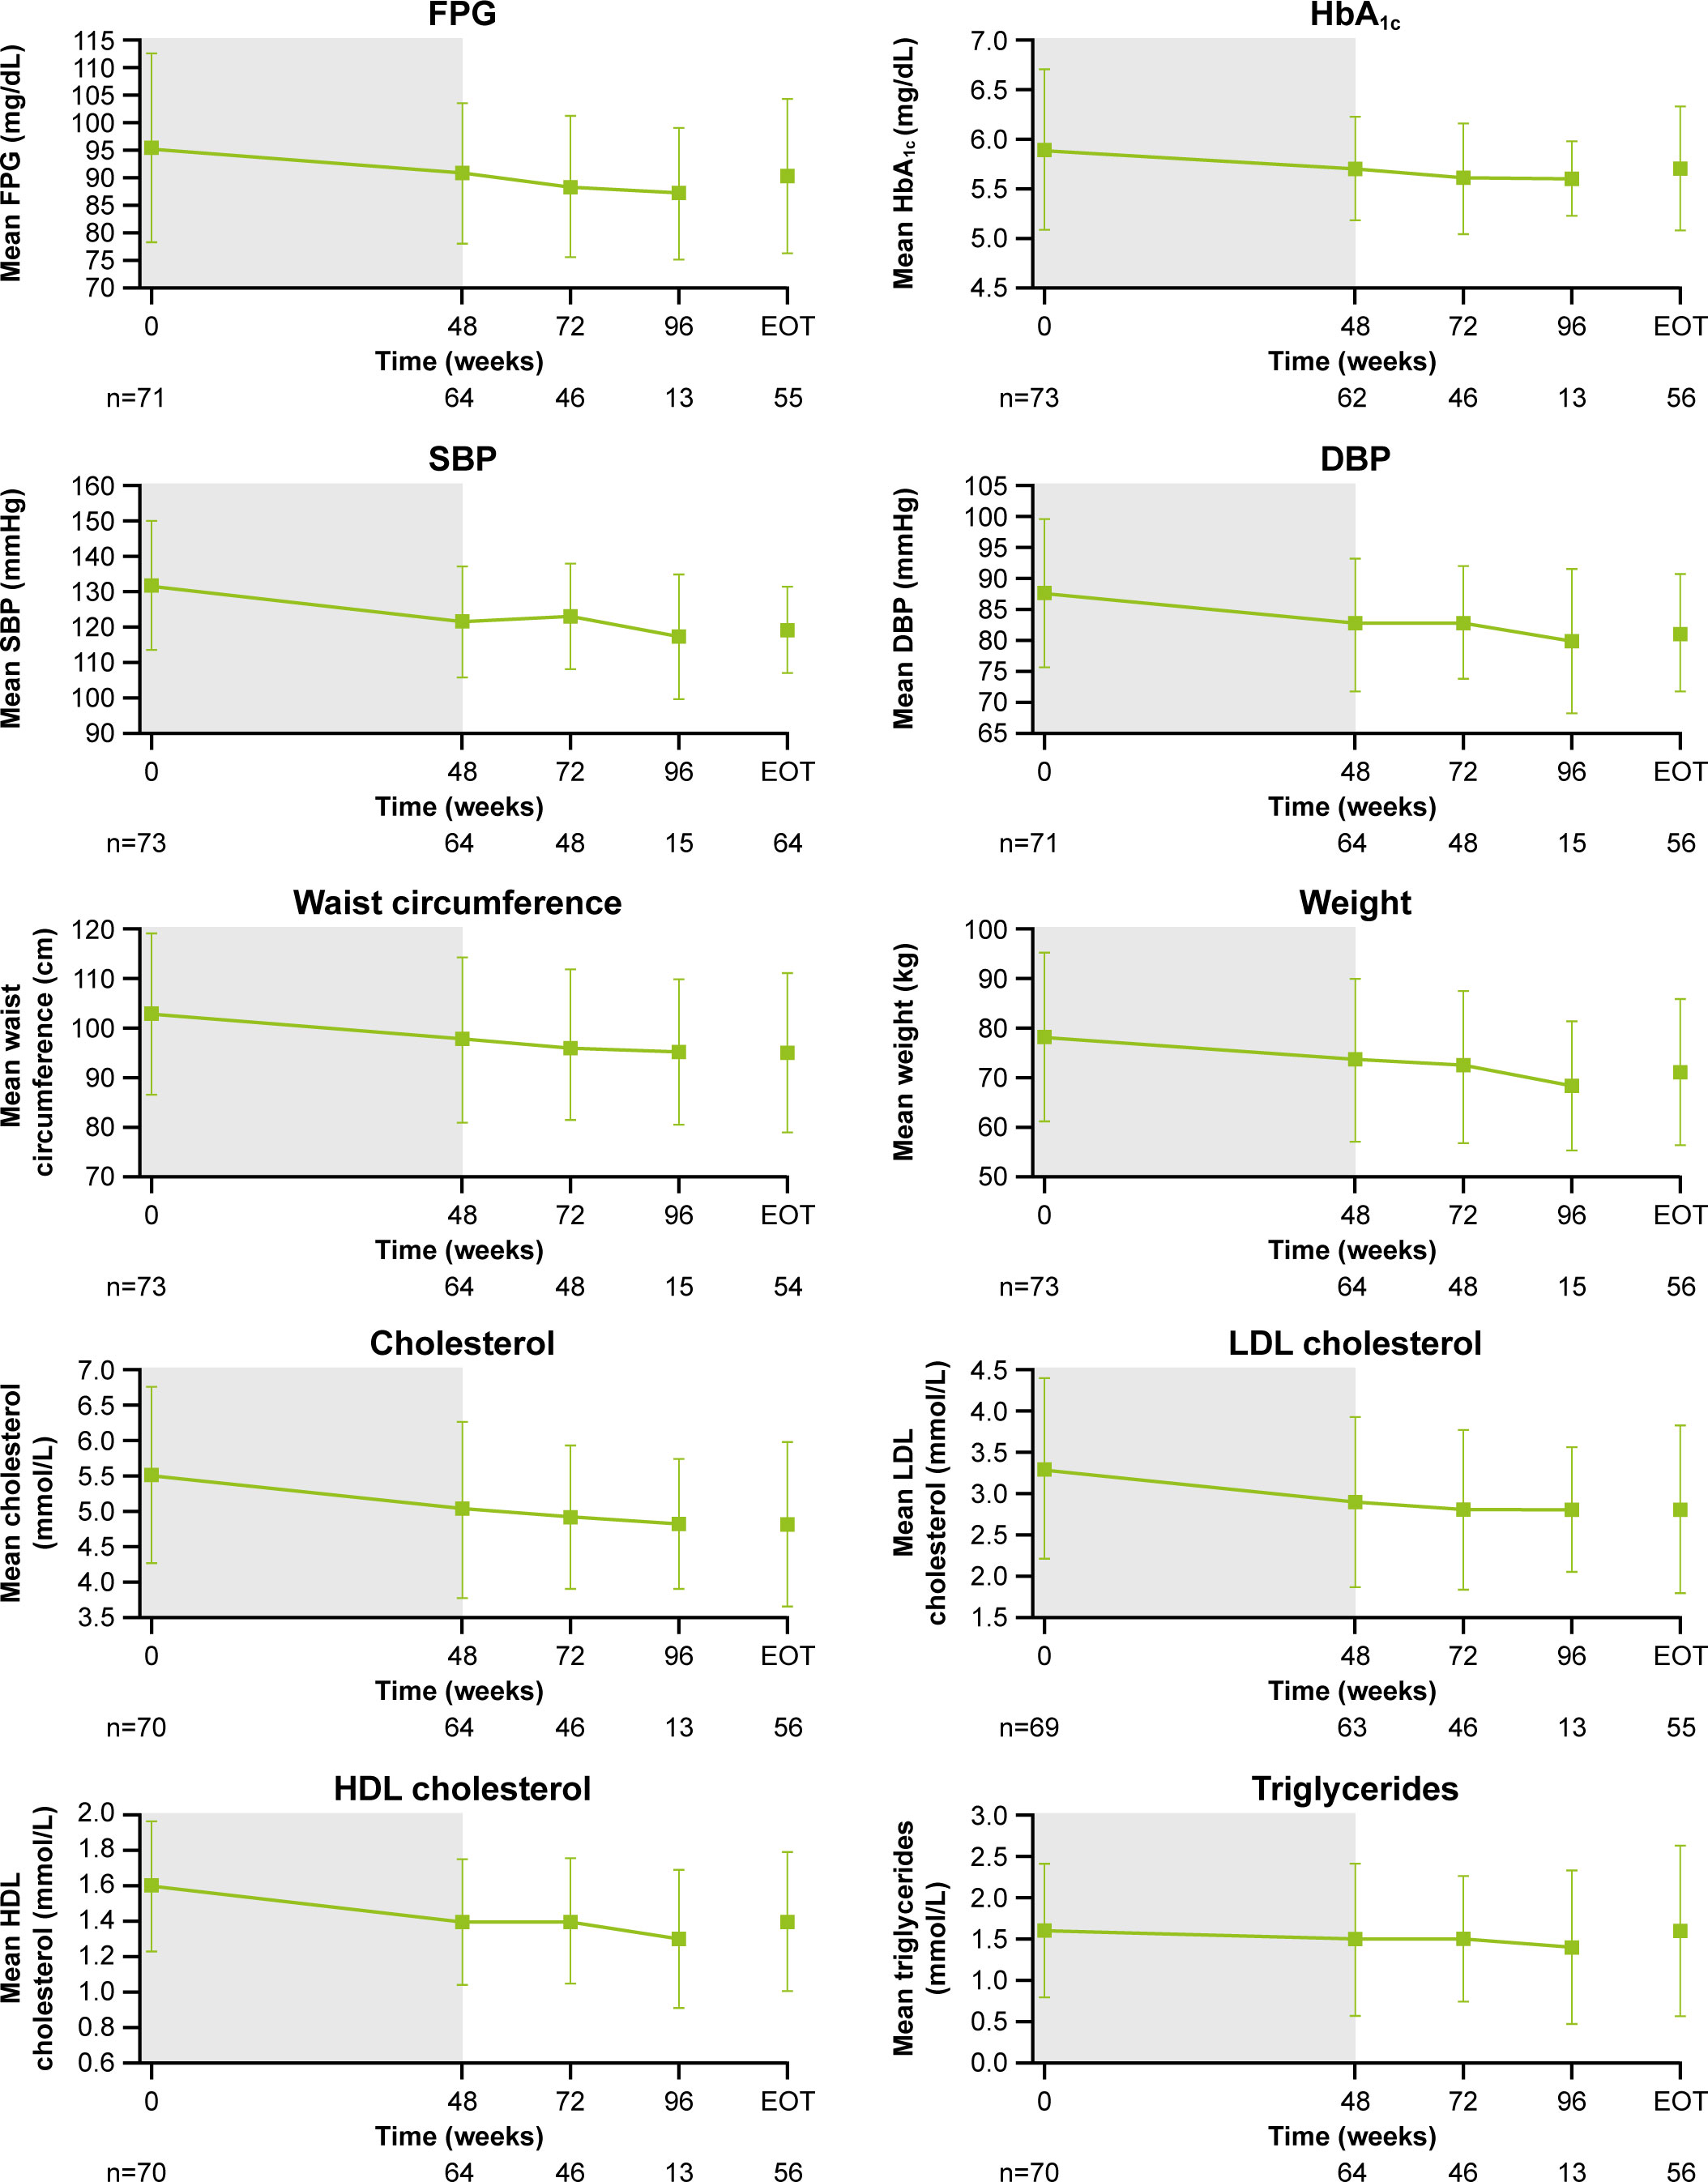
Figure 5 Changes in cardiovascular-related metabolic parameters. Shaded area indicates the core phase. n is the number of patients who contributed to the mean. Error bars indicate standard deviation. DBP, diastolic blood pressure; HDL, high-density lipoprotein; LDL, low-density lipoprotein; SBP, systolic blood pressure.

Figure 6
www.frontiersin.org
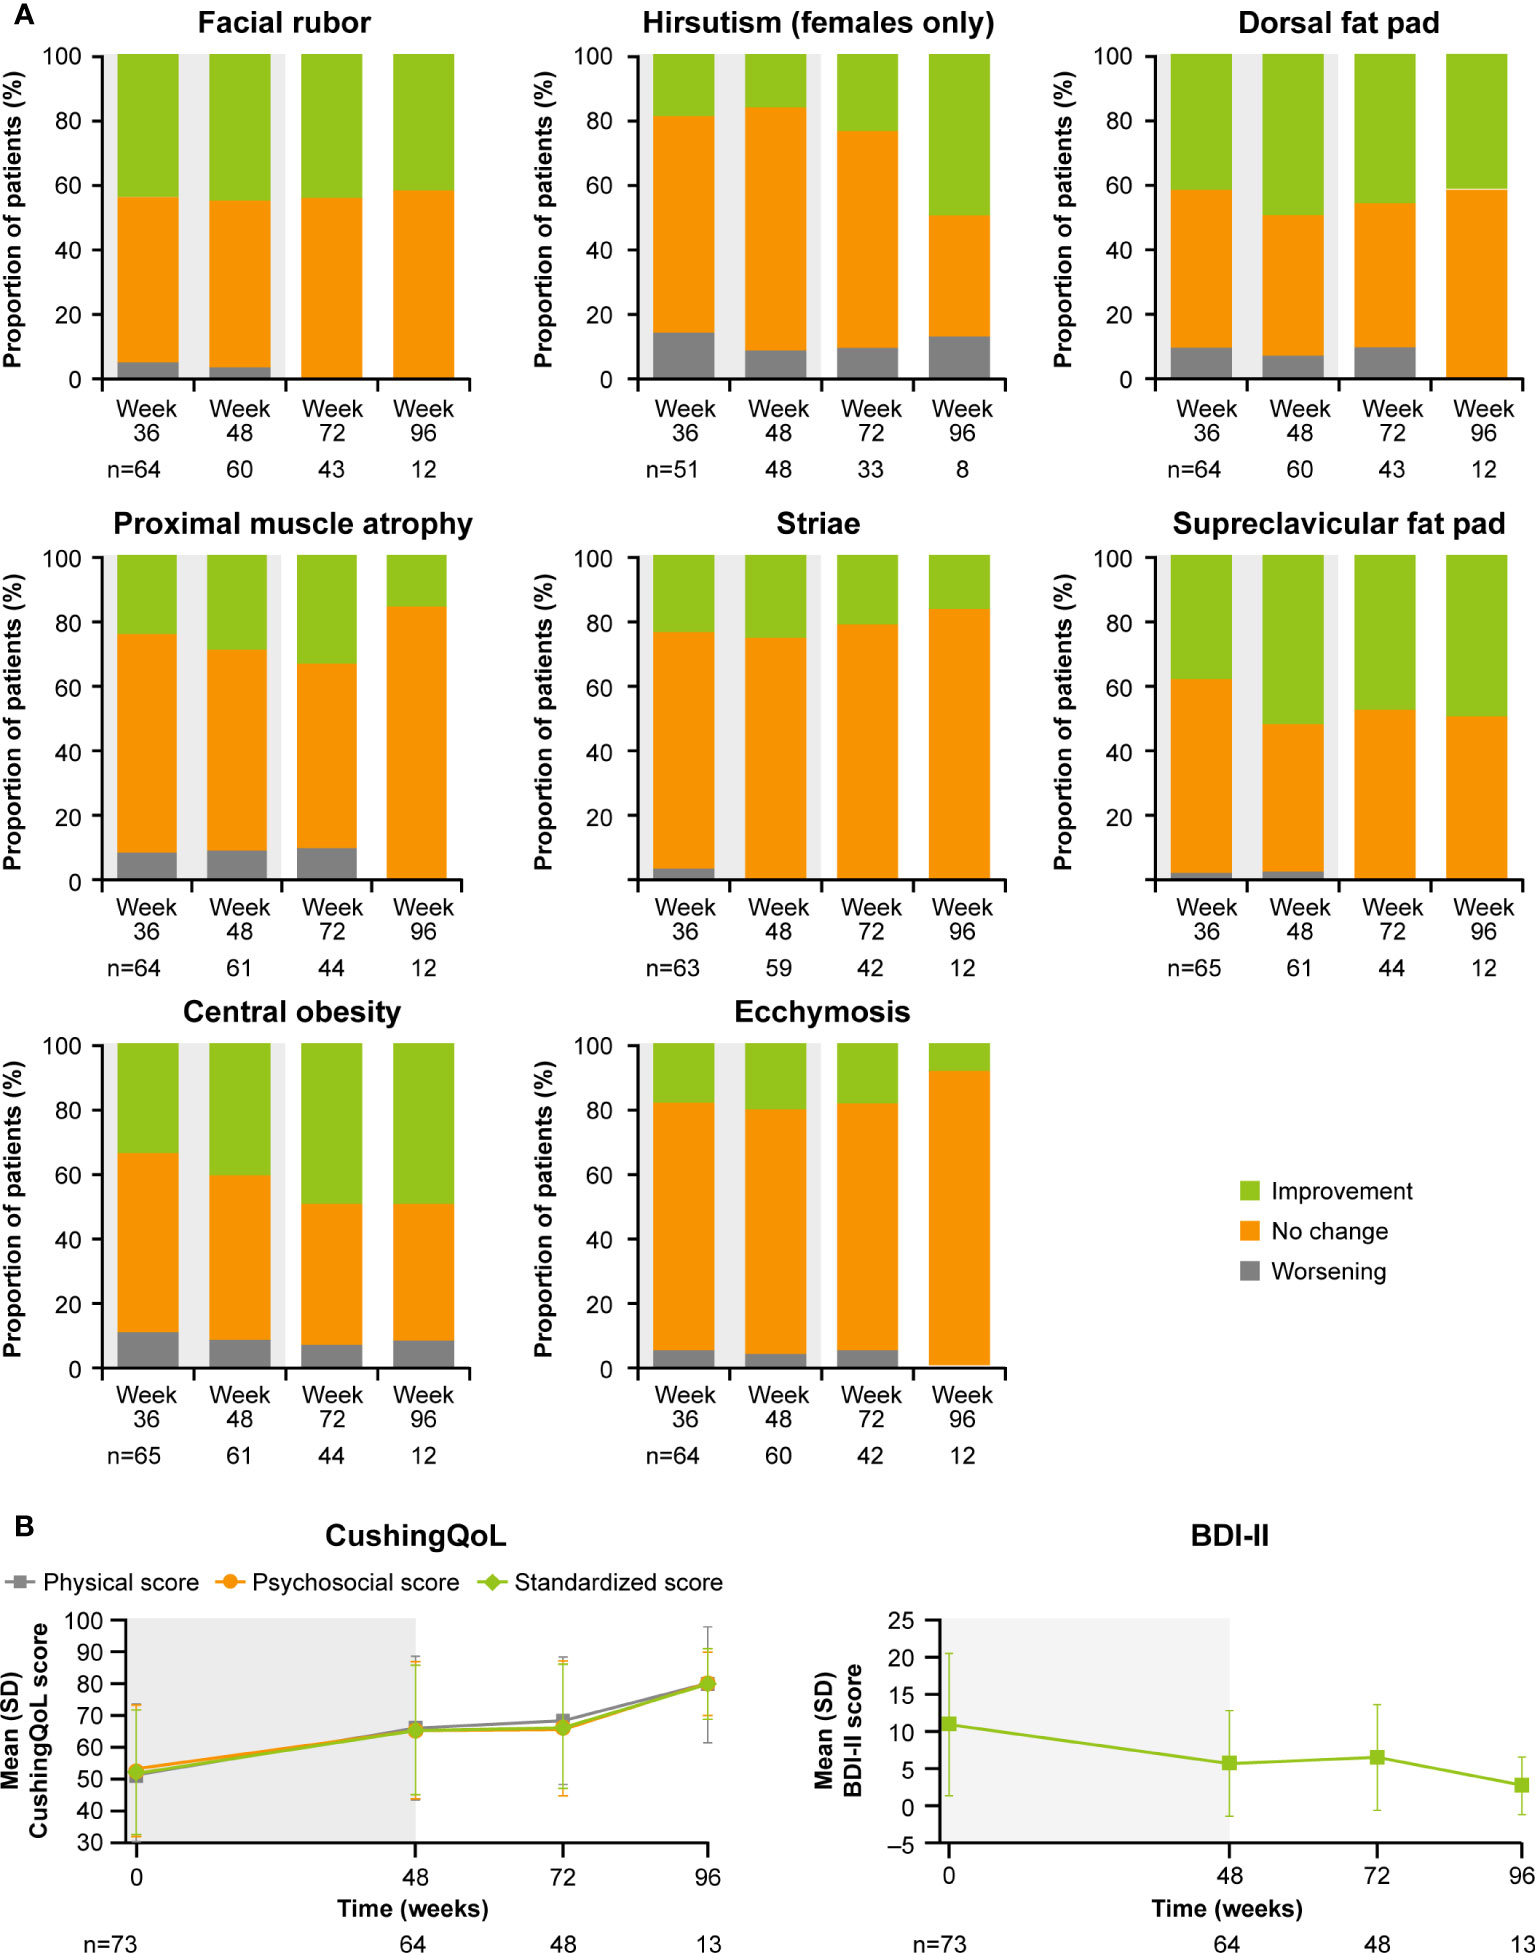
Figure 6 Changes in (A) physical manifestations of Cushing’s disease and (B) patient-reported outcomes. Shaded area indicates the core phase. n is the number of patients who contributed to the mean.

Improvements were also observed in scores for patient quality of life (QoL). Both standardized CushingQoL and BDI-II scores improved steadily during the core phase. QoL scores continued to improve further during the extension. At week 72 and EOT, mean (SD) standardized CushingQoL score was 66.4 (19.6) and 69.0 (20.9), and mean (SD) BDI-II score was 6.5 (7.0) and 6.2 (7.1), representing a mean (SD) change from baseline of 15.2 (19.0) and 17.1 (17.1) and −4.1 (9.3) and −4.5 (7.9), respectively (Figure 6B).

Adverse events

AEs that occurred in >20% of patients, irrespective of study-drug relationship, during the entire study period (median [range] osilodrostat exposure for all patients: 87.1 [2.0–126.6] weeks; excluding data collected in the placebo arm during the placebo-controlled period) are shown in Table 2. The most common AEs were decreased appetite (46.6%), arthralgia (45.2%) and fatigue (39.7%). Most AEs were mild or moderate; 60.3% were reported as grade 1/2 (Table 2).

Table 2
www.frontiersin.org
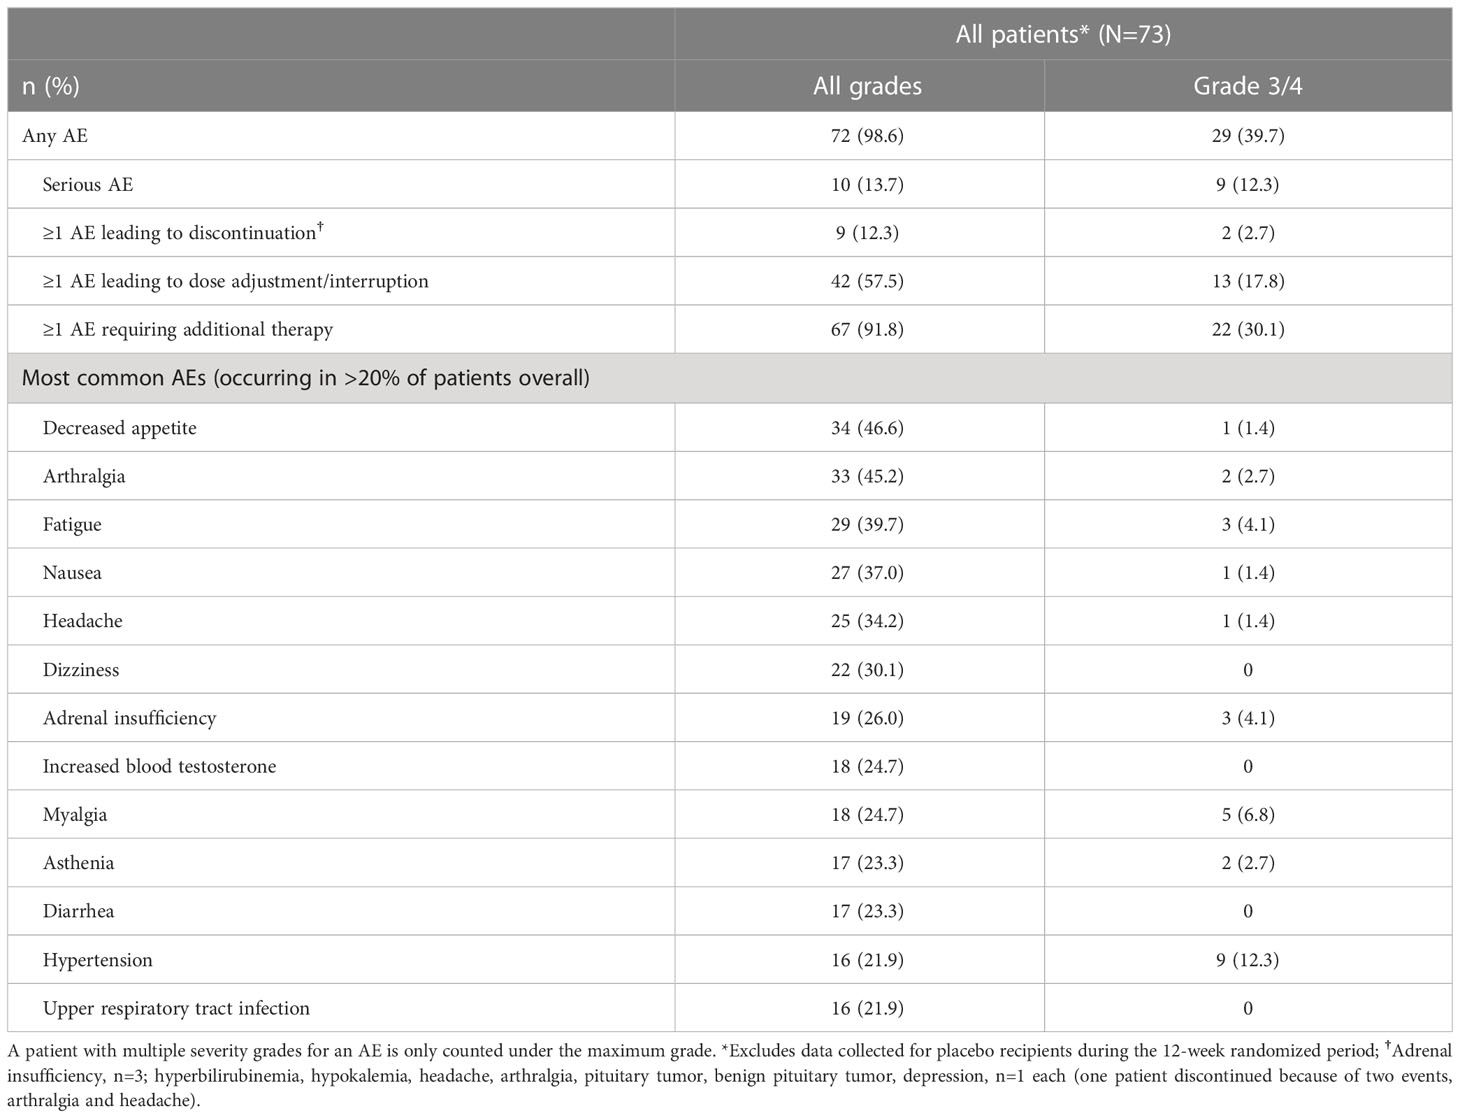
Table 2 Summary of adverse events during LINC 4 core and extension periods.

Overall, 10 AEs (adrenal insufficiency, n=3; hyperbilirubinemia, hypokalemia, headache, arthralgia, pituitary tumor, benign pituitary tumor, and depression, n=1 each) in nine patients (12.3%; one patient experienced both arthralgia and headache) led to treatment discontinuation. For two patients (2.7%), those AEs were reported as grade 3 (hyperbilirubinemia and hypokalemia). One patient discontinued following the primary analysis cut-off date (February 25, 2020).

The most common AESIs in both the core and extension periods were those related to adrenal hormone precursors. However, the proportion of patients reporting these AESIs was lower in the extension than in the core period (Figure 7). AESIs related to hypocortisolism were most frequent during the core period but did occur throughout the remainder of the study, albeit at lower frequency (Figure 7). Hypocortisolism-related AEs were most frequently managed with temporary osilodrostat interruption (n=20) or dose adjustment (n=6), and with concomitant glucocorticoids (n=15). There were no new occurrences of AESIs related to arrhythmogenic potential and QT prolongation, or to pituitary tumor enlargement, in the extension (Figure 7). During the entire study period from core baseline to the end of the extension, AESIs led to osilodrostat discontinuation in six (8.2%) patients (n=1, related to accumulation of adrenal hormone precursors [hypokalemia]; n=3, related to hypocortisolism [all adrenal insufficiency]; n=2, related to pituitary tumor enlargement [pituitary tumor and pituitary tumor benign]).

Figure 7
www.frontiersin.org
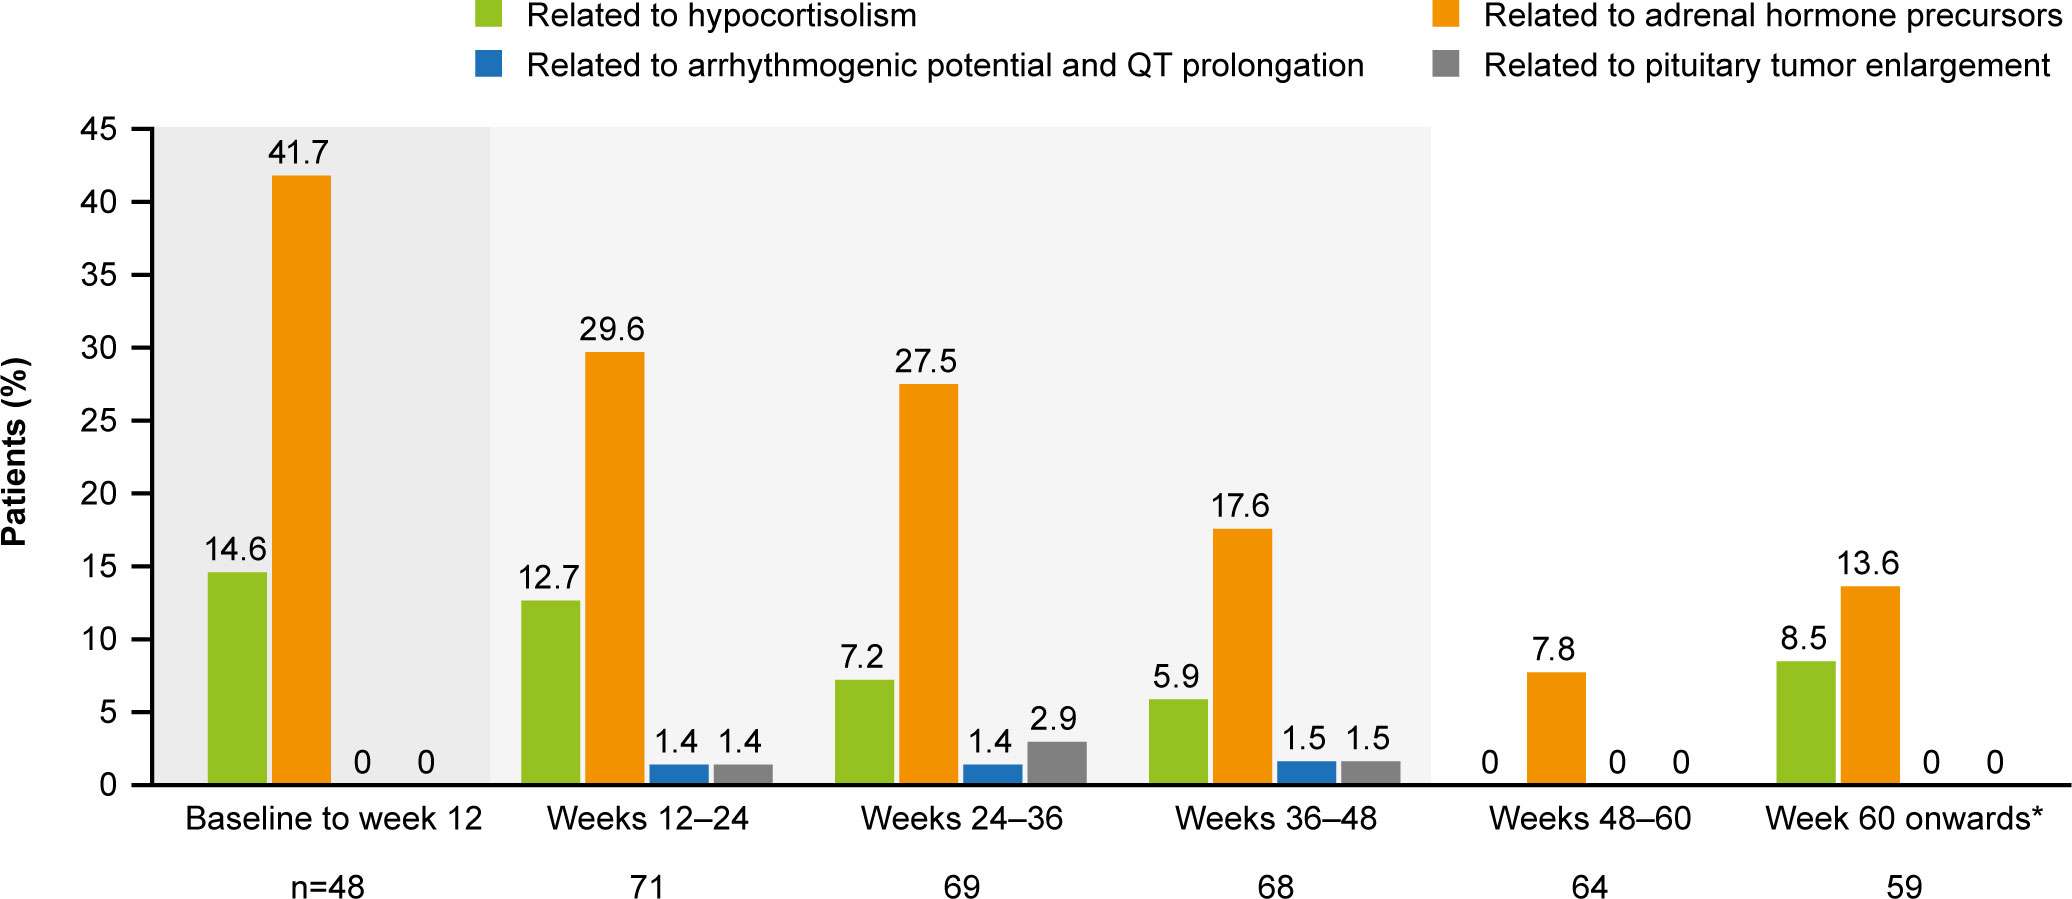
Figure 7 Occurrence of AESIs by time interval. The denominator for each time period only included patients who had at least one scheduled visit, or at least one observed AE, during that period. From baseline to week 12, the denominator only included patients randomized to osilodrostat. A patient with multiple occurrences of an AE within the same period is counted only once in that period. However, if an AE ends and occurs again in a different period, it is then counted in both periods. Shaded areas indicate the randomized, double-blind period and the open-label period of the core phase. *Maximum duration of follow-up was 127 weeks.

Following an increase in 11-deoxycortisol and 11-deoxycorticosterone during the core study, levels tended to decrease during longer-term treatment (Figure 8). From baseline to LOV, the proportion of patients with elevated 11-deoxycorticosterone and 11-deoxycortisol levels increased from 10.0% (n=1/10) to 90.0% (n=9/10) and from 57.9% (n=33/57) to 86.7% (n=5 and 2/60), respectively. In female patients, mean (SD) testosterone levels increased from 1.1 (0.6) nmol/L at baseline to 2.5 (2.6) nmol/L at the end of the core phase, then decreased to within the normal range (0.7−2.6 nmol/L for females) by the extension phase end-of-treatment visit (1.9 [1.7] nmol/L; Figure 8). The proportion of females with an elevated testosterone level increased from 15.0% (n=9/61) at baseline to 63.2% (n=24/61) at week 72 and then reduced to 41.7% (n=25/61) at LOV. In males, testosterone levels increased and remained within the normal range throughout osilodrostat treatment (Figure 8). The proportion of male patients with testosterone levels below the lower limit of normal decreased from 58.3% (n=7/12) at baseline to 33.3% (n=4/12) at LOV. The proportion of patients experiencing AEs potentially related to increased testosterone (increased blood testosterone, acne and hirsutism) was lower during the extension than during the core study (Supplementary Figure 2). Mean serum potassium levels remained stable and within the normal range (3.5–5.3 mmol/L) throughout osilodrostat treatment (Figure 8). The proportion of patients with a normal potassium level was similar between baseline (98.6%, n=72/73) and LOV (94.4%, n=68/72).

Figure 8
www.frontiersin.org
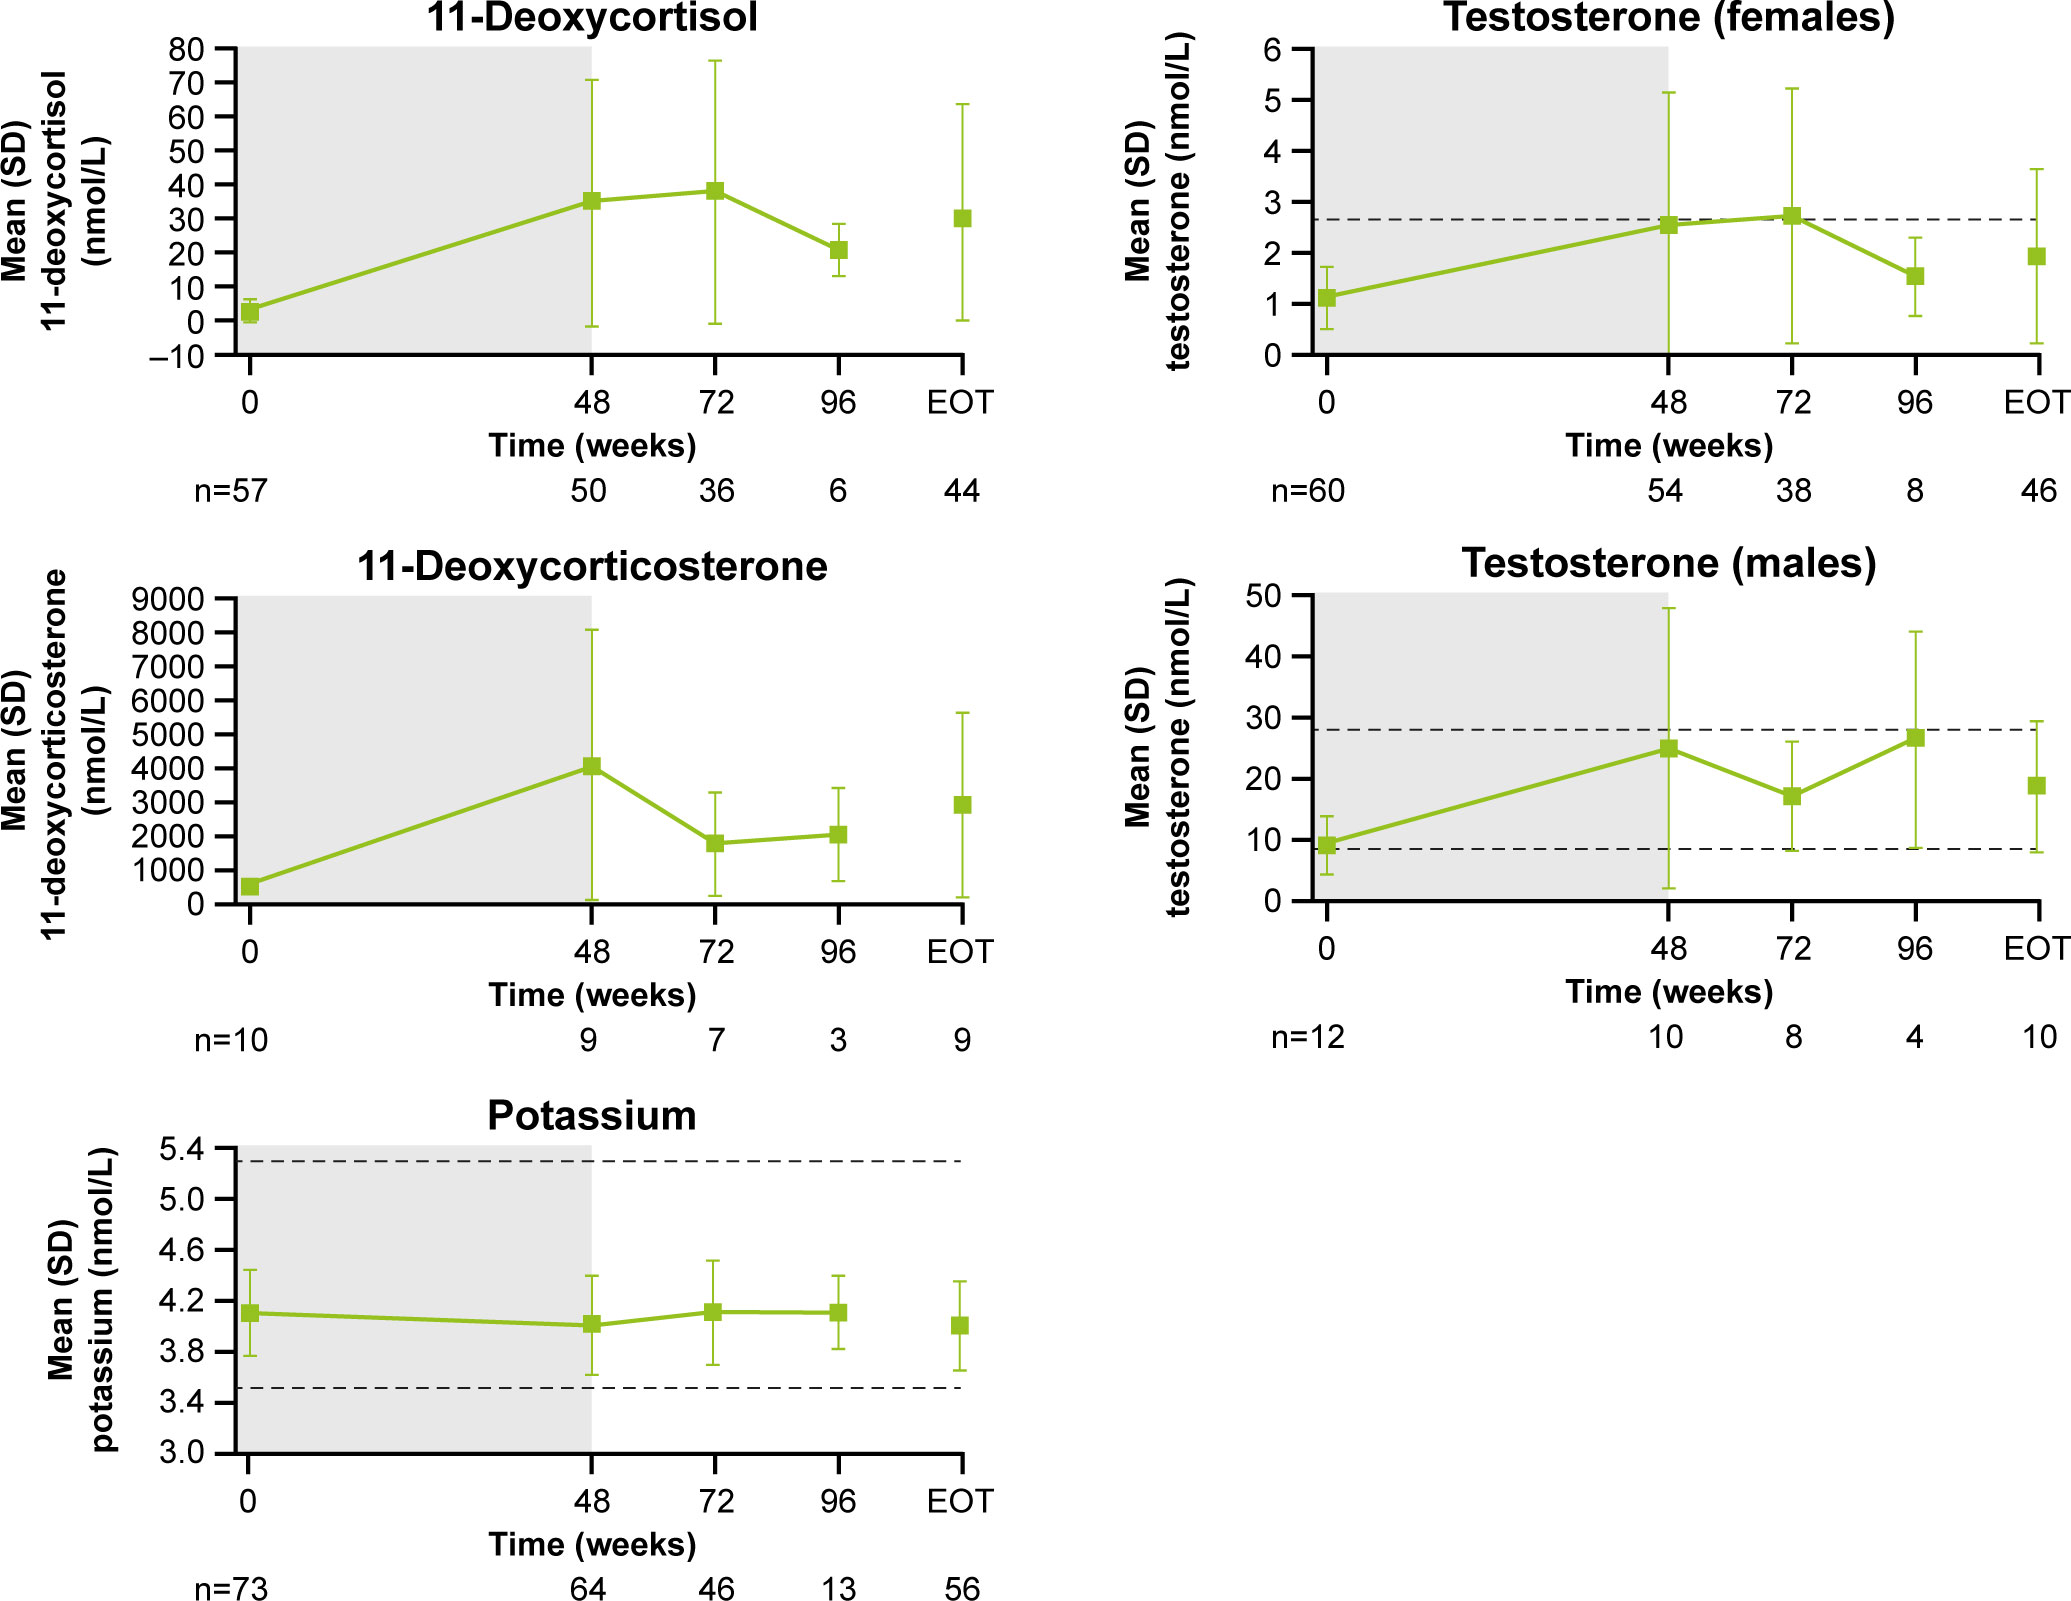
Figure 8 Mean (± SD) levels up to the end-of-treatment visit in the extension phase for 11-deoxycortisol, 11-deoxycorticosterone, potassium and testosterone (in males and females). Shaded area indicates the core phase. n is the number of patients who contributed to the mean. Reference ranges: 11-deoxycortisol ULN, 3.92 nmol/L in males and 3.1 nmol/L in females, or lower depending on age; 11-deoxycorticosterone ULN, 455 pmol/L in males and 696 pmol/L in females (mid-cycle); potassium, 3.5–5.3 mmol/L; testosterone, 8.4–28.7 nmol/L in males and 0.7–2.6 nmol/L in females.

At baseline, median (range) tumor volume was 82.0 (12.0–2861.0) mm3; 28.8% (n=21/73) of patients had a macroadenoma (≥10 mm) and 68.5% (n=51/73) had a microadenoma (<10 mm). At week 72, median (range) tumor volume was 68.0 (10.0–3638.0) mm3 (Figure 9A). Of the 27 patients with measurements at both baseline and week 72, 29.6% (n=8/27) had a ≥20% decrease in tumor volume and 37.0% (n=10/27) had a ≥20% increase (Figure 9B). Notably, mean (SD) plasma ACTH increased steadily between baseline (17.1 [32.1] pmol/L, n=73) and week 72 (65.0 [96.9] pmol/L, n=45; Figure 9C); mean ACTH levels appeared to stabilize after week 72. All patients experienced an increase in ACTH levels from baseline to week 72 (n=45) and LOV (n=73); of these, 34/45 (75.6%) and 47/73 (64.4%) experienced an increase in ACTH of ≥2 × baseline levels to week 72 and to LOV, respectively. There was no correlation between change in tumor volume and change in ACTH from baseline to week 72 (r=0.1; calculated without two extreme outliers).

Figure 9
www.frontiersin.org
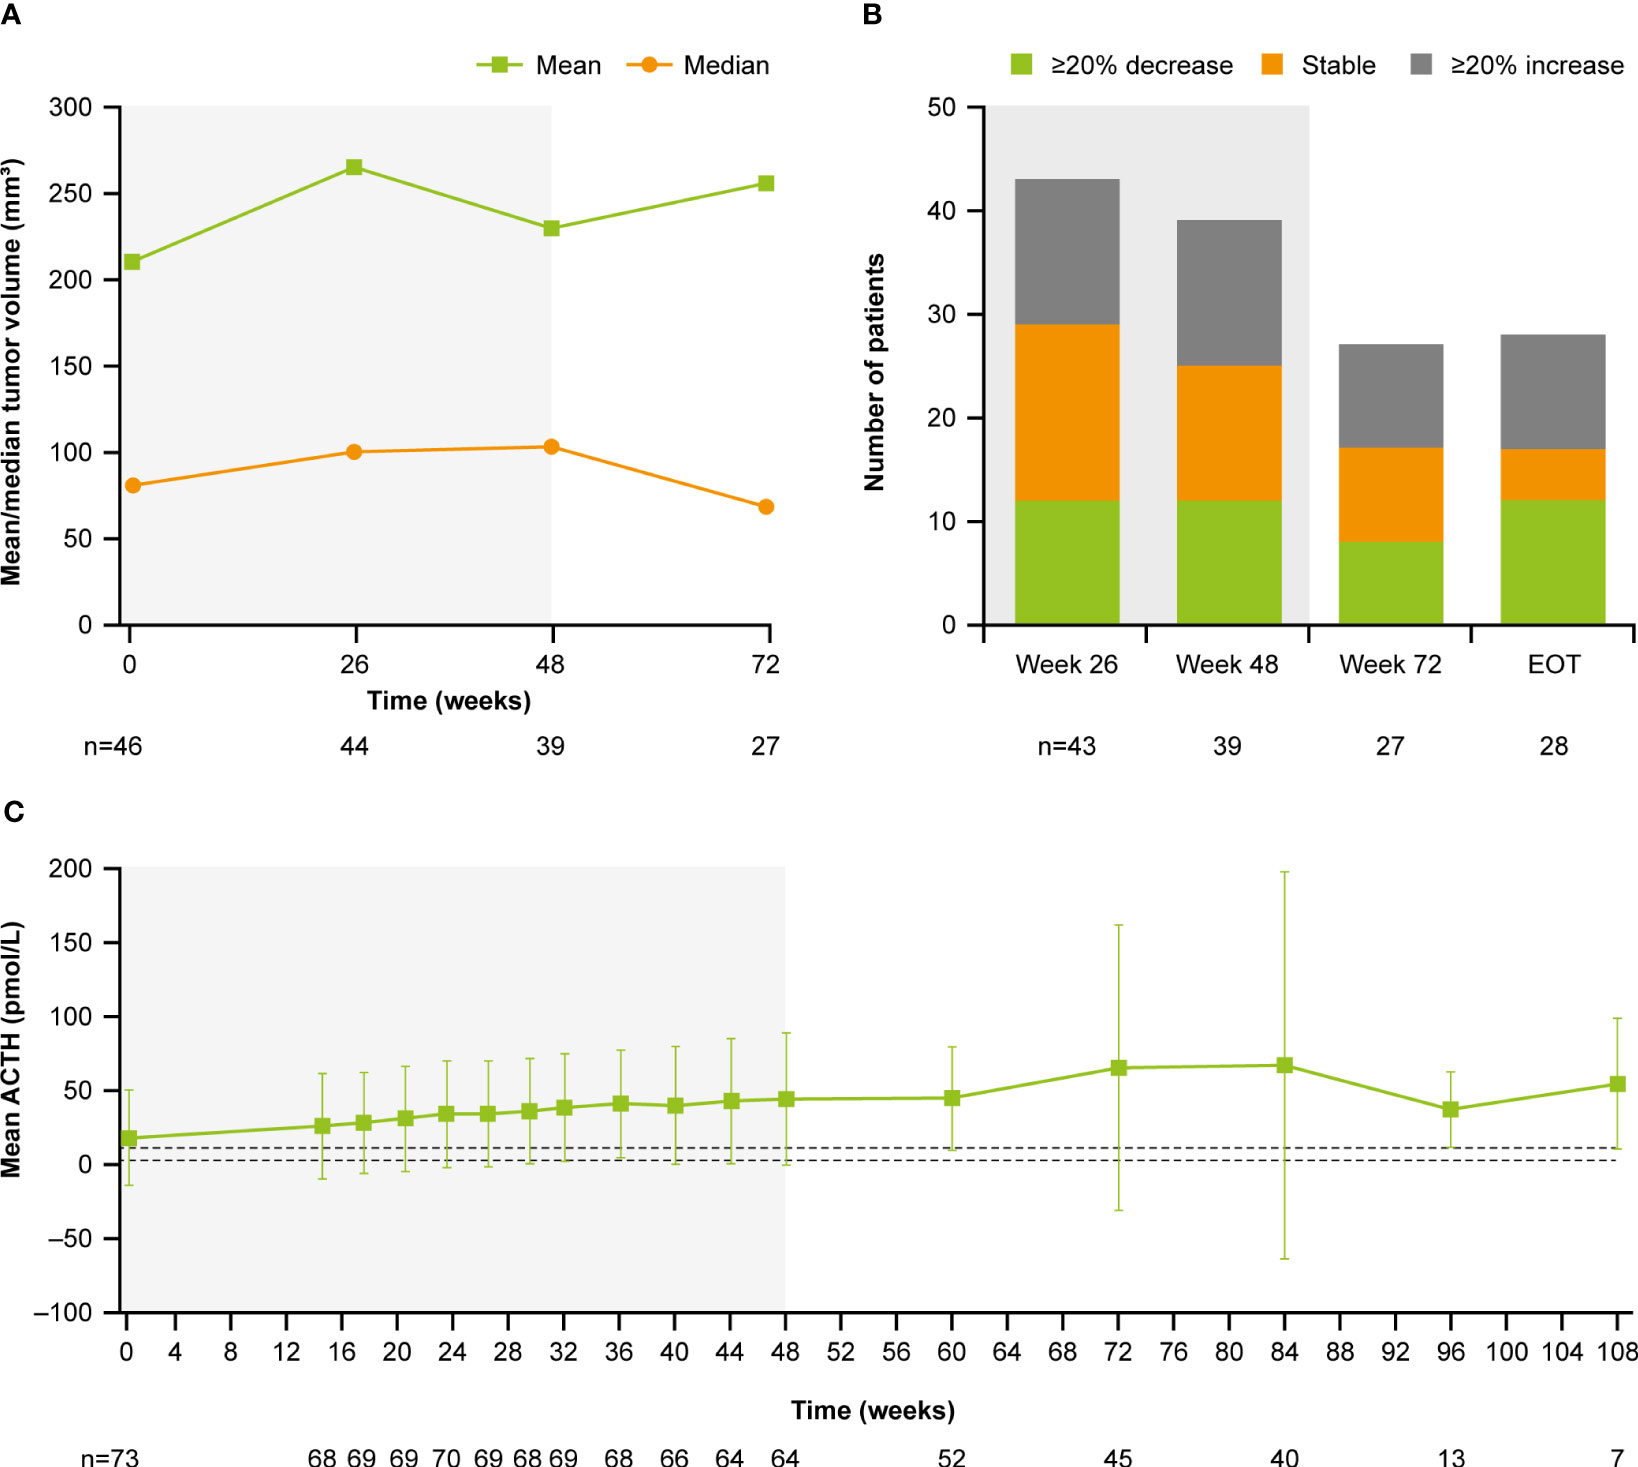
Figure 9 (A) Mean and median tumor volume over time, (B) number of patients with a change in tumor volume from baseline, and (C) mean ACTH over time. Shaded areas indicate the core phase. n is the number of patients who contributed to the mean. Dashed lines in (C) indicate reference morning (07:00–10:00) plasma ACTH ranges for males and females ≥18 years old (1.3–11.1 pmol/L).

Discussion

Following transsphenoidal surgery, approximately one-third of patients experience persistence or recurrence of disease and subsequently require further treatment to control excess cortisol secretion (4). It is therefore essential that clinical studies evaluating the long-term safety and efficacy of potential new treatments, such as osilodrostat, are performed. The data presented here from the LINC 4 extension reinforce previous reports demonstrating that osilodrostat is effective and well tolerated during long-term treatment of Cushing’s disease (781314).

The normalization of mUFC excretion, observed from as early as week 2 in some patients (13), was sustained to the end of the optional open-label extension phase. Overall, the response rate was durable and remained ≥60% throughout the study, with 72.4% of patients maintaining mUFC ≤ULN at their extension EOT visit. Considering the range in baseline mUFC values (21.4–2607.3 nmol/24 h), this indicates that patients can benefit from osilodrostat treatment regardless of their baseline mUFC level. This also suggests that baseline mUFC is not an indicator of whether a patient will respond to osilodrostat treatment. Notably, there were no escape events during the extension period. Additionally, the improvements in most cardiovascular and metabolic parameters, physical manifestations and QoL previously reported during the 48-week core phase were maintained or further improved with long-term treatment (13). Collectively, these results demonstrate the ability of osilodrostat to reduce the burden of disease and comorbidities frequently experienced by patients with Cushing’s disease.

mUFC excretion is commonly assessed in clinical trials and during routine clinical practice to evaluate response to treatment. It is also important to monitor the recovery of the circadian cortisol rhythm in response to treatment by measuring serum cortisol and LNSC (61517). Elevated LNSC levels have been linked to dysregulation in glucose tolerance, insulin sensitivity and insulin secretion (18). As such, one potential explanation for persistent comorbidities in some patients with normalized mUFC excretion is that LNSC, although reduced, remains just above the ULN. Assessment of LNSC during treatment with other medical therapies has been reported, although differences in treatment duration and patient population type and size limit meaningful comparisons between therapies (1517). In LINC 4, mean serum cortisol levels remained within the normal range. Mean LNSC improved considerably from baseline but remained above the ULN throughout the study; 47.8% (n=11/23) of patients achieved normalized LNSC at their LOV visit. A numerically large decrease in LNSC, but with mean levels remaining above the ULN, is consistent with previous reports during long-term osilodrostat treatment (8); the mechanism underlying this observation is currently unknown. In real-life clinical practice, the osilodrostat label allows flexible dosing (911), which may help achieve normalization of LNSC. Furthermore, the number of patients with available LNSC assessments was limited, particularly during the extension; therefore, the data should be interpreted with caution. Future studies should examine whether patients with normalization of both UFC and LNSC have better outcomes than patients with only normalized UFC.

Overall, the safety findings reported here for the extension period were consistent with those reported in the primary analysis (13) and previous clinical trials (7814). Osilodrostat was generally well tolerated throughout the study; most reported AEs were mild or moderate in severity and manageable. Only nine of 73 (12.3%) patients discontinued osilodrostat at any time because of an AE (3/73 [4.1%] prior to week 48; 6/60 [10.0%] after week 48). Given that osilodrostat is a potent inhibitor of 11β-hydroxylase, AEs related to hypocortisolism or increased levels of adrenal hormone precursors are expected. The frequency of these AEs was lower in the extension period than in the core period, although events did still occur, highlighting the importance of monitoring patients regularly throughout long-term osilodrostat use. AEs potentially related to arrhythmogenic potential and QT prolongation remained infrequent throughout the study. Furthermore, the clinical benefit and tolerability of osilodrostat is supported by the high proportion of patients who chose to continue into the extension period: 92.3% who completed the core phase continued into the optional extension phase, with 88.3% of those completing the extension.

Although dose adjustments were allowed in the open-label phase, the dose of osilodrostat remained stable over long-term treatment, with 4 mg/day adequate for most patients to achieve and sustain control of mUFC excretion. Most AEs related to hypocortisolism occurred during the dose-escalation periods of both LINC 4 (27%) and LINC 3 (51%) (19); the lower occurrence in LINC 4 than LINC 3 may have been related to the more gradual dose-escalation schedule of LINC 4 (every 3 weeks) relative to that of LINC 3 (every 2 weeks) (131419). As such, an increased dose-titration interval could be considered when there is a need to mitigate the potential for glucocorticoid withdrawal syndrome or hypocortisolism-related AEs following a rapid decrease in cortisol. Dose-increase decisions should be informed by regular cortisol assessments, the rate of decrease in cortisol, and the individual’s clinical response and tolerability to osilodrostat. Furthermore, as with all steroidogenesis inhibitors, patients should be educated on the expected effects of treatment and dose increases, with a particular focus on the symptoms of hypocortisolism and the advice to contact their physician if they occur.

As expected, levels of 11-deoxycortisol, 11-deoxycorticosterone and, in women, testosterone increased during osilodrostat treatment. These then decreased during long-term treatment; notably, testosterone levels in women returned to within the normal range and to near baseline levels. These observations are consistent with the findings of LINC 3, which also demonstrated that these increases were reversible following discontinuation of osilodrostat (14). Compared with the primary analysis, there were no new AEs of increased testosterone in the extension phase of LINC 4; these findings are consistent with both LINC 2 and LINC 3 long-term analyses (78).

In general, osilodrostat did not adversely affect pituitary tumor volume, with similar proportions of patients reporting either a ≥20% decrease, ≥20% increase or stable tumor volume throughout the study. Although ACTH levels increased during osilodrostat treatment, there was no apparent correlation between the change in ACTH and the change in tumor volume after 72 weeks of treatment; however, longer-term data are needed to evaluate this further. As ACTH-producing pituitary adenomas are the underlying drivers of hypercortisolism, in turn responsible for the high morbidity and poor QoL associated with the disease, tumor stability is of great clinical importance in patients with Cushing’s disease, especially those for whom surgery has failed or is not a viable option.

In addition to LINC 4, other studies have assessed the long-term efficacy and safety of other medical therapies (2024); however, there is a paucity of prospective, long-term data. For metyrapone, an oral steroidogenesis inhibitor that is given three or four times daily (25), prospective data are currently only available for 36 weeks of treatment in the Phase III/IV PROMPT study (2223). Normalization of mUFC excretion was observed in 48.6% (n=17/35) of patients at week 36 (23), and gastrointestinal, fatigue and adrenal insufficiency AEs were the most commonly reported during the first 12 weeks of treatment (22). Current data for levoketoconazole, an oral steroidogenesis inhibitor that is a ketoconazole stereoisomer taken twice daily, are available for 12 months (median duration of exposure 15 months, n=60) following the extended open-label extension of the Phase III SONICS study (26). Of patients with data, 40.9% (n=18/44) had normal mUFC excretion at month 12 (26). During the extension, no patient experienced alanine aminotransferase or aspartate aminotransferase >3 x ULN, suggesting that the potentially clinically important events relating to liver toxicity may be more likely to occur early during treatment, although periodic monitoring during long-term treatment is advisable (26). Pasireotide is a second-generation somatostatin receptor ligand that is administered subcutaneously twice daily (2728) or intramuscularly once a month (2931). In a 12-­month extension of a Phase III study evaluating the long-term efficacy of long-acting pasireotide, 53.1% of patients had normalized mUFC at study completion (median treatment duration 23.9 months), with the most common AEs being related to hyperglycemia (21). The differences in duration and design of these studies prevent a meaningful comparison of the long-term efficacy of medical treatments for Cushing’s disease.

The extension period of LINC 4 was initially planned to run to week 96; however, in agreement with the FDA, a protocol amendment was approved that resulted in approximately half of the patients completing the extension phase between weeks 72 and 96. We also acknowledge the potential for selection bias for patients who experienced the greatest clinical benefit during the 48-week core study; however, over 80% of patients chose to continue osilodrostat treatment after consenting to take part in the extension.

Conclusions

During the LINC 4 extension period, osilodrostat provided long-term control of cortisol excretion, accompanied by sustained improvements in clinical symptoms, physical manifestations of hypercortisolism and QoL. The safety profile was favorable. These data provide further evidence of the durable clinical benefit of long-term osilodrostat treatment in patients with persistent, recurrent or de novo Cushing’s disease.

Data availability statement

The datasets generated and analyzed during the current study are not publicly available but are available from the corresponding author on reasonable request. Recordati Rare Diseases will share the complete de-identified patient dataset, study protocol, statistical analysis plan, and informed consent form upon request, effective immediately following publication, with no end date.

Ethics statement

The studies involving human participants were reviewed and approved by an independent ethics committee/institutional review board at each study site. The patients/participants provided their written informed consent to participate in this study.

Author contributions

The study steering committee (PS, AH, RF, and RA), AP, and the funder designed the study. AH, MG, MB, PW, ZB, AT, and PS enrolled patients in the study. Data were collected by investigators of the LINC 4 Study Group using the funder’s data management systems. MP and the funder’s statistical team analyzed the data. A data-sharing and kick-off meeting was held with all authors and an outline prepared by a professional medical writer based on interpretation provided by the authors. Each new draft of the manuscript subsequently prepared by the medical writer was reviewed and revised in line with direction and feedback from all authors. All authors contributed to the article and approved the submitted version.

Funding

This study was funded by Novartis Pharma AG; however, on July 12, 2019, osilodrostat became an asset of Recordati. Financial support for medical editorial assistance was provided by Recordati.

Acknowledgments

We thank all the investigators, nurses, study coordinators and patients who participated in the trial. We thank Catherine Risebro, PhD of Mudskipper Business Ltd for medical editorial assistance with this manuscript.

Conflict of interest

Author MG has received speaker fees from Recordati, Ipsen, Crinetics Pharmaceuticals, and Novo Nordisk and attended advisory boards for Novo Nordisk, Recordati, Ipsen, and Crinetics Pharmaceuticals. Author PS reports consultancy for Teva Pharmaceuticals. Author PW reports receiving travel grants and speaker fees from Novartis, Ipsen, Recordati, Novo Nordisk, Strongbridge Biopharma now Xeris Pharmaceuticals, and Lilly. Author MB reports receiving travel grants from Novartis, Ipsen, and Pfizer and consultancy for Novartis. Author ZB has nothing to disclose. Author AT reports consultancy for CinCor and PhaseBio. Author RF reports consultancy for HRA Pharma and Recordati and a research grant from Corcept Therapeutics. Author AH reports speaker fees from Chiasma and Ipsen and has been an advisor to Strongbridge Biopharma now Xeris Pharmaceuticals, Novo Nordisk, and Lundbeck Pharma. Author MP is employed by the company Novartis Pharma AG. Author AP was employed by the company Recordati AG at the time of manuscript development. Author RA reports grants and personal fees from Xeris Pharmaceuticals, Spruce Biosciences, Neurocrine Biosciences, Corcept Therapeutics, Diurnal Ltd, Sparrow Pharmaceuticals, and Novartis and personal fees from Adrenas Therapeutics, Janssen Pharmaceuticals, Quest Diagnostics, Crinetics Pharmaceuticals, PhaseBio Pharmaceuticals, H Lundbeck A/S, Novo Nordisk, and Recordati Rare Diseases.

Publisher’s note

All claims expressed in this article are solely those of the authors and do not necessarily represent those of their affiliated organizations, or those of the publisher, the editors and the reviewers. Any product that may be evaluated in this article, or claim that may be made by its manufacturer, is not guaranteed or endorsed by the publisher.

Supplementary material

The Supplementary Material for this article can be found online at: https://www.frontiersin.org/articles/10.3389/fendo.2023.1236465/full#supplementary-material

References

1. Lacroix A, Feelders RA, Stratakis CA, Nieman LK. Cushing’s syndrome. Lancet (2015) 386:913–27. doi: 10.1016/S0140-6736(14)61375-1

PubMed Abstract | CrossRef Full Text | Google Scholar

2. Feelders RA, Pulgar SJ, Kempel A, Pereira AM. The burden of Cushing’s disease: clinical and health-related quality of life aspects. Eur J Endocrinol (2012) 167:311–26. doi: 10.1530/eje-11-1095

PubMed Abstract | CrossRef Full Text | Google Scholar

3. Coelho MC, Santos CV, Vieira Neto L, Gadelha MR. Adverse effects of glucocorticoids: coagulopathy. Eur J Endocrinol (2015) 173:M11–21. doi: 10.1530/EJE-15-0198

PubMed Abstract | CrossRef Full Text | Google Scholar

4. Pivonello R, De Leo M, Cozzolino A, Colao A. The treatment of Cushing’s disease. Endocr Rev (2015) 36:385–486. doi: 10.1210/er.2013-1048

PubMed Abstract | CrossRef Full Text | Google Scholar

5. Tritos NA, Biller BMK. Current management of Cushing’s disease. J Intern Med (2019) 286:526–41. doi: 10.1111/joim.12975

PubMed Abstract | CrossRef Full Text | Google Scholar

6. Fleseriu M, Auchus R, Bancos I, Ben-Shlomo A, Bertherat J, Biermasz NR, et al. Consensus on diagnosis and management of Cushing’s disease: a guideline update. Lancet Diabetes Endocrinol (2021) 9:847–75. doi: 10.1016/S2213-8587(21)00235-7

PubMed Abstract | CrossRef Full Text | Google Scholar

7. Fleseriu M, Biller BMK, Bertherat J, Young J, Hatipoglu B, Arnaldi G, et al. Long-term efficacy and safety of osilodrostat in Cushing’s disease: final results from a Phase II study with an optional extension phase (LINC 2). Pituitary (2022) 25:959–70. doi: 10.1007/s11102-022-01280-6

PubMed Abstract | CrossRef Full Text | Google Scholar

8. Fleseriu M, Newell-Price J, Pivonello R, Shimatsu A, Auchus RJ, Scaroni C, et al. Long-term outcomes of osilodrostat in Cushing’s disease: LINC 3 study extension. Eur J Endocrinol (2022) 187:531–41. doi: 10.1530/EJE-22-0317

PubMed Abstract | CrossRef Full Text | Google Scholar

9. Recordati Rare Diseases. Isturisa (osilodrostat) tablets, for oral use, prescribing information (2020). Available at: https://www.isturisa.com/pdf/isturisa-prescribing-information.pdf. (Accessed February 2021).

Google Scholar

10. Recordati Rare Diseases. Isturisa® Japan prescribing information (2021). Available at: https://www.pmda.go.jp/PmdaSearch/iyakuDetail/GeneralList/24990A5/. (Accessed August 2021).

Google Scholar

11. Recordati Rare Diseases. Osilodrostat summary of product characteristics (2020). Available at: https://www.ema.europa.eu/en/documents/product-information/isturisa-epar-product-information_en.pdf. (Accessed February 2021).

Google Scholar

12. Swissmedic. Isturisa®, Filmtabletten (Osilodrostatum) (2020). Available at: https://www.swissmedic.ch/swissmedic/en/home/humanarzneimittel/authorisations/new-medicines/isturisa_filmtablette_osilodrostatum.html. (Accessed October 2021).

Google Scholar

13. Gadelha M, Bex M, Feelders RA, Heaney AP, Auchus RJ, Gilis-Januszewska A, et al. Randomized trial of osilodrostat for the treatment of Cushing’s disease. J Clin Endocrinol Metab (2022) 107:e2882–95. doi: 10.1210/clinem/dgac178

PubMed Abstract | CrossRef Full Text | Google Scholar

14. Pivonello R, Fleseriu M, Newell-Price J, Bertagna X, Findling J, Shimatsu A, et al. Efficacy and safety of osilodrostat in patients with Cushing’s disease (LINC 3): a multicentre Phase III study with a double-blind, randomised withdrawal phase. Lancet Diabetes Endocrinol (2020) 8:748–61. doi: 10.1016/S2213-8587(20)30240-0

PubMed Abstract | CrossRef Full Text | Google Scholar

15. Fleseriu M, Pivonello R, Elenkova A, Salvatori R, Auchus RJ, Feelders RA, et al. Efficacy and safety of levoketoconazole in the treatment of endogenous Cushing’s syndrome (SONICS): a Phase 3, multicentre, open-label, single-arm trial. Lancet Diabetes Endocrinol (2019) 7:855–65. doi: 10.1016/S2213-8587(19)30313-4

PubMed Abstract | CrossRef Full Text | Google Scholar

16. Ceccato F, Zilio M, Barbot M, Albiger N, Antonelli G, Plebani M, et al. Metyrapone treatment in Cushing’s syndrome: a real-life study. Endocrine (2018) 62:701–11. doi: 10.1007/s12020-018-1675-4

PubMed Abstract | CrossRef Full Text | Google Scholar

17. Newell-Price J, Pivonello R, Tabarin A, Fleseriu M, Witek P, Gadelha MR, et al. Use of late-night salivary cortisol to monitor response to medical treatment in Cushing’s disease. Eur J Endocrinol (2020) 182:207–17. doi: 10.1530/EJE-19-0695

PubMed Abstract | CrossRef Full Text | Google Scholar

18. Plat L, Leproult R, L’Hermite-Baleriaux M, Fery F, Mockel J, Polonsky KS, et al. Metabolic effects of short-term elevations of plasma cortisol are more pronounced in the evening than in the morning. J Clin Endocrinol Metab (1999) 84:3082–92. doi: 10.1210/jcem.84.9.5978

PubMed Abstract | CrossRef Full Text | Google Scholar

19. Fleseriu M, Auchus RJ, Snyder PJ, Lacroix A, Heaney AP, Geer EB, et al. Effect of dosing and titration of osilodrostat on efficacy and safety in patients with Cushing’s disease (CD): results from two Phase III trials (LINC3 and LINC4). Endocrine Practice (2021) 27(6 Suppl):S112 (abst 999926). doi: 10.1016/j.eprac.2021.04.707

CrossRef Full Text | Google Scholar

20. Castinetti F, Guignat L, Giraud P, Muller M, Kamenicky P, Drui D, et al. Ketoconazole in Cushing’s disease: is it worth a try? J Clin Endocrinol Metab (2014) 99:1623–30. doi: 10.1210/jc.2013-3628

PubMed Abstract | CrossRef Full Text | Google Scholar

21. Fleseriu M, Petersenn S, Biller BMK, Kadioglu P, De Block C, T’Sjoen G, et al. Long-term efficacy and safety of once-monthly pasireotide in Cushing’s disease: a Phase III extension study. Clin Endocrinol (Oxf) (2019) 91:776–85. doi: 10.1111/cen.14081

PubMed Abstract | CrossRef Full Text | Google Scholar

22. Nieman LK, Boscaro M, Scaroni CM, Deutschbein T, Mezosi E, Driessens N, et al. Metyrapone treatment in endogenous Cushing’s syndrome: results at week 12 from PROMPT, a prospective international multicenter, open-label, Phase III/IV study. J Endocr Soc (2021) 5(Suppl 1):A515. doi: 10.1210/jendso/bvab048.1053

CrossRef Full Text | Google Scholar

23. Nieman L, Boscaro M, Carla S, Deutschbein T, Mezosi E, Driessens N, et al. Metyrapone treatment in endogenous Cushing’s syndrome. Long term efficacy and safety results of the extension of the phase III/IV study PROMPT. Endocrine Abstracts (2021) 73:OC3. doi: 10.1530/endoabs.73.OC3.3

CrossRef Full Text | Google Scholar

24. Gadelha MR, Wildemberg LE, Shimon I. Pituitary acting drugs: cabergoline and pasireotide. Pituitary (2022) 25:722–5. doi: 10.1007/s11102-022-01238-8

PubMed Abstract | CrossRef Full Text | Google Scholar

25. HRA Pharma Rare Diseases. Metopirone® capsules 250 mg summary of product characteristics (1998). Available at: https://www.medicines.org.uk/emc/medicine/26460. (Accessed February 2021).

Google Scholar

26. Fleseriu M, Auchus RJ, Greenman Y, Zacharieva S, Geer EB, Salvatori R, et al. Levoketoconazole treatment in endogenous Cushing’s syndrome: extended evaluation of clinical, biochemical, and radiologic outcomes. Eur J Endocrinol (2022) 187:859–71. doi: 10.1530/EJE-22-0506

PubMed Abstract | CrossRef Full Text | Google Scholar

27. Recordati Rare Diseases. Signifor® (pasireotide) injection for subcutaneous use prescribing information (2012). Available at: https://signifor.com/wp-content/themes/signifor/dist/pdf/signifor-pi.pdf. (Accessed October 2021).

Google Scholar

28. Recordati Rare Diseases. Signifor summary of product characteristics (2012). Available at: https://www.medicines.org.uk/emc/product/4200/smpc. (Accessed October 2021).

Google Scholar

29. Recordati Rare Diseases. Signifor LAR summary of product characteristics (2012). Available at: https://www.medicines.org.uk/emc/product/1932/smpc. (Accessed October 2021).

Google Scholar

30. Recordati Rare Diseases. Signifor® LAR (pasireotide) for injectable suspension, for intramuscular use (2012). Available at: https://www.signiforlar.com/wp-content/themes/signifor-lar-theme/dist/pdf/signifor-lar-pi.pdf. (Accessed October 2021).

Google Scholar

31. Lacroix A, Gu F, Gallardo W, Pivonello R, Yu Y, Witek P, et al. Efficacy and safety of once-monthly pasireotide in Cushing’s disease: a 12 month clinical trial. Lancet Diabetes Endocrinol (2018) 6:17–26. doi: 10.1016/S2213-8587(17)30326-1

PubMed Abstract | CrossRef Full Text | Google Scholar

Keywords: Cushing’s disease, osilodrostat, hypercortisolism, 11β-hydroxylase, long-term treatment

Citation: Gadelha M, Snyder PJ, Witek P, Bex M, Belaya Z, Turcu AF, Feelders RA, Heaney AP, Paul M, Pedroncelli AM and Auchus RJ (2023) Long-term efficacy and safety of osilodrostat in patients with Cushing’s disease: results from the LINC 4 study extension. Front. Endocrinol. 14:1236465. doi: 10.3389/fendo.2023.1236465

Received: 07 June 2023; Accepted: 28 July 2023;
Published: 23 August 2023.

Edited by:

Fabienne Langlois, Centre Hospitalier Universitaire de Sherbrooke, Canada

Reviewed by:

Filippo Ceccato, University of Padua, Italy
Kevin Choong Ji Yuen, Barrow Neurological Institute (BNI), United States

Copyright © 2023 Gadelha, Snyder, Witek, Bex, Belaya, Turcu, Feelders, Heaney, Paul, Pedroncelli and Auchus. This is an open-access article distributed under the terms of the Creative Commons Attribution License (CC BY). The use, distribution or reproduction in other forums is permitted, provided the original author(s) and the copyright owner(s) are credited and that the original publication in this journal is cited, in accordance with accepted academic practice. No use, distribution or reproduction is permitted which does not comply with these terms.

*Correspondence: Mônica Gadelha, mgadelha@hucff.ufrj.br

Present address: Alberto M. Pedroncelli, Camurus AB, Lund, Sweden

Disclaimer: All claims expressed in this article are solely those of the authors and do not necessarily represent those of their affiliated organizations, or those of the publisher, the editors and the reviewers. Any product that may be evaluated in this article or claim that may be made by its manufacturer is not guaranteed or endorsed by the publisher.

From https://www.frontiersin.org/articles/10.3389/fendo.2023.1236465/full

Severe McCune–Albright Syndrome Presenting with Neonatal Cushing Syndrome: Navigating Through Clinical Obstacles

Background: Café-au-lait skin macules, Cushing syndrome (CS), hyperthyroidism, and liver and cardiac dysfunction are presenting features of neonatal McCune–Albright syndrome (MAS), CS being the rarest endocrine feature. Although spontaneous resolution of hypercortisolism has been reported, outcome is usually unfavorable. While a unified approach to diagnosis, treatment, and follow-up is lacking, herein successful treatment and long-term follow-up of a rare case is presented.

Clinical case: An 11-day-old girl born small for gestational age presented with deterioration of well-being and weight loss. Large hyperpigmented macules on the trunk, hypertension, hyponatremia, hyperglycemia, and elevated liver enzymes were noted. ACTH-independent CS due to MAS was diagnosed. Although metyrapone (300 mg/m2/day) was started on the 25th day, complete remission could not be achieved despite increasing the dose up to 1,850 mg/m2/day. At 9 months, right total and left three-quarters adrenalectomy was performed. Cortisol decreased substantially, ACTH remained suppressed, rapid tapering of hydrocortisone to physiological dose was not tolerated, and supraphysiological doses were required for 2 months. GNAS analysis from the adrenal tissue showed a pathogenic heterozygous mutation. During 34 months of follow-up, in addition to CS due to MAS, fibrous dysplasia, hypophosphatemic rickets, and peripheral precocious puberty were detected. She is still regularly screened for other endocrinopathies.

Conclusion: Neonatal CS due to MAS is extremely rare. Although there is no specific guideline for diagnosis, treatment, or follow-up, addressing side effects and identifying treatment outcomes will improve quality of life and survival.

Introduction

McCune–Albright syndrome (MAS) is a rare mosaic disorder of remarkable complexity with an estimated prevalence of 1/100,000 and 1/1,000,000 (1). Timing of postzygotic missense gain of function mutation of GNAS encoding stimulatory Gαs determines the extent of tissue involvement, imposing a unique clinical phenotype. Although a combination of two or more classical features, such as fibrous dysplasia of bone (FD), café-au-lait skin macules, and hyperfunctioning endocrinopathies (gonadotropin-independent gonadal function, nonautoimmune hyperthyroidism, growth hormone excess, and neonatal hypercortisolism), are diagnostic, renal, hepatobiliary, and cardiac involvement have also been reported (24).

Adrenocorticotropic hormone (ACTH)-independent adrenal Gαs activation results in the rarest endocrine feature of MAS, which almost invariably presents in the neonatal period: Cushing syndrome (CS). Due to greater burden of Gαs-mutation-bearing cells, the presence of CS is correlated with increased number of accompanying features of MAS and a poorer outcome. Although there is spontaneous resolution in 33% of cases with neonatal CS, mortality occurs with a high rate of 20% (4).

A dilemma for the clinician is that most publications to date have been case reports, and there is as yet no guideline for diagnosis, treatment, or follow-up. Here, a rare case of severe CS due to MAS, underlining the unique clinical phenotype specific to the neonatal period, is presented. Our goal is to offer a practical approach based on 3 years of clinical experience of this rare disorder that will help navigate challenges during follow-up.

Case presentation

A baby girl, born small for gestational age with a birthweight of 2,340 g (−2.1 SDS) and a head circumference of 32.6 cm (−1.61 SDS) was admitted to the neonatal intensive care unit in the first day of life for respiratory distress. She was the second child of a healthy non-consanguineous Caucasian couple, born 38 weeks of gestation via cesarean section following an uneventful pregnancy. Alanine aminotransferase [ALT, 2,376 U/L (normal, 0–40)] and aspartate aminotransferase [AST, 875 U/L (normal, 0–40)] were elevated; gamma-glutamyl transferase and bilirubin were normal. Antibiotics were administered intravenously after a diagnosis of possible neonatal sepsis. Respiratory distress resolved, and liver enzymes decreased (ALT, 687 U/L; AST, 108 U/L). As soon as the antimicrobial treatment was completed, she was discharged in the seventh day of life.

She was referred to our center, 4 days later, for failure to thrive (2,315 g), difficulty in feeding, and deterioration of general health. On physical examination, round facies, elongated philtrum and retro-micrognatia, hyperpigmented macules both at the front and back of the trunk and on labia majora, which do not cross midline, and hypertrichosis on the forehead and extremities were noted (Supplementary Figure S1). Newborn reflexes were hypoactive, blood pressure was 100/70 mmHg, and second-degree cardiac murmur was also detected. Systems were normal otherwise. Laboratory findings revealed hyponatremia, impaired renal and liver function tests, tubulopathy, and proteinuria, while blood count was normal (hemoglobin, 10.4 g/dl; leukocyte, 25.0 × 10³/μl; platelet count, 449×103/μl) (Table 1). Hyponatremia resolved with fluid treatment, while liver enzymes, blood urea nitrogen, and creatinine remained elevated. Further endocrine evaluation revealed an elevated serum basal cortisol [225.68 g/dl (N, 6.7–22.6 µg/dL)] and 24-h urinary free cortisol [1,129 μg/day (N, 1.4–20 μg/day)]. Serum cortisol was not suppressed during overnight high-dose dexamethasone suppression test (Table 2) (5). Thyroid hormones were consistent with non-thyroidal illness.

Table 1
www.frontiersin.orgTable 1 Laboratory investigations on admission, prior to medical treatment (19 days), after medical treatment (6 months), and post-adrenalectomy.

Table 2
www.frontiersin.orgTable 2 Endocrine evaluation prior to medical treatment (19 days), after medical treatment (6 months), and post-adrenalectomy.

ACTH-independent CS and café-au-lait spots suggested MAS. Hypercortisolism-related complications emerged. On the 11th day, hyperglycemia (blood glucose, 250 mg/dl) was seen, and it persisted after cessation of intravenous fluids in the exclusively breastfed neonate; thus, 0.5 U subcutaneous neutral protamine Hagedorn insulin (NPH) (three times a day) was initiated on the 16th day of life when blood glucose was 340 mg/dl, and serum insulin was 18.10 μIU/ml. Hypertension (110/90 mmHg) and hypokalemia were triggered by mineralocorticoid action of excessive cortisol on 20th day. Spironolactone (2 mg/kg/day) was started, and nifedipine (0.5 mg/kg/day) was added in order to control blood pressure (Supplementary Figure S2). Since immunosuppressive effects of excess cortisol may increase the risk for opportunistic infections, Pneumocystis jirovecii prophylaxis was started and live vaccines were postponed.

Features of MAS and accompanying hyperfunctioning endocrinopathies were screened (Table 2). On ultrasonography, adrenal glands were hypertrophic; kidneys showed increased parenchymal echogenicity, loss of separation between the cortex and medulla, and enhanced medullary echogenicity; and size and echogenicity of the liver were normal. Magnetic resonance imaging of the abdomen confirmed that adrenal glands were hypertrophic (right and left adrenal gland were 24×22×18 mm and 18×19×20 mm in size, respectively) and lobulated. Echocardiogram revealed left ventricular hypertrophy. Bone survey verified generalized decrease in bone mass and revealed areas of irregular ossification and radiolucency in radius, ulna, and distal tibia, which were interpreted as osteoporosis due to hypercortisolism (Supplementary Figure S1).

Medical treatment

Metyrapone (300 mg/m2/day, per oral, in four doses) was started on the 25th day (Supplementary Figure S2) (6). Since liver function tests were impaired, metyrapone was preferred over ketoconazole. Soon after metyrapone was started, hyperglycemia and hypertension improved, enabling the discontinuation of insulin and nifedipine. Spironolactone was also gradually tapered and discontinued after 13 days of metyrapone treatment, and she was discharged.

The dose of metyrapone was adjusted frequently, according to clinical findings and serum cortisol levels during regular visits. However, even after gradually increasing metyrapone dose to 1,850 mg/m2/day over the course of 6 months, total biochemical suppression of serum cortisol could not be achieved (Supplementary Figure S3A), and the patient had progressive loss of bone mineral density, persistent left ventricular hypertrophy, and a lack of catch-up growth. In addition to that, café-au-lait macules became darker, dehydroepiandrosterone sulfate (DHEA-S) gradually increased (Table 2), and previously non-existent marked clitoromegaly was noted as a side effect of high-dose metyrapone. She was also prescribed ursodeoxycholic acid (15 mg/kg/day); however, liver enzymes remained high (Table 1).

Right total and left three-quarters adrenalectomy

Right total and left three-quarters adrenalectomy was carried out at 9 months of age in light of the patient’s continued clinical findings of hypercortisolism, the existence of unfavorable prognostic markers (high cortisol levels upon admission and heart and liver problems), and the adverse effects of high-dose metyrapone. The patient was administered 100 mg/m2/day glucocorticoids (GC) perioperatively; however, she developed symptoms of adrenal insufficiency. The required GC dose to attain euglycemia, restore general well-being, and resolve adrenal insufficiency was 300 mg/m2/day. Fludrocortisone (0.05 mg/day) was also started. Following surgery, supraphysiological doses of GC were required, as she suffered frequent symptoms of adrenal insufficiency (hypoglycemia, malaise, and loss of appetite). GC dose could be tapered very slowly, and a daily dose of 15 mg/m2/day could be attained in 2 months.

As liver function tests, serum cortisol levels and left ventricular hypertrophy all improved following adrenalectomy (Table 1). Bilateral nodular adrenal hyperplasia was observed in the pathological evaluation of surgical specimen, while the findings of liver wedge biopsy were non-specific (Supplementary Figure S4). Sequence analysis of GNAS from the surgical sample of adrenal gland revealed a heterozygous, previously described missense mutation in exon 8 (c.2530C>A, p.Arg844Ser), while the sequence analysis of the GNAS gene from peripheral blood sample was normal. Lymphocyte activation was normal 3 months post-adrenalectomy, and immunization schedule for live vaccines was established.

Other findings of MAS

She had breast development and vaginal bleeding that lasted 2 days when she was 7 months old, which repeated five more times after the adrenalectomy till 26 months of age. Breast development was Tanner stage 3, and bone age was markedly advanced (4 years and 2 months), despite severe hypercortisolism. On pelvic ultrasonography, uterus was enlarged to 34×22×24 mm; thus, letrozole (0.625 mg, per oral) was started at 26 months of age.

She also developed marked hypophosphatemia at the age of 6 months (Table 1). Radiological investigations since birth demonstrated severe osteopenia and lytic lesions, which were attributed to severe hypercortisolism; however, overt lesions of FD were not confirmed. When she was 9 months old, FGF-23 was elevated [122 pg/ml (normal <52)], which suggested hypophosphatemic rickets associated with FD. Oral phosphate (8 mg/kg) and calcitriol (18 ng/kg) were started. At the age of 23 months, bone survey revealed sclerosis of the base of the skull and maxilla and FD in the lower extremities. She has been on oral phosphate (58.7 mg/kg/day), while calcitriol was ceased.

She is now 34 months old with severe short stature [height, 81 cm (−3.5 SDS); weight, 9,580 g (−3.7SDS)] (Supplementary Figure S3B). She had been under regular clinic visits and has been on 15 mg/m2/day hydrocortisone and fludrocortisone 0.025 mg/day, letrozole (1×6.25 mg/day), phosphate (58 mg/kg), and ursodeoxycholic acid (100 mg/day) (Supplementary Figure S2). She has six words, cannot form two-word sentences, shows body parts, cannot stand up from supine position without support, and takes a few steps with support. Despite regular physiotherapy and ergotherapy, developmental delay is evident (Bayley Scales of Infant and Toddler Development III language scale, 13/79; motor scale, 2/46).

Discussion

ACTH-independent CS and café-au-lait macules suggested MAS in this case. Interestingly, this patient was admitted for hyponatremia and hyperglycemia requiring insulin treatment. Neonatal MAS and CS are rare conditions, and presentation of this case is quite unique (4).

The earlier the timing of somatic mutation, the greater the burden of Gsα-mutation-bearing cells leading to widespread tissue involvement in MAS. In the current case, adrenal, hepatic, cardiac, renal, and bone tissue involvement were evident in first weeks of life, while precocious puberty and hypophosphatemic rickets were observed later. A lifetime risk of additional tissue involvement is being acknowledged. CS is the rarest endocrine manifestation of MAS, which appears in <5%–7.1%. It presents exclusively within the first year of life (median age, 3.1 months) where features may develop as early as in utero (247). The fact that our case was SGA and had moon facies and hirsutism with impaired linear growth, weight gain, hyperglycemia, hypertension, and nephrocalcinosis detected in the neonatal period, suggested severe, in utero onset CS. Upon suspicion, both comorbidities (hyperthyroidism, excess growth hormone, FD, and cardiac and hepatobiliary function) of MAS and complications of GC excess (hypertension, hyperglycemia, hyperlipidemia, nephrocalcinosis, decreased bone mineral density, and muscle atrophy) were assessed (13).

Since the initial description of MAS, only 20 neonates with CS have been described with various initial basal serum cortisol ranging from 9.6 to 80.1 µg/dl, and data regarding long-term follow-up and outcome are still developing (12811). Disease course is heterogenous, and spontaneous resolution of hypercortisolism has been reported (30%) since Gs-bearing cells are mostly located in the fetal adrenal zone, which normally undergoes apoptosis after birth. However, the outcome is mostly unfavorable in cases with extensive endocrine and extra-endocrine manifestations (12815). Brown et al. reported poorer prognosis and a lower likelihood of spontaneous remission of adrenal disease in patients with cardiac (cardiomyopathy) and liver involvement (hepatocellular adenomas, inflammatory adenomas, choledochal cysts, neonatal cholestasis, and hepatoblastoma). It was hypothesized that these patients have a greater burden of Gsα mutation (34).

Treatment of neonatal CS is a long and challenging path where both cortisol excess and its complications should be targeted. Marked hypercortisolism that precipitate neonatal diabetes requiring insulin treatment like our patient is rare and was previously reported only in six patients with CS (4). Until hypercortisolism is managed, hyperglycemia should be treated with insulin. Hypertension is due to mineralocorticoid effect of excess cortisol; thus, blood pressure lowering agents of choice should be aldosterone antagonists (spironolactone) or potassium-sparing diuretics.

The treatment strategy of hypercortisolism is determined by disease severity. In a mildly affected case, medical treatment with an expectation of spontaneous resolution (due to previously stated apoptosis of fetal adrenal zone) may be of choice (341619). Metyrapone, ketoconazole, and mitotane are medical options for lowering cortisol (2023). Since our patient had impaired liver function, metyrapone, a potent, rapid acting relatively selective inhibitor of 11-hydroxylase was preferred over ketoconazole for its low risk of hepatotoxicity. Reports reviewing adult data suggest an initial dose of 500–750 mg/day and achievement of biochemical control with 1,500 mg/day (23). However, the initial and maximum dose of metyrapone in neonates is unclear; some authors recommend 300 mg/m2/day in four equal doses (6). In our case, adequate biochemical and clinical suppression of cortisol with metyrapone was not achieved despite an increase in dose from 300 to 1,850 mg/m2/day.

There are important issues to be considered while using a steroidogenesis inhibitor like metyrapone. Monitoring biochemical response is essential, not only for dose titration and management of cortisol excess but also for adrenal insufficiency due to possible overtreatment. Clinical signs of adrenal insufficiency should always be questioned and assessed. The 24-h urinary free cortisol is the commonly used method; however, it may be impractical due to difficulties in the collection of urine in infants. Alternative methods may be the measurement of early morning serum cortisol and ACTH (23). Low ACTH level may indicate hypercortisolism or may be a sign of suppression due to long-term exposure to hypercortisolism. However, there are deadlocks to be considered in the evaluation of these measurements. A high cortisol level measured by immunoassays does not always indicate an actual elevation. It should be kept in mind that cortisol immunoassays exhibit significant cross-reactivity with cortisol precursors that may be elevated in patients treated with a steroidogenesis inhibitor (especially with metyrapone, which is known to increase 11-deoxycortisol). Such cross-reactivity can be a cause for overestimation of cortisol and may lead to risk of overtreatment (2425). It has been suggested that the patients on metyrapone should be biochemically monitored via specific methods, such as mass spectrometry (2426).

Metyrapone is a relatively selective inhibitor of 11-hydroxylase and 18-hydroxylase. Recent in vitro studies indicate greater inhibitory action of metyrapone on aldosterone synthase, resulting in significant reversible reduction in both cortisol and aldosterone. The loss of negative feedback leads to an increase in ACTH, which causes an accumulation of cortisol and aldosterone precursors resulting in an increase in adrenal androgens (23). Although we could not serologically prove an increase in ACTH, hyperpigmentation and the increase in adrenal androgens confirm this mechanism. As far as we know, an increase in DHEA-S causing virilization was an unreported side effect of metyrapone. Clinical (clitoromegaly and hirsutism) and laboratory (DHEA-S) signs of hyperandrogenism should be monitored when higher doses of metyrapone are required.

In the severely affected case with CS, where medical treatment is inadequate and the chance of spontaneous resolution is subsiding, adrenalectomy is indicated when medically feasible. Brown et al. suggested that the presence of comorbid cardiac and liver disease like in our case should prompt consideration for early adrenalectomy (4). Although a previous correlation with initial serum cortisol level and prognosis was not established, it may be speculated that excessively high serum cortisol level is associated with increased number of Gsα-mutation-bearing adrenal cells. Thus, we suggest that in neonatal CS due to MAS, initial very high serum cortisol levels, like our case, may be a negative prognostic factor both for spontaneous resolution and clinical response to medical treatment. In infants with severe CS, bilateral adrenalectomy is generally performed. Alternatives like unilateral adrenalectomy and one-side total, other-side three-quarters adrenalectomy may be considered to avoid the requirement for lifelong GC and mineralocorticoid replacement. Unilateral adrenalectomy was reported to successfully improve clinical symptoms and endocrinological status in adult studies; nevertheless, recurrence during follow-up was 23.1%, while 17.5% required contralateral adrenalectomy (2729). Since the causes of CS in adult series are variable and different from pediatric CS due to MAS, it should be borne in mind that reproducibility of adult data is poor. In CS due to MAS, Gsα-mutation-bearing adrenal gland cells are heterogeneously distributed, and partial adrenalectomy may carry the risk of inadequate management and recurrence. Only a few pediatric case reports addressed this issue. Unilateral adrenalectomy of the larger gland was performed in two neonates with CS due to MAS; remission was achieved for 2 years (3031). Itonaga et al. reported a 6-month-old neonate with MAS-associated CS treated with right-sided total adrenalectomy and left-sided half adrenalectomy with remission for 2 years (32). Although these cases were less severe [basal serum cortisol: 16.9, 18.5, and 23.4 µg/dl, respectively (N: 6.2–18.0 µg/dL)], we preferred to perform partial adrenalectomy (right total and left three-quarters adrenalectomy) and succeeded. Our patient has been in remission for more than 2 years.

In the largest case–control analysis of CS in patients with MAS, overall mortality was 20% (six cases) where four of them were deceased following bilateral adrenalectomy (66.7% of all deaths) (4). Anaphylaxis (or adrenal insufficiency), sudden cardiac arrest, sepsis, and sudden death were listed as causes of mortality in those four cases where GC dose and process of GC tapering were not clearly described. The fact that our patient required high-dose GC during peri- and postoperative period to restore well-being, tapering to maintenance dose was very slow, and she is still on maintenance dose GC, suggests that rapid tapering of GCs should be avoided and, although being speculative, may explain sudden death following adrenalectomy.

Gross motor developmental delay may be caused by prenatal exposure to excess GCs. Prenatal GC treatment for possible congenital adrenal hyperplasia or risk of premature birth have been shown to result in cognitive deficits after birth. Furthermore, children who develop CS later in life may experience a decline in cognitive and school performance where the younger the age of onset, the greater the deterioration in IQ scores (343334). Since transgenic mice with Gsα mutation was shown to have short- and long-term memory deficits and impaired associative and spatial learning, it may also be speculated that Gsα mutation may also be present in the central nervous system (3536).

The establishment of diagnosis of FD follows a characteristic and predictable time course. Although GNAS mutations are acquired early in embryogenesis, skeletal development appears to be relatively normal in utero, without frank clinical signs of FD at birth. Boyce et al. affirmed that FD lesions become apparent over the first several years of life and expand during childhood and adolescence, like our case. Previous case reports have also stated severe osteoporosis, rickets, polyostotic irregular lucencies, pathological fractures, and biopsy-proven FD during infancy (12815). The exact pathophysiological mechanism is unclear, and Gsα activation in abnormally differentiated osteocytes is accused. FGF-23 overproduction is an inherent feature of FD, and most patients have elevated circulating levels of FGF-23, but frank hypophosphatemia is rare. The increase in FGF-23 is linked to substantial skeletal involvement. Although FGF-23 levels may wax and wane over time, an increase in FGF-23 usually occurs during periods of rapid growth like infancy and adolescence. Concurrent hyperfunctioning endocrinopathies like hyperthyroidism or CS may also adversely affect bone health.

Peripheral precocious puberty (PP) is the most frequent presenting feature in female patients with MAS (85%) (6). To date, a safe, effective, and long-term treatment for PP in girls with MAS has not been established. The benefits of current interventions on the ultimate outcome of interest, adult height, have not been well-established due to the rarity of the condition and heterogeneous nature of the disease. Despite the small sample size, studies have concluded that letrozole resulted in a statistically significant decrease in the bone age/chronological age ratio, growth velocity, hence increasing predicted adult height (37). Growth outcome in MAS is not only dependent on timing of pubertal onset but on several other disease components (skeletal involvement and endocrinopathies) as well. Hyperthyroidism and growth hormone excess may accelerate growth, while CS may decelerate it (3738).

Lack of consensus on both medical and surgical treatment strategies were major obstacles while navigating this case of severe neonatal MAS. The eminence of this report is that it presents current literature with clinical experience on this rare case of neonatal CS due to MAS. High index of suspicion for MAS in a neonate with extensive café-au-lait macules and symptoms of hypercortisolism is the key for early recognition and intervention. Initial excessive cortisol in neonatal CS may be a negative prognostic factor for spontaneous resolution and response to medical treatment, indicating early right total and left three-quarters adrenalectomy. Post-adrenalectomy survival may be related to close supervision during GC tapering.

Data availability statement

The datasets presented in this study can be found in online repositories. The names of the repository/repositories and accession number(s) can be found in the article/Supplementary Material.

Ethics statement

Written informed consent was obtained from the individual(s), and minor(s)’ legal guardian/next of kin, for the publication of any potentially identifiable images or data included in this article.

Author contributions

YU collected and analyzed data, drafted the initial manuscript, and reviewed and revised the manuscript. OG collected data. İU, HH, BG, SE, and TK collected data and reviewed and revised the manuscript. ZO and EG analyzed data, conceptualized the work, and revised and critically reviewed the manuscript for important intellectual and medical content. All authors approved the final manuscript as submitted and agree to be accountable for all aspects of the work.

Acknowledgments

We thank our patient’s family for providing consent for publication of this work.

Conflict of interest

The authors declare that the research was conducted in the absence of any commercial or financial relationships that could be construed as a potential conflict of interest.

Publisher’s note

All claims expressed in this article are solely those of the authors and do not necessarily represent those of their affiliated organizations, or those of the publisher, the editors and the reviewers. Any product that may be evaluated in this article, or claim that may be made by its manufacturer, is not guaranteed or endorsed by the publisher.

Supplementary material

The Supplementary Material for this article can be found online at: https://www.frontiersin.org/articles/10.3389/fendo.2023.1209189/full#supplementary-material

Supplementary Figure 1 | (A) The findings of physical and radiologic examination. Notice cushingoid facies, hyperpigmented macules that does not cross the midline at the front of the trunk. (B) Anteroposterior radiographs reveal irregularities in radius, ulna and femur. Although generalized osteopenia improves at 34 months, FD lesions become prominent over months.

Supplementary Figure 2 | Timeline of the course of symptoms in neonatal McCune Albright Syndrome noting adjustments made in treatment. Grey box denotes age in days for the first month of life then in months. NPH: Neutral Protamine Hagedorn insulin, CS: Cushing syndrome, PP: precocious puberty.

Supplementary Figure 3 | (A) Change in serum cortisol with increased metyrapone (methyrapone was initiated on day 25). (B) Growth chart, the arrow represents right total and left three quarters adrenalectomy.

Supplementary Figure 4 | Representative histological features of nodular adrenal hyperplasia. (A, B) show low-power while (C) Show high-power views.

References

1. Lourenço R, Dias P, Gouveia R, Sousa AB, Oliveira G. Neonatal McCune-Albright syndrome with systemic involvement: a case report. J Med Case Rep (2015) 9:189. doi: 10.1186/s13256-015-0689-2

PubMed Abstract | CrossRef Full Text | Google Scholar

2. Corsi A, Cherman N, Donaldson DL, Robey PG, Collins MT, Riminucci M. Neonatal McCune-Albright syndrome: A unique syndromic profile with an unfavorable outcome. JBMR Plus (2019) 3:e10134. doi: 10.1002/jbm4.10134

PubMed Abstract | CrossRef Full Text | Google Scholar

3. Boyce AM, Collins MT. Fibrous dysplasia/McCune-Albright syndrome: A rare, mosaic disease of Gα s activation. Endocr Rev (2020) 41(2):345–70. doi: 10.1210/endrev/bnz011

PubMed Abstract | CrossRef Full Text | Google Scholar

4. Brown RJ, Kelly MH, Collins MT. Cushing syndrome in the McCune-Albright syndrome. J Clin Endocrinol Metab (2010) 95(4):1508–15. doi: 10.1210/jc.2009-2321

PubMed Abstract | CrossRef Full Text | Google Scholar

5. Boyce AM, Florenzano P, de Castro LF, Collins MT. Fibrous Dysplasia/McCune-Albright Syndrome. Adam MP, Ardinger HH, Pagon RA, et al, editors. Seattle (WA): University of Washington, Seattle (2015).

Google Scholar

6. Dias R, Storr HL, Perry LA, Isidori AM, Grossman AB, Savage MO. The discriminatory value of the low-dose dexamethasone suppression test in the investigation of paediatric Cushing’s syndrome. Horm Res (2006) 65(3):159–62. doi: 10.1159/000091830

PubMed Abstract | CrossRef Full Text | Google Scholar

7. Carney JA, Young WF, Stratakis CA. Primary bimorphic adrenocortical disease: cause of hypercortisolism in McCune-Albright syn- drome. Am J Surg Pathol (2011) 35:1311–26. doi: 10.1097/PAS.0b013e31821ec4ce

PubMed Abstract | CrossRef Full Text | Google Scholar

8. Shenker A, Weinstein LS, Moran A, Pescovitz OH, Charest NJ, Boney CM, et al. Severe endocrine and nonendocrine manifestations of the McCune-Albright syndrome associated with activating mutations of stimulatory G protein GS. J Pediatr (1993) 123:509–18. doi: 10.1016/S0022-3476(05)80943-6

PubMed Abstract | CrossRef Full Text | Google Scholar

9. Danon M, Robboy SJ, Kim S, Scully R, Crawford JD. Cushing syndrome, sexual precocity, and polyostotic fibrous dysplasia (Albright syndrome) in infancy. J Pediatr (1975) 87:917–21. doi: 10.1016/S0022-3476(75)80905-X

PubMed Abstract | CrossRef Full Text | Google Scholar

10. Yoshimoto M, Nakayama M, Baba T, Uehara Y, Niikawa N, Ito M, et al. A case of neonatal McCune-Albright syndrome with Cushing syndrome and hyperthyroidism. Acta Paediatr Scand (1991) 80:984–7. doi: 10.1111/j.1651-2227.1991.tb11769.x

PubMed Abstract | CrossRef Full Text | Google Scholar

11. Kirk JM, Brain CE, Carson DJ, Hyde JC, Grant DB. Cushing’s syndrome caused by nodular adrenal hyperplasia in children with McCune- Albright syndrome. J Pediatr (1999) 134:789–92. doi: 10.1016/S0022-3476(99)70302-1

PubMed Abstract | CrossRef Full Text | Google Scholar

12. Lodish MB, Keil MF, Stratakis CA. Cushing’s syndrome in pediatrics: an update. Endocrinol Metab Clin North Am (2018) 47(2):451–62. doi: 10.1016/j.ecl.2018.02.008

PubMed Abstract | CrossRef Full Text | Google Scholar

13. Post EM, Consenstein L, Hitch D, Oliphant M, Dracker R, Richman RA. Congenital Cushing syndrome with polyostotic fibrous dysplasia (PFD). Pediatr Res (1983) 17:169A.

Google Scholar

14. Silva ES, Lumbroso S, Medina M, Gillerot Y, Sultan C, Sokal EM. Demonstration of McCune-Albright mutations in the liver of children with high gamma GT progressive cholestasis. J Hepatol (2000) 32:154–8. doi: 10.1016/S0168-8278(00)80202-0

PubMed Abstract | CrossRef Full Text | Google Scholar

15. Angelousi A, Fencl F, Faucz FR, Malikova J, Sumnik Z, Lebl J, et al. McCune Albright syndrome and bilateral adrenal hyperplasia: the GNAS mutation may only be present in adrenal tissue. Hormones (Athens) (2015) 14:447–50. doi: 10.14310/horm.2002.1578

PubMed Abstract | CrossRef Full Text | Google Scholar

16. Collins MT, Singer FR, Eugster E. McCune-Albright syndrome and the extraskeletal manifestations of fibrous dysplasia. Orphanet J Rare Dis (2012) 7. doi: 10.1186/1750-1172-7-S1-S4

CrossRef Full Text | Google Scholar

17. Stratakis CA. Diagnosis and clinical genetics of Cushing syndrome in pediatrics. Endocrinol Metab Clin North Am (2016) 45(2):311–28. doi: 10.1016/j.ecl.2016.01.006

PubMed Abstract | CrossRef Full Text | Google Scholar

18. Bocian-Sobkowska J, Malendowicz LK, WoŸniak W. Comparative stereological study on zonation and cellular composition of adrenal glands of normal and anencephalic human fetuses. I. Zonation of the gland. Histol Histopathol (1997) 12:311–7.

PubMed Abstract | Google Scholar

19. Breault L, Chamoux E, Lehoux JG, Gallo-Payet N. Localization of G protein α-subunits in the human fetal adrenal gland. Endocrinology (2000) 141(12):4334–41. doi: 10.1210/endo.141.12.7834

PubMed Abstract | CrossRef Full Text | Google Scholar

20. Lake-Bakaar GSP, Sherlock S. Hepatic reactions associated with ketoconazole in the United Kingdom. BMJ (1987) 294:419–22. doi: 10.1136/bmj.294.6569.419

PubMed Abstract | CrossRef Full Text | Google Scholar

21. Heiberg JK, Svejgaard E. Toxic hepatitis during ketoconazole treatment. BMJ (1981) 283:825–6. doi: 10.1136/bmj.283.6295.825

PubMed Abstract | CrossRef Full Text | Google Scholar

22. Newell-Price J. Ketoconazole as an adrenal steroidogenesis inhibitor: Effectiveness and risks in the treatment of Cushing’s disease. J Clin Endocrinol Metab (2014) 99:1586–8. doi: 10.1210/jc.2014-1622

PubMed Abstract | CrossRef Full Text | Google Scholar

23. Daniel E, Newell-Price JD. Therapy of endocrine disease: steroidogenesis enzyme inhibitors in Cushing’s syndrome. Eur J Endocrinol (2015) 172(6):R263–80. doi: 10.1530/EJE-14-1014

PubMed Abstract | CrossRef Full Text | Google Scholar

24. Owen LJ, Halsall DJ, Keevil BG. Cortisol measurement in patients receiving metyrapone therapy. Ann Clin Biochem (2010) 47:573–5. doi: 10.1258/acb.2010.010167

PubMed Abstract | CrossRef Full Text | Google Scholar

25. Monaghan PJ, Owen LJ, Trainer PJ, Brabant G, Keevil BG, Darby D. Comparison of serum cortisol measurement by immunoassay and liquid chromatography-tandem mass spectrometry in patients receiving the 11β-hydroxylase inhibitor metyrapone. Ann Clin Biochem (2011) 48:441–6. doi: 10.1258/acb.2011.011014

PubMed Abstract | CrossRef Full Text | Google Scholar

26. Monaghan PJ, Keevil BG Trainer PJ. The use of mass spectrometry to improve the diagnosis and the management of the HPA axis. Rev Endocrine Metab Disord (2013) 14:143–57. doi: 10.1007/s11154-013-9240-1

CrossRef Full Text | Google Scholar

27. Li J, Yang CH. Diagnosis and treatment of adrenocorticotrophic hormone-independent macronodular adrenocortical hyperplasia: a report of 23 cases in a single center. Exp Ther Med (2015) 9:507–12. doi: 10.3892/etm.2014.2115

PubMed Abstract | CrossRef Full Text | Google Scholar

28. Debillon E, Velayoudom-Cephise FL, Salenave S, Caron P, Chaffanjon P, Wagner T, et al. Unilateral adrenalectomy as a first-line treatment of Cushing’s syndrome in patients with primary bilateral macronodular adrenal hyperplasia. J Clin En- docrinol Metab (2015) 100:4417–24. doi: 10.1210/jc.2015-2662

CrossRef Full Text | Google Scholar

29. Albiger NM, Ceccato F, Zilio M, Barbot M, Occhi G, Rizzati S, et al. An analysis of different therapeutic options in patientswith Cushing’s syndrome due to bilateral macronodular adrenal hyperplasia: a single-centre experience. Clin Endocrinol (Oxf) (2015) 82:808–15. doi: 10.1111/cen.12763

PubMed Abstract | CrossRef Full Text | Google Scholar

30. Hamajima T, Maruwaka K, Homma K, Matsuo K, Fujieda K, Hasegawa T. Unilateral adrenalectomy can be an alternative therapy for infantile onset Cushing’ s syndrome caused by ACTH-independent macronodular adrenal hyperplasia with McCune-Albright syndrome. Endocr J (2010) 57(9):819–24. doi: 10.1507/endocrj.K10E-003

PubMed Abstract | CrossRef Full Text | Google Scholar

31. Paris F, Philibert P, Lumbroso S, Servant N, Kalfa N, Sultan C. Isolated Cushing’s syndrome: an unusual presentation of McCune-Albright syndrome in the neonatal period. Horm Res (2009) 72(5):315–9. doi: 10.1159/000245934

PubMed Abstract | CrossRef Full Text | Google Scholar

32. Itonaga T, Goto H, Toujigamori M, Ohno Y, Korematsu S, Izumi T, et al. Three-quarters adrenalectomy for infantile-onset cushing syndrome due to bilateral adrenal hyperplasia in McCune-Albright syndrome. Horm Res Paediatr (2017) 88(3-4):285–90. doi: 10.1159/000473878

PubMed Abstract | CrossRef Full Text | Google Scholar

33. Merke DP, Giedd JN, Keil MF, Mehlinger SL, Wiggs EA, Holzer S, et al. Children experience cognitive decline despite reversal of brain atrophy one year after resolution of Cushing syndrome. J Clin Endocrinol Metab (2005) 90(5):2531–6. doi: 10.1210/jc.2004-2488

PubMed Abstract | CrossRef Full Text | Google Scholar

34. Keil MF, Merke DP, Gandhi R, Wiggs EA, Obunse K, Stratakis CA. Quality of life in children and adolescents 1-year after cure of Cushing syndrome: a prospective study. Clin Endocrinol (Oxf) (2009) 71(3):326–33. doi: 10.1111/j.1365-2265.2008.03515.x

PubMed Abstract | CrossRef Full Text | Google Scholar

35. Bourtchouladze R, Patterson SL, Kelly MP, Kreibich A, Kandel ER, Abel T. Chronically increased Gsα signaling disrupts associative and spatial learning. Learn Mem (2006) 13:745–52. doi: 10.1101/lm.354106

PubMed Abstract | CrossRef Full Text | Google Scholar

36. Kelly MP, Cheung YF, Favilla C, Siegel SJ, Kanes SJ, Houslay MD, et al. Constitutive activation of the G-protein subunit Gαs within forebrain neurons causes PKA-dependent alterations in fear conditioning and cortical Arc mRNA expression. Learn Mem (2008) 15:75–83. doi: 10.1101/lm.723708

PubMed Abstract | CrossRef Full Text | Google Scholar

37. Feuillan P, Calis K, Hill S, Shawker T, Robey PG, Collins MT. Letrozole treatment of precocious puberty in girls with the McCune-Albright syndrome: a pilot study. J Clin Endocrinol Metab (2007) 92(6):2100–6. doi: 10.1210/jc.2006-2350

PubMed Abstract | CrossRef Full Text | Google Scholar

38. Wang X, Yu Q. Management of precocious puberty in girls with McCune-Albright syndrome using letrozole. Endocr Connect. (2018) 7(12):1424–31. doi: 10.1530/EC-18-0344

PubMed Abstract | CrossRef Full Text | Google Scholar

Keywords: McCune Albright syndrome, neonatal Cushing syndrome, metyrapone, adrenalectomy, follow-up

Citation: Unsal Y, Gozmen O, User İR, Hızarcıoglu H, Gulhan B, Ekinci S, Karagoz T, Ozon ZA and Gonc EN (2023) Case Report: Severe McCune–Albright syndrome presenting with neonatal Cushing syndrome: navigating through clinical obstacles. Front. Endocrinol. 14:1209189. doi: 10.3389/fendo.2023.1209189

Received: 20 April 2023; Accepted: 04 July 2023;
Published: 25 July 2023.

Edited by:

Martin Oswald Savage, Queen Mary University of London, United Kingdom

Reviewed by:

Li Chan, Queen Mary University of London, United Kingdom
Sasha R Howard, Queen Mary University of London, United Kingdom
Tomoyo Itonaga, Oita University, Japan

Copyright © 2023 Unsal, Gozmen, User, Hızarcıoglu, Gulhan, Ekinci, Karagoz, Ozon and Gonc. This is an open-access article distributed under the terms of the Creative Commons Attribution License (CC BY). The use, distribution or reproduction in other forums is permitted, provided the original author(s) and the copyright owner(s) are credited and that the original publication in this journal is cited, in accordance with accepted academic practice. No use, distribution or reproduction is permitted which does not comply with these terms.

*Correspondence: Yagmur Unsal, yagmurunsal@yahoo.com

Disclaimer: All claims expressed in this article are solely those of the authors and do not necessarily represent those of their affiliated organizations, or those of the publisher, the editors and the reviewers. Any product that may be evaluated in this article or claim that may be made by its manufacturer is not guaranteed or endorsed by the publisher.

From https://www.frontiersin.org/articles/10.3389/fendo.2023.1209189/full

Ketogenic Diet Initially Masks Symptoms of Hypercortisolism in Cushing’s Disease

Abstract

Cushing’s syndrome (CS) is a diagnosis used to describe multiple causes of serum hypercortisolism. Cushing’s disease (CD), the most common endogenous subtype of CS, is characterized by hypercortisolism due to a pituitary tumor secreting adrenocorticotropic hormone (ACTH). A variety of tests are used to diagnose and differentiate between CD and CS. Hypercortisolism has been found to cause many metabolic abnormalities including hypertension, hyperlipidemia, impaired glucose tolerance, and central adiposity. Literature shows that many of the symptoms of hypercortisolism can improve with a low carb (LC) diet, which consists of consuming <30 g of total carbohydrates per day. Here, we describe the case of a patient with CD who presented with obesity, hypertension, striae and bruising, who initially improved some of his symptoms by implementing a LC diet. Ultimately, as his symptoms persisted, a diagnosis of CD was made. It is imperative that practitioners realize that diseases typically associated with poor lifestyle choices, like obesity and hypertension, can often have alternative causes. The goal of this case report is to provide insight on the efficacy of nutrition, specifically a LC diet, on reducing metabolic derangements associated with CD. Additionally, we will discuss the importance of maintaining a high index of suspicion for CD, especially in those with resistant hypertension, obesity and pre-diabetes/diabetes.

1. Introduction

Cushing’s syndrome (CS) is a rare disorder of hypercortisolism related to exposure to high levels of cortisol (>20 mcg/dL between 0600–0800 or >10 mcg/dL after 1600) for an extended period [1,2]. CS affects 10 to 15 people per million and is more common among those with diabetes, hypertension, and obesity [3]. The metabolic derangements associated with CS include visceral obesity, elevated blood pressure, dyslipidemia, type II diabetes mellitus (T2DM) and insulin resistance [4]. CS physical exam findings include round face, dorsal fat pad, central obesity, abdominal striae, acne, and ecchymosis [3]. Other symptoms associated with CS include low libido, headache, change in menses, depression and lethargy [2,3,5]. The most common features of CS are weight gain, which is found in 82% of cases, and hypertension, which is found in 50–85% of cases [6]. CS can be caused by exogenous glucocorticoids, known as iatrogenic CS, ectopic ACTH secretion (EAS) from sources like a small cell lung cancer or adrenal adenoma, known as EAS CS, or excess production of ACTH from a pituitary tumor, known as CD [3]. In CD, ACTH subsequently causes increased production of cortisol from the adrenal glands. CD accounts for 80–85% of endogenous cases of CS [3]. Other conditions including alcoholism, depression, severe obesity, bulimia and anorexia nervosa can lead to a Cushing-like state, although are not considered true CS [3]. Many studies have demonstrated that LC diets can ameliorate some of the most common metabolic derangements seen in CD, namely hyperglycemia, weight gain, hypertension and insulin resistance.
A LC diet is a general term for diets which lower the total carbohydrates consumed per day [4]. A ketogenic diet is a subtype of LC that is described as having even fewer carbohydrates, typically less than 30 g/day. By reducing carbohydrate intake and thus limiting insulin production, the body achieves ketosis by producing an elevated number of ketones including β-hydroxybutyric acid, acetoacetic acid, and acetone, in the blood [7]. A carnivore diet, a specific type of a ketogenic diet, is defined as mainly eating animal food such as meat, poultry, eggs and fish. Contrarily, a standard American diet (SAD) is defined as a diet high in processed foods, carbs, added sugars, refined fats, and highly processed dairy products [8]. There are several therapeutic applications for LC diets that are currently supported by strong evidence. These include weight loss, cardiovascular disease, T2DM, and epilepsy. LC diets have clinical utility for acne, cancer, polycystic ovary syndrome (PCOS), and neurologic deficits [9].
In this case report, the patient endorsed initially starting a LC diet to address weight gain and high blood sugars that he noted on a glucometer. The patient noted a 35 pounds (lbs.) weight loss over the first 1.5 years on his LC diet, as well as improved blood pressure and in his overall health. He then adopted a carnivore diet but found that weight loss was difficult to maintain, although his body composition continued to improveand his clothes fit better. Later, he noted that his blood pressure would at times be poorly controlled despite multiple medications and strict dietary adherence. The patient reported “being in despair” and “not trusting his doctors” because they did not understand how much his diet had helped him. Despite strict adherence, his symptoms of insulin resistance and hypertension persisted. In this report, we will describe how his symptoms of CD were ameliorated by the ketogenic diet. This case report also highlights that when patients are unable to overcome hormonal pathology, clinicians should not blame patients for lack of adherence to a diet, but instead understand the need to evaluate for complex pathology.

2. Detailed Case Description

A male patient in his thirties, of Asian descent, had a past medical history of easy bruising, central obesity, headaches, hematuria, and hypertension and past family medical history of hypertension in his father and brother. In 2015, he was at his heaviest weight of 179 lbs. with a body mass index (BMI) of 28 kg/m2, placing him in the overweight category (25.0–29.9 kg/m2). At that time the patient reported he was following a SAD diet and was active throughout the day. The patient stated he ate a diet of vegetables, fruits and carbohydrates, but he was not able to lose weight. The patient stated that he switched to a LC diet, to address weight gain and hyperglycemia, and he reported that he lost approximately 35 lbs. in 1.5 years. The patient described his LC diet as eating green leafy vegetables, low carb fruits, fish, poultry, beef and dairy products. The patient then later switched to a carnivore diet. He noted despite aggressively adhering to his diet, that his weight-loss had plateaued, although his waist circumference continued to decrease. The patient noted his carnivore diet consisted of eating a variety of different meats, poultry, fish and eggs.
The metabolic markers seen in Table 1 were obtained after the patient had started a carnivore diet. The patient’s blood glucose levels decreased overtime despite impaired glucose metabolism being a known side effect of hypercortisolism [4]. The patient’s high-density lipoprotein (HDL) remained in a healthy range (40–59 mg/dL) and his triglycerides stayed in an optimal range (<100 mg/dL), despite dyslipidemia being a complication of CD [4]. When the patient was consuming a SAD diet, he was not under the care of a physician and was unable to provide us with previous biomarkers.
Table 1. Patient’s metabolic markers on a carnivore diet. Glucose (70 to 99 mg/dL), total cholesterol (desirable <200 mg/dL, borderline high 200–239 mg/dL, high >239 mg/dL), triglycerides (optimal: <100 mg/dL), HDL (low male: <40 mg/dL), low density lipoprotein (LDL) (Optimal: <100 mg/dL).
Table
Despite strict adherence to his diet and initial improvement in his weight, his blood pressure and his blood sugar levels, in October of 2021 the patient was admitted to the hospital for hypertensive urgency, with a blood pressure of 216/155. His complaints at the time were unexplained ecchymosis, hematuria and significant headaches that were resistant to Excedrin (acetaminophen-aspirin-caffeine) use. At the hospital, the patient underwent a computed tomography (CT) scan of the head and radiograph of the chest, and both images were negative for acute pathology. During his hospital admission, the patient denied any changes in vision, chest pain or edema of the legs. Ultimately, the patient was told to eat a low-salt diet and to follow-up with a cardiologist. At discharge, the patient was placed on hydrochlorothiazide, labetalol, amlodipine and lisinopril. The patient was then seen by his primary care physician in November of 2021 and his urinalysis at that time showed 30 mg/mL (Negative/Trace) of protein in his urine, without hematuria. The patient’s primary care physician discontinued his hydrochlorothiazide and started the patient on furosemide. Additionally, the primary care physician reinforced cutting out salt and limiting his calories to prevent any further weight gain, which his physician explained would contribute further to his hypertension. He was referred to hematology and oncology in November of 2021 for his symptoms of hematuria and abnormal ecchymosis to his abdomen, thighs and arms. The patient’s coagulation and platelet counts were normal, and his symptoms were noted to be improving. His hematuria and ecchymosis were attributed to his significant Excedrin use from the past 1–2 months, secondary to his headaches, and their anti-platelet effect. It was noted that the patient had significant hemolysis during his hospital admission. However, in his follow up examination, there were no signs of hemolysis, and it was attributed to his hypertensive urgency. Again, a low-salt, calorie-limited diet was recommended. The patient was referred to cardiology where he was evaluated for secondary hypertension, because despite his weight loss and his strict adherence to his diet, his blood pressure was still uncontrolled on multiple medications. He had a normal echocardiogram and renal ultrasound which showed no signs of renal artery stenosis bilaterally. At that time the patient’s serum renin, aldosterone and urine metanephrine levels were all normal. His cardiologist increased his lisinopril, and continued him on amlodipine, furosemide and labetalol and reinforced the recommendations of lowering his salt and preventing weight gain.
The patient first contacted our office in January of 2022. At that time his blood pressure was noted to be 160/120 despite being compliant with current blood pressure medications. The patient reported strict adherence to his carnivore diet by sharing his well-documented meals on his social media accounts. Given the persistent symptoms, despite his significant change in diet and weight loss, we were concerned that a hormonal etiology may be driving his symptoms. The patient was seen in-person, in our office, in March of 2022. At the request of the patient, we again reviewed his social media profile to assess his meal choices and diet. While the patient was eager to show us his carnivore meals, what we incidentally noted in his photos was despite weight loss and strict diet adherence, he had developed moon facies (Figure 1a,b). On the physical exam, we noted his prominent abdominal striae (Figure 2). Several screening tests for Cushing’s syndrome were ordered. A midnight salivary cortisol was ordered, with values of 0.884 ug/dL (<0.122 ug/dL) and 0.986 ug/dL (<0.122 ug/dL) and a urinary free cortisol excretion (UFC) was ordered, with values of 8.8 ug/L (5–64 ug/L). At this point our suspicion was confirmed that the patient had inappropriately elevated cortisol.
Metabolites 12 01033 g001 550
Figure 1. The patient’s progression of moon facies, (a) photo from 2019 after initial weight loss (b) photo from office visit in 2022.
Metabolites 12 01033 g002 550
Figure 2. The arrows demonstrate early striae visualized on the lower abdomen bilaterally, unclear in image due to poor office lighting.
Based on screening tests and significant physical exam findings, we referred the patient to endocrinology for a low dose dexamethasone suppression test (DST). They performed a low dose DST revealing a dehydroepiandrosterone (DHEA) of 678 ug/dL (89–427 ug/dL) and ACTH of 23.9 pg/mL (7.2–63.3 pg/mL). The low dose DST and midnight salivary cortisol were both positive indicating hypercortisolism. To begin determining the source of hypercortisolism, the plasma ACTH was evaluated and was 27.2 pg/mL (7.2–63.3 pg/mL). While ACTH was within normal range, a plasma ACTH > 20 pg/mL is suggestive of ACTH-dependent CS, so a magnetic resonance imaging (MRI) of the brain was ordered [2]. The MRI revealed a 4 mm heterogeneous lesion in the central pituitary gland which is suspicious of a cystic microadenoma. To confirm that a pituitary tumor was the cause of the patient’s increased cortisol, the patient was sent for inferior petrosal sinus sampling (IPSS). The results of the IPSS indicated an increase in ACTH in both inferior petrosal sinuses and peripheral after corticotropin-releasing hormone (CRH) stimulation (Figure 3a–c), which was consistent with hypercortisolism.
Metabolites 12 01033 g003a 550Metabolites 12 01033 g003b 550
Figure 3. (a) Right IPS venous sampling values for ACTH and prolactin after CRH stimulation over multiple time intervals. (b) Left IPS venous sampling values for ACTH and prolactin after CRH stimulation over multiple time intervals. (c) Peripheral sampling values for ACTH and prolactin after CRH stimulation over multiple time intervals.
Lab results from the patient’s IPSS venous sampling can be seen above. The graphs depict the lab values of ACTH (7.2–63.3 pg/mL) and prolactin (PRL) (2.1–17.7 ng/mL) before and after CRH stimulation during IPSS. PRL acts as a baseline to indicate successful catheterization in the procedure [10].
Using the ACTH levels from our patient’s IPSS we calculated a ratio of inferior petrosal sinus to peripheral (IPS:P). These results can be seen below (Table 2). The right IPS:P was calculated as 3.60 at 10 min and the left IPS:P as 7.65 at 10 min. These ratios confirmed that the hypercortisolism was due to the pituitary tumor, as it is higher than the 3:1 ratio necessary for diagnosis of CD [11]. The patient is currently scheduled to undergo surgical resection of the pituitary microadenoma.
Table 2. Right and left petrosal sinus to peripheral serum ACTH ratios.
Table

3. Clinical Evaluation for CS

In this case, the patient presented with uncontrolled hypertension, weight gain despite a strict diet, hyperglycemia, abdominal striae and moon facies. Despite evaluation, both inpatient and outpatient, a diagnosis of CS was not yet explored. When CS is suspected based on clinical findings, the use of exogenous steroids must first be excluded as it is the most common cause of hypercortisolism [3]. If there is still concern for CS, there are three screening tests that can be done which are sensitive but not specific for hypercortisolism. The screening tests include: a 24-h UFC, 2 late night salivary cortisol tests, low dose (1 g) DST [3]. To establish the preliminary diagnosis of hypercortisolism two screening tests must be abnormal [2].
The first step to determine the cause of hypercortisolism is to measure the plasma level of ACTH. Low values of ACTH < 5 pg/mL indicate the cause is likely ACTH-independent CS and imaging of the adrenal glands is warranted as there is a high suspicion of an adrenal adenoma [2,3]. When the serum ACTH is elevated >/20 pg/mL it is likely an ACTH-dependent form of CS [2]. To further evaluate an ACTH-dependent hypercortisolism, an MRI should be obtained as there is high suspicion that the elevated cortisol is coming from a pituitary adenoma. If there is a pituitary mass >6 mm there is a strong indication for the diagnosis of CD [2]. However, pituitary tumors can be quite small and can be missed on MRIs in 20–58% of patients with CD [2]. If there is still a high suspicion of CD with an inconclusive MRI, a high dose DST (8 g) is done. Patients with CD should not respond and their ACTH and DHEA, a steroid precursor, should remain high. Similarly, CRH stimulation test is done and patients with CD should have an increase in ACTH and/or cortisol within 45 min of CRH being given. If the patient has a positive high-dose DST, CRH-stimulation test and an MRI with a pituitary tumor >6 mm no further testing is needed as it is likely the patient has CD [2]. If either of those tests are abnormal, the MRI shows a pituitary tumor < 6 mm, or there is diagnostic ambiguity, the patient should undergo IPSS with ACTH measurements before and after the administration of CRH [4]. IPSS is the gold standard for determining the source of ACTH secretion and confirming CD. In this invasive procedure, ACTH, prolactin, and cortisol levels are sampled prior to CRH stimulation and after CRH stimulation. PRL acts as a baseline to indicate successful catheterization in the procedure [12]. To confirm CD, a ratio of IPS:P is calculated for values prior to and after CRH stimulation. A peak ratio greater than 2.0 before CRH stimulation or a peak ratio greater than 3.0 after CRH stimulation is indicative of CD. In comparing the right and left petrosal sinus sample, an IPS:P ratio greater than 1.4 suggests adenoma lateralization. However, due to high variability, IPSS should not be used for diagnosing lateralization [13].

4. Discussion

Surgical intervention remains the primary treatment for CD [4]. However, remission is not guaranteed as symptoms and metabolic diseases have been shown to persist afterwards. In the literature it has been shown that nutrition can have a powerful impact on suppressing, or even reversing metabolic disorders and comorbidities associated with CD. A LC diet has been shown to promote significant weight loss, reduce hypertension, improve dyslipidemia, reverse T2DM and improve cortisol levels (2, 14–15, 18–21).
There are reports of weight loss on a LC diet in the literature. A LC significantly reduced weight and BMI of 30 male subjects [14]. In a group of 120 participants over 24 weeks who followed a LC versus low fat (LF) diet, showed a greater weight loss in the LC group vs. the LF group [15]. Patients diagnosed and treated for CD found that their weight remained largely unchanged even after treatment [6]. In many cases, surgical treatment does not always resolve the associated comorbidity of central adiposity in CD. In such cases, a LC diet can be used before, during and after treatment, as an adjunct, to decrease associated weight gain and comorbidities.
Nutritional intervention can be a powerful adjunct to reduce comorbidities associated with CD. As seen in this case report, the patient’s symptoms of CD, especially hypertension and weight gain, improved with dietary changes despite him having a pituitary microadenoma. Multiple studies showed that a LC diet was able to decrease blood pressure parameters. In a group of 120 participants over 24 weeks who followed a LC versus a LF diet showed a greater decrease in both systolic and diastolic blood pressure in the LC group vs. the LF group [15]. Other literature which studied the effect of a LC diet on hypertension demonstrated the reduction of blood pressure and is thought to be due to ketogenesis. It is thought the production of ketones have a natriuretic effect on the body therefore lowering systemic blood pressure [16].
A LC diet improves lipid profiles and inflammatory markers associated with metabolic syndrome [14]. Literature shows that a LC diet has a greater impact on decreasing triglyceride levels and increasing HDL levels, when compared to a LF diet [15]. Triglyceride levels in patients in CD remission remained high [17]. Therefore, it can be hypothesized that a LC diet would be beneficial, in addition to standard CD treatment, to lower the associated comorbidity of hypertriglyceridemia and metabolic syndrome.
Insulin resistance, a precursor to T2DM, is a common comorbidity of hypercortisolism which can be treated with a LC diet. One study showed that in subjects with T2DM, a decrease in A1c and a reduction in antidiabetic therapy were seen with consumption of a LC diet [18]. Additionally, a cohort of 9 participants following a LC diet were able to collectively lower their A1c on average by 1% while concurrently discontinuing various antidiabetic therapies including insulin [19].
Literature shows that a LC diet can minimize systemic cortisol levels through various mechanisms. Current treatment of CD includes medications which block cortisol production and/or cortisol secretion [2]. LC can imitate similar results seen through medication intervention for CD. Carbohydrate restriction can lower cortisol levels, as carbohydrates stimulate adrenal cortisol secretion and extra-adrenal cortisol regeneration [4]. A ketogenic diet can lower the level of ghrelin, a peptide produced in the stomach that has orexigenic properties [20,21]. Literature shows that ghrelin increases levels of serum cortisol [22]. Therefore, implementing a ketogenic diet would decrease ghrelin, and subsequently minimize the effects of increased ghrelin on serum cortisol. A LC diet decreases visceral fat which itself is an endocrine organ and can increase the synthesis of cortisol [14]. Therefore, decreasing visceral fat also decreases the production of cortisol. A LC was shown to significantly reduced weight, BMI and cortisol levels of 30 obese male subjects [14]. Further, a LC diet excludes foods with a high glycemic index which cause increased stress on the body which subsequently leads to the activation of the hypothalamic-pituitary-axis which causes increased levels of cortisol [14].
This case report illustrated how a LC diet was initially successful at ameliorating the patient’s associated symptoms of hypertension and obesity, making his diagnosis of CD go undetected. Literature shows that while the prevalence of CS on average is a fraction of a percent, it is much higher among patients with poorly controlled diabetes, hypertension and early onset osteoporosis [3]. Two hundred patients with diabetes mellitus were studied and 5.5% were found to have CS [23]. Another study discovered that in subjects with CD, 36.4% were found to have hyperlipidemia, 73.1% with hypertension, and 70.2% with impaired glucose metabolism [17]. It can be concluded that a higher index of suspicion and lower threshold for screening for CS may be necessary in obese and diabetic patient populations. A lower threshold for screening can allow for earlier diagnosis for many patients, and therefore provide better outcomes for those diagnosed with CS.
It is important for clinicians to consider alternative pathology for patients combating metabolic derangements. As depicted in this case, the patient lost 35 lbs. while on a LC diet, despite having hypercortisolism, presumably for months to years prior to the diagnosis of his condition. The patient noted a tendency to gain weight, have elevated blood sugar and blood pressure which prompted him to begin self-treatment with increasingly strict carbohydrate restriction. The patient was able to keep his symptoms of hypercortisolism managed, potentially making the diagnosis difficult for his team of clinicians. From a diagnostic perspective, it’s important to understand that strict dietary adherence can have profound impacts on even the most severe hormonal pathology. Ultimately, this case serves as a reminder of the power of nutrition to address metabolic derangements and simultaneously as a reminder to diagnosticians to never rely on lack of dietary adherence as a reason for persistent metabolic symptoms. The reflexive advice to “not gain weight” and “lower salt intake” in retrospect appears both dogmatic and careless. In this case, the patient had seen several doctors and was even hospitalized and yet his disease state remained unclear and the dietary messaging cursory.

5. Conclusions

Many chronic diseases, including diabetes, hypertension and obesity, are generally thought to be caused by dietary and lifestyle choices. However, as exemplified in this report underlying medical problems, such as endocrine disorders, can be the cause of such metabolic derangements. It is critical that practitioners consider other causes of metabolic derangements, as assuming that they are due to poor dietary adherence, can allow them to go undiagnosed. While there is extensive literature on LC diets and their effect on the metabolic derangements associated with hypercortisolism, there needs to be further research on LC as an adjunctive therapy to conventional CD treatment. Ultimately, nutrition can have a powerful impact on suppressing, or even reversing metabolic disorders. As depicted in this case study, a LC diet is powerful enough to temporarily suppress symptoms of CD.

Author Contributions

M.K.D., E.-C.P.-M. and T.K. equally contributed to this case report. All authors have read and agreed to the published version of the manuscript.

Funding

This research received no external funding.

Institutional Review Board Statement

Not applicable.

Informed Consent Statement

Written informed consent has been obtained from the patient to publish this paper.

Data Availability Statement

The data presented in this study are available in article.

Acknowledgments

We would like to thank our patients and the Society of Metabolic Health Practitioners.

Conflicts of Interest

T.K. is an unpaid member of the Board of Directors of the Society of Metabolic Health Practitioners and a producer of podcasts on health and nutrition, with all proceeds donated to humanitarian charities; his spouse has ownership interest in a food company. The other author reports no conflicts of interest.

References

  1. Nieman, L.K. UpToDate. Available online: https://www.uptodate.com/contents/measurement-of-cortisol-in-serum-and-saliva?search=cortisol%20level&source=search_result&selectedTitle=1~150&usage_type=default&display_rank=1 (accessed on 27 September 2022).
  2. Feelders, R.; Sharma, S.; Nieman, L. Cushing’s Syndrome: Epidemiology and Developments in Disease Management. Clin. Epidemiol. 2015, 7, 281. [Google Scholar] [CrossRef] [PubMed]
  3. Guaraldi, F.; Salvatori, R. Cushing Syndrome: Maybe Not so Uncommon of an Endocrine Disease. J. Am. Board Fam. Med. 2012, 25, 199–208. [Google Scholar] [CrossRef] [PubMed]
  4. Guarnotta, V.; Emanuele, F.; Amodei, R.; Giordano, C. Very Low-Calorie Ketogenic Diet: A Potential Application in the Treatment of Hypercortisolism Comorbidities. Nutrients 2022, 14, 2388. [Google Scholar] [CrossRef] [PubMed]
  5. Nieman, L.K. UpToDate. Available online: https://www.uptodate.com/contents/epidemiology-and-clinical-manifestations-of-cushings-syndrome?search=cushings%20diagnosis%20symptoms&source=search_result&selectedTitle=2~150&usage_type=default&display_rank=2 (accessed on 27 September 2022).
  6. Schernthaner-Reiter, M.H.; Siess, C.; Gessl, A.; Scheuba, C.; Wolfsberger, S.; Riss, P.; Knosp, E.; Luger, A.; Vila, G. Factors Predicting Long-Term Comorbidities in Patients with Cushing’s Syndrome in Remission. Endocrine 2018, 64, 157–168. [Google Scholar] [CrossRef] [PubMed]
  7. Giordano, C.; MarchiÃ2, M.; Timofeeva, E.; Biagini, G. Neuroactive Peptides as Putative Mediators of Antiepileptic Ketogenic Diets. Front. Neurol. 2014, 5, 63. [Google Scholar] [CrossRef]
  8. Standard American Diet (SAD). Available online: https://piviohealth.com/knowledge-bank/glossary/standard-american-diet-sad/ (accessed on 2 October 2022).
  9. Paoli, A.; Rubini, A.; Volek, J.S.; Grimaldi, K.A. Beyond Weight Loss: A Review of the Therapeutic Uses of Very-Low-Carbohydrate (Ketogenic) Diets. Eur. J. Clin. Nutr. 2013, 67, 789–796. [Google Scholar] [CrossRef] [PubMed]
  10. Sharma, S.T.; Nieman, L.K. Is Prolactin Measurement of Value during Inferior Petrosal Sinus Sampling in Patients with ACTH-Dependent Cushing’s Syndrome? J. Endocrinol. Investig. 2013, 36, 1112–1116. [Google Scholar] [CrossRef]
  11. Kline, G.; Chin, A.C. Chapter 5—Adrenal disorders. In Endocrine Biomarkers: Clinical Aspects and Laboratory Determination; Elsevier: Amsterdam, The Netherlands, 2017; Available online: https://www.sciencedirect.com/science/article/pii/B9780128034125000057 (accessed on 18 October 2022).
  12. Ghorbani, M.; Akbari, H.; Griessenauer, C.J.; Wipplinger, C.; Dastmalchi, A.; Malek, M.; Heydari, I.; Mollahoseini, R.; Khamseh, M.E. Lateralization of Inferior Petrosal Sinus Sampling in Cushing’s Disease Correlates with Cavernous Sinus Venous Drainage Patterns, but Not Tumor Lateralization. Heliyon 2020, 6, e05299. [Google Scholar] [CrossRef]
  13. Knecht, L. Inferior Petrosal Sinus Sampling in the Diagnosis of Cushing’s Disease. Available online: https://csrf.net/doctors-articles/inferior-petrosal-sinus-sampling-diagnosis-cushings-disease/ (accessed on 18 October 2022).
  14. Polito, R.; Messina, G.; Valenzano, A.; Scarinci, A.; Villano, I.; Monda, M.; Cibelli, G.; Porro, C.; Pisanelli, D.; Monda, V.; et al. The Role of Very Low Calorie Ketogenic Diet in Sympathetic Activation through Cortisol Secretion in Male Obese Population. J. Clin. Med. 2021, 10, 4230. [Google Scholar] [CrossRef] [PubMed]
  15. Yancy, W.S.; Olsen, M.K.; Guyton, J.R.; Bakst, R.P.; Westman, E.C. A Low-Carbohydrate, Ketogenic Diet versus a Low-Fat Diet to Treat Obesity and Hyperlipidemia. Ann. Intern. Med. 2004, 140, 769. [Google Scholar] [CrossRef] [PubMed]
  16. Khan, S.S.; Ning, H.; Wilkins, J.T.; Allen, N.; Carnethon, M.; Berry, J.D.; Sweis, R.N.; Lloyd-Jones, D.M. Association of Body Mass Index with Lifetime Risk of Cardiovascular Disease and Compression of Morbidity. JAMA Cardiol. 2018, 3, 280–287. [Google Scholar] [CrossRef]
  17. Sun, X.; Feng, M.; Lu, L.; Zhao, Z.; Bao, X.; Deng, K.; Yao, Y.; Zhu, H.; Wang, R. Lipid Abnormalities in Patients with Cushing’s Disease and Its Relationship with Impaired Glucose Metabolism. Front. Endocrinol. 2021, 11, 600323. [Google Scholar] [CrossRef] [PubMed]
  18. Bolla, A.; Caretto, A.; Laurenzi, A.; Scavini, M.; Piemonti, L. Low-Carb and Ketogenic Diets in Type 1 and Type 2 Diabetes. Nutrients 2019, 11, 962. [Google Scholar] [CrossRef] [PubMed]
  19. Norwitz, N.G.; Soto-Mota, A.; Kalayjian, T. A Company Is Only as Healthy as Its Workers: A 6-Month Metabolic Health Management Pilot Program Improves Employee Health and Contributes to Cost Savings. Metabolites 2022, 12, 848. [Google Scholar] [CrossRef] [PubMed]
  20. Ebbeling, C.B.; Feldman, H.A.; Klein, G.L.; Wong, J.M.W.; Bielak, L.; Steltz, S.K.; Luoto, P.K.; Wolfe, R.R.; Wong, W.W.; Ludwig, D.S. Effects of a Low Carbohydrate Diet on Energy Expenditure during Weight Loss Maintenance: Randomized Trial. BMJ 2018, 363, k4583. [Google Scholar] [CrossRef] [PubMed]
  21. Marchiò, M.; Roli, L.; Lucchi, C.; Costa, A.M.; Borghi, M.; Iughetti, L.; Trenti, T.; Guerra, A.; Biagini, G. Ghrelin Plasma Levels after 1 Year of Ketogenic Diet in Children with Refractory Epilepsy. Front. Nutr. 2019, 6, 112. [Google Scholar] [CrossRef] [PubMed]
  22. Kärkkäinen, O.; Farokhnia, M.; Klåvus, A.; Auriola, S.; Lehtonen, M.; Deschaine, S.L.; Piacentino, D.; Abshire, K.M.; Jackson, S.N.; Leggio, L. Effect of Intravenous Ghrelin Administration, Combined with Alcohol, on Circulating Metabolome in Heavy Drinking Individuals with Alcohol Use Disorder. Alcohol. Clin. Exp. Res. 2021, 45, 2207–2216. [Google Scholar] [CrossRef] [PubMed]
  23. Catargi, B.; Rigalleau, V.; Poussin, A.; Ronci-Chaix, N.; Bex, V.; Vergnot, V.; Gin, H.; Roger, P.; Tabarin, A. Occult Cushing’s Syndrome in Type-2 Diabetes. Available online: https://academic.oup.com/jcem/article/88/12/5808/2661485 (accessed on 27 September 2022).
Publisher’s Note: MDPI stays neutral with regard to jurisdictional claims in published maps and institutional affiliations.

Characterization of Adrenal miRNA-Based Dysregulations in Cushing’s Syndrome

Abstract

MiRNAs are important epigenetic players with tissue- and disease-specific effects. In this study, our aim was to investigate the putative differential expression of miRNAs in adrenal tissues from different forms of Cushing’s syndrome (CS). For this, miRNA-based next-generation sequencing was performed in adrenal tissues taken from patients with ACTH-independent cortisol-producing adrenocortical adenomas (CPA), from patients with ACTH-dependent pituitary Cushing’s disease (CD) after bilateral adrenalectomy, and from control subjects. A confirmatory QPCR was also performed in adrenals from patients with other CS subtypes, such as primary bilateral macronodular hyperplasia and ectopic CS. Sequencing revealed significant differences in the miRNA profiles of CD and CPA. QPCR revealed the upregulated expression of miR-1247-5p in CPA and PBMAH (log2 fold change > 2.5, p < 0.05). MiR-379-5p was found to be upregulated in PBMAH and CD (log2 fold change > 1.8, p < 0.05). Analyses of miR-1247-5p and miR-379-5p expression in the adrenals of mice which had been exposed to short-term ACTH stimulation showed no influence on the adrenal miRNA expression profiles. For miRNA-specific target prediction, RNA-seq data from the adrenals of CPA, PBMAH, and control samples were analyzed with different bioinformatic platforms. The analyses revealed that both miR-1247-5p and miR-379-5p target specific genes in the WNT signaling pathway. In conclusion, this study identified distinct adrenal miRNAs as being associated with CS subtypes.

1. Introduction

Cushing’s syndrome (CS) results from the excessive secretion of cortisol, leading to visceral obesity, resistance to insulin, osteoporosis, and altered lipid and glucose metabolism [1,2]. Excessive production of cortisol by the adrenal glands can be either ACTH-dependent or -independent. In the majority of patients, hypercortisolism is due to ACTH secretion by corticotroph adenomas of the pituitary gland (Cushing’s disease, CD) or by ectopic tumors [3]. Approximately 20% of cases are ACTH-independent, where cortisol is secreted autonomously by the adrenal cortex. The pathology of ACTH-independent cases is diverse; they are most often caused by unilateral cortisol-producing adrenocortical adenomas (CPA). Rare causes are cortisol-secreting adrenocortical carcinomas (ACC), primary bilateral macronodular adrenocortical hyperplasia (PBMAH), bilateral CPAs, and primary pigmented nodular adrenal disease (PPNAD) [4,5]. Irrespective of the subtype, prolonged exposure to cortisol in CS is associated with increased mortality and cardiovascular morbidity in its patients [6]. Treatment is based on the underlying cause of hypercortisolism, with pituitary surgery or adrenalectomy being the preferred choice. Medical therapy options in CS are few and consist of pituitary-directed drugs, steroid synthesis inhibitors, and glucocorticoid receptor antagonists [7]. For the timely diagnosis and targeted management of CS and its subtypes, a comprehensive understanding of cortisol secretion, in terms of canonical signaling pathways as well as upstream epigenetic factors, is needed.
MiRNA molecules have emerged as key epigenetic players in the transcriptional regulation of cortisol production. Briefly, the deletion of Dicer in adrenals, a key miRNA processing enzyme, revealed diverse expression changes in miRNAs along with related changes in steroidogenic enzymes such as Cyp11b1 [8]. Furthermore, key enzymes in the cortisol biosynthesis pathway, namely Cyp11a1, Cyp21a1, Cyp17a1, Cyp11b1, and Cyp11b2, were also found to be regulated by various miRNAs (miRNA-24, miRNA-125a-5p, miRNA-125b-5p, and miRNA-320a-3p) in in vitro studies [9]. Consequently, various studies have also characterized miRNA expression profiles in CS subtypes. Importantly, miRNA expression in the corticotropinomas of CD patients was found to vary according to USP8 mutation status [10]. Other studies have also identified specific miRNA candidates and associated target genes in the adrenals of patients with PPNAD [11], PBMAH [12,13], and massive macronodular adrenocortical disease [14]. Interestingly, no common miRNA candidates were found among these studies, indicating the specificity of miRNAs to the different underlying pathologies in CS.
There are limited studies directly comparing miRNA expression profiles of ACTH-dependent and ACTH-independent CS patients. Consequently, in our previous study, we found differences in expression profiles when comparing circulating miRNAs in CD and CPA patients [15]. We hypothesized that the presence of ACTH possibly influences the miRNA profile in serum due to the upstream differential expression in the origin tissues. In this study, we aim to further explore this hypothesis by comparing the miRNA expression profile of adrenal tissues in ACTH-dependent and ACTH-independent CS. In brief, miRNA specific sequencing was performed in two prevalent subtypes of CS: in CD, the most prevalent ACTH-dependent form; and in CPA, the most prevalent ACTH-independent form. Specific miRNA candidates related to each subtype were further validated in other forms of CS. To further investigate our hypothesis, the response of miRNA candidates following ACTH stimulation was assessed in mice, and the expression of miRNAs in murine adrenals was subsequently investigated. Finally, an extensive targeted gene analysis was performed based on in silico predictions, RNA-seq data, and luciferase assays.

2. Results

2.1. Differentially Expressed miRNAs

NGS revealed differentially expressed miRNAs between the different groups analyzed (Figure 1). CD and CPA taken together as CS showed a differentially expressed profile (42 significant miRNAs) in comparison to controls. Moreover, individually, CPA and CD were found to show a significantly different expression profile in comparison to controls (n = 38 and n = 17 miRNAs, respectively). Interestingly, there were no significantly upregulated genes in the adrenals of patients with CD in comparison to the control adrenals. A comparative analysis of the top significant miRNAs (log2 fold change (log2 FC) > 1.25 & p < 0.005) between the two groups was performed and the representative Venn diagrams are given in Figure 2. Briefly, miR-1247-5p, miR-139-3p, and miR-503-5p were significantly upregulated in CPA, in comparison to both CD and controls. Furthermore, miR-150-5p was specifically upregulated in CPA as compared to CD. Several miRNAs (miR-486-5p, miR-551b-3p, miR-144-5p, miR-144-3p, and miR-363-3p) were found to be significantly downregulated in the groups of CPA and CD in comparison to controls. MiR-19a-3p and miR-873-5p were found to be commonly downregulated in CPA in comparison to both CD and controls. Principal component analyses based on miRNA sequencing did not identify any major clusters among the samples. Furthermore, the miRNA profile was not different among the CPA samples based on the mutation status of PRKACA (Supplementary Materials Figure S1).
Ijms 23 07676 g001 550
Figure 1. Differentially expressed miRNAs from sequencing. Volcano plot showing the relationship between fold change (log2 fold change) and statistical significance (−log10 p value). The red points in the plot represent significantly upregulated miRNAs, while blue points represent significantly downregulated miRNAs. CPA, cortisol producing adenoma; CD, Cushing’s disease; Cushing’s syndrome represents CPA and CD, taken together.
Ijms 23 07676 g002 550
Figure 2. Venn analyses of the common significant miRNAs from each group. The significantly expressed miRNAs from each sequencing analysis were shortlisted and compared between the groups. CPA, cortisol producing adenoma; CD, Cushing’s disease.

2.2. Validation and Selection of Candidate miRNAs

For validation by QPCR, the most significant differentially expressed miRNAs (log2 FC > 1.25 & p < 0.005) among the groups were chosen (Table S1). According to the current knowledge, upregulated miRNAs are known to contribute more to pathology than downregulated miRNAs [16]. Since the total number of significantly upregulated miRNAs was six, all these miRNAs were chosen for validation. Contrarily, 25 miRNAs were significantly downregulated among the groups. In particular, miR-486-5p, miR-551b-3p, miR-144-5p, miR-144-3p, and miR-363-3p were found to be commonly downregulated in the CS group in comparison to controls; therefore, these miRNAs were chosen for validation.
Among the upregulated miRNA candidates, miR-1247-5p QPCR expression confirmed the NGS data (Figure 3A, Table S1). Moreover, miR-150-5p and miR-139-3p were upregulated in CPA specifically in comparison to CD, and miR-379-5p was upregulated in CD in comparison to controls by QPCR. In the case of downregulated genes, none of the selected miRNAs could be confirmed by QPCR (Figure 3B). Thus, analysis of the six upregulated and five downregulated miRNAs from NGS yielded two significantly upregulated miRNA candidates, miR-1247-5p in CPA and miR-379-5p in CD, when compared to controls. These miRNA candidates were taken up for further QPCR validation in an independent cohort of other subtypes of CS (Figure 4), namely ACTH-dependent ectopic CS (n = 3) and ACTH-independent PBMAH (n = 10). The QPCR analysis in the other subtypes revealed miR-1247-5p to be consistently upregulated in ACTH-independent CS (PBMAH and CPA) in comparison to ACTH-dependent CS (CD and ectopic CS) and controls. On the other hand, miR-379-5p was upregulated in CD and PBMAH in comparison to controls.
Ijms 23 07676 g003 550
Figure 3. QPCR analyses of significant miRNAs from sequencing analyses. Data are represented as mean ± standard deviation (SD) of −dCT values: (A) Expression analysis of significantly upregulated miRNAs; (B) Expression analysis of common significantly downregulated miRNAs. Housekeeping gene: miR-16-5p. Statistics: ANOVA test with Bonferroni correction to detect significant differences between patient groups with at least a significance of p-value < 0.05 (*).
Ijms 23 07676 g004 550
Figure 4. QPCR analyses of significantly upregulated miRNAs from validation QPCR. Data are represented as mean ± standard deviation (SD) of −dCT values. Housekeeping gene: miR-16-5p. Statistics: ANOVA test with Bonferroni correction to detect significant differences between patient groups with at least a significance of p-value < 0.05 (*).

2.3. In Vivo Assessment of ACTH-Independent miR-1247-5p

To analyze the influence of ACTH on miRNA expression, the expression of miR-1247-5p and miR-379-5p were assessed in the adrenal tissues of ACTH stimulated mice at different time points. For this analysis, miR-96-5p was taken as a positive control, as it has previously been reported to be differentially expressed in ACTH stimulated mice [17]. The analyses revealed that the expression of miR-1247-5p and miR-379-5p did not change at different timepoints of the ACTH stimulation (Figure 5). Meanwhile, the positive control of mir-96-5p showed a dynamic expression pattern with upregulation after 10 min, followed by downregulation at the subsequent 30 and 60 min time points, in concordance with previously reported findings [18].
Ijms 23 07676 g005 550
Figure 5. Analysis of miRNA expression in ACTH stimulated mice tissue. QPCR analyses of positive controls, miR-96-5p, and candidates miR-379-5p and miR-1247-5p. Mice were injected with ACTH, and adrenals were collected at different timepoints to assess the impact of ACTH on miRNA expression. Data are represented as mean ± standard deviation (SD) of −dCT values. Housekeeping gene: miR-26a-5p. Statistics: ANOVA test with Bonferroni correction to detect significant differences between patient groups with at least a significance of p-value < 0.05 (*).

2.4. In Silico Analyses of miRNA Targets

Two diverse approaches were employed for a comprehensive in silico analysis of the miRNA targets. First, the predicted targets of miR-1247-5p and miR-379-5p were taken from the TargetScan database, which identified miRNA–mRNA target pairs based on sequence analyses [19]. The expression status of these targets was then checked in the RNA sequencing data from CPA vs. controls (miR-1247-5p) and PBMAH vs. controls (miR-379-5p). Targets that showed significant expression changes in the sequencing data were shortlisted (Figure 6A). Among the 1061 predicted miR-1247-5p targets, 28 genes were found to show significant expression changes in CPA (20 upregulated, 8 downregulated). On the other hand, for 124 predicted miR-379-5p targets, 23 genes were found to show significant expression changes in PBMAH (20 upregulated, 3 downregulated). Interestingly, the selected targets were found to be unique for each miRNA, except for FICD (FIC domain protein adenylyltransferase) (Figure 6B).
Ijms 23 07676 g006 550
Figure 6. (A) Differentially expressed target genes of miRNAs from sequencing. Data are represented as log2 fold change in comparison to the controls. Statistics: ANOVA test with Bonferroni correction to detect significant differences between patient groups with at least a significance of p-value < 0.05. (B) Venn analyses of common significant miRNA target genes and related pathways. The significantly expressed targets from each sequencing analysis were shortlisted and compared between the groups. Predicted pathways of the targets from the Panther database were shortlisted and compared between the groups.

2.5. In Vitro Analyses of miR-1247-5p Targets

For in vitro analyses, we focused on downregulated targets, as we expect our upregulated miRNA candidates to cause a downregulation of the target mRNAs. For our downregulated mRNAs, only targets of miR-1247-5p were found to have published links to CS, namely Cyb5a, Gabbr2, and Gnaq (Table 1). Therefore, these three targets were then verified by QPCR in the groups of CPA, CD, PBMAH, ectopic CS, and controls (Figure 6). Only Cyb5A was found to be significantly downregulated in ACTH-dependent forms (ectopic CS and CD) as well as in ACTH-independent CS (PBMAH and CPA) in comparison to controls. Consequently, to assess whether Cyb5a is indeed regulated by miR-1247-5p, a dual luciferase assay was performed. To prove our hypothesis, treatment of Cyb5a-WT cells with miR-1247-5p mimic was expected to lead to a reduced luminescence, whereas no effects were expected in cells treated with the miR-1247-5p inhibitor or the Cyb5a-mutant (with a mutation in the miR-1247-5p binding site). As shown in Figure 7, transfection of miR-1247-5p significantly reduced luminescence from Cyb5a-WT in comparison to cells transfected with Cyb5a-WT and miR-1247-5p inhibitors. However, these predicted binding results were not found to be specific, as there were no significant differences when compared to wells transfected with Cyb5a-WT alone (Figure 8). Consecutively, when the mutated Cyb5a-Mut were transfected along with the mimics and inhibitors, no significant differences in luminescence were observed in the transfected population. Thus, direct interaction between miR-1247-5p and its predicted target gene Cyb5A could not be conclusively proven using this luciferase assay.
Ijms 23 07676 g007 550
Figure 7. QPCR analyses of the top predicted targets of miR-1247-5p. Data are represented as mean ± standard deviation (SD) of −dCT values. Housekeeping gene: PPIA. Statistics: ANOVA test with Bonferroni correction to detect significant differences between patient groups with at least a significance of p-value < 0.05 (*).
Ijms 23 07676 g008 550
Figure 8. Results of dual luminescence assay on cells transfected with miR-1247-5p mimics and related controls. Cells were transfected with plasmids containing either the WT or Mut miRNA binding sequence in Cyb5a. Either miR-1247-5p mimics or miR-1247-5p inhibitors were transfected together with the respective plasmids. Data are represented as mean ± standard error of mean (SEM) of relative luminescence unit values. Statistics: ANOVA test with Bonferroni correction to detect significant differences between patient groups with at least a significance of p value < 0.05 (*).
Table 1. Analysis of the predicted targets of miR-1247-5p and their expression levels in comparison to controls (log2 fold change). Published literature on target genes in reference to CS is highlighted in bold.
Table

2.6. Pathway Analyses of miRNA Targets

For the pathway analysis (Reactome) we used the 28 predicted miRNA-1247-5p targets and the 23 predicted miRNA-379-5p targets from TargetScan, which were significantly differently expressed in the RNA-seq (Figure 6). Concurrently, the pathways commonly enriched by both miRNAs included the WNT signaling pathway and N-acetyl-glucosamine synthesis (Figure 9A). As a complementary approach, in silico analyses were also performed based on the targets from miRTarBase. In this database, targets are shortlisted based on published experimental results. In this analysis, miR-1247-5p (n = 21) and miR-379-5p targets (n = 85) were unique. While the validated targets of miR-379-5p were found to show significant changes in expression in the RNA-seq data from PBMAH (n = 12), none of the validated miR-1247-5p targets were found to show significant expression changes in the RNA-seq data from CPA. Therefore, all the validated targets of the miRNAs were subjected to pathway analyses (Panther). Interestingly, the WNT signaling pathway was also found to be commonly regulated by both miRNAs using this approach (Figure 9B). Finally, the expression status of target genes related to WNT signaling pathways were checked in our RNA-seq data (Figure S2). Given the upregulated status of the miRNAs, a downregulated expression of its target genes was expected. However, a significantly upregulated expression was observed for DVL1 in CPA in comparison to controls and for ROR1 in PBMAH in comparison to controls.
Ijms 23 07676 g009 550
Figure 9. Pathway analyses of miRNA target genes. (A) The predicted targets were matched with the RNA-seq expression data. For miR-1247-5p, CPA vs. controls expression data; and for miR-379-5p, PBMAH vs. controls expression data. The significantly expressed target genes were then subjected to pathway analyses by Reactome. The significantly enriched pathway networks (p < 0.05) and their related genes are given. (B) The experimentally validated target genes from miRTarBase were analyzed for their role in pathways by the Panther database. The target genes and their related pathways are given. The commonly represented pathways are marked in bold.

3. Discussion

MiRNAs are fine regulators of both physiology and pathology and have diverse roles as diagnostic biomarkers as well as therapeutic targets. While circulating miRNAs have been investigated as potential biomarkers for hypercortisolism in CS subtypes (36), comprehensive analyses of their pathological role in CS subtypes have not yet been performed. This study hoped to uncover the pathological role of miRNAs in different CS subtypes as well as identify unique epigenetic targets contributing to hypercortisolism in these subtypes. As such, miRNA sequencing was performed in the ACTH-independent CPA and ACTH-dependent CD, with additional QPCR validation in PBMAH and ectopic CS. As expected, miRNA expression profiles in CD and CPA were very different.

3.1. ACTH-Independent Upregulated miRNAs in CS

Among the analyzed miRNAs, only miR-1247-5p and miR-379-5p showed the most prominent changes in expression levels. Briefly, miR-1247-5p was significantly upregulated in ACTH-independent forms of CS, CPA, and PBMAH (Figure 1 and Figure 3) while miR-379-5p was found to be upregulated in CD and PBMAH, in comparison to controls. Even though CD and PBMAH represent CS subtypes with different ACTH dependence, albeit both with hyperplastic tissue, it is interesting to find a shared miRNA expression status. Concurrently, miRNAs have been identified as dynamic players in regulating the acute effect of ACTH on adrenal steroidogenesis in in vivo murine studies [20,21]. Further diverse miRNAs have been characterized to regulate steroidogenesis in ACTH and dexamethasone treated rats [22] (suppressed ACTH) as well as in in vitro studies [20]. It is possible that miR-379-5p contributes to the adrenal hyperplasia present in both PBMAH and CD by targeting specific genes related to hyperplasia, and miR-1247-5p by contributing to cortisol production independent of ACTH regulation in CPA and PBMAH.
Interestingly, the miRNA candidates (mir-1247-5p and miR-379-5p) in our study have not been previously characterized in any of these studies. Furthermore, the expression of mir-1247-5p and miR-379-5p were found to be independent of ACTH stimulation, underlying their role in CS independently of the HPA axis control and postulating specific regulatory processes.

3.2. Target Genes of miRNAs in CS

Initially, we focused on the selection of known CS specific target genes that could be directly repressed by miRNAs, thereby contributing to pathology. The predicted target genes of miR-1247-5p and miR-379-5p were assessed for their downregulated expression status in the RNA-seq data. Among the selected target genes, only Cyb5a was found to be significantly downregulated in all forms of CS (Figure 6). Cytochrome b5 (CYB5A) is a marker of the zona reticularis and is an important regulator of androstenedione production [23,24]. Based on its role in adrenal steroidogenesis, it is possible that Cyb5a is downregulated by miR1247-5p. To prove our hypothesis, a dual luciferase assay was performed in HELA cell line to identify a direct interaction between Cyb5a and miR-1247-5p (Figure 7). Unfortunately, a direct interaction could not be proven, indicating that miR-1247-5p perhaps regulates its target genes in different ways.

3.3. Pathway Analyses of miRNA Targets

To identify miRNA specific regulatory processes, comprehensive target and pathway analyses were performed. Independent pathway analyses of the respective targets with two different databases of Reactome and Panther showed the WNT signaling pathway as a common targeted pathway of both mir-1247-5p and miR-379-5p (Figure 8). The WNT signaling pathway represents a crucial regulator in diverse developmental as well as pathological processes with tissue-specific effects [25,26]. Consequently, the WNT pathway has been largely characterized as one of the dysregulated pathophysiological mechanisms in CPA. Mutations in PRKACA, one of the WNT signaling proteins, are present in approximately 40% of CPA [27]. In the case of CD, dysregulated WNT signaling has been characterized as promoting proliferation in ACTH-secreting pituitary adenomas [28]. Moreover, activating mutations in beta catenin, one of the WNT signaling pathways, has been characterized as driving adrenal hyperplasia through both proliferation-dependent and -independent mechanisms [29]. Thus, it could be hypothesized that by targeting specific genes in the pathway, miRNAs drive specific pathophysiological processes in diverse CS subtypes.

3.4. MiRNA Target Genes in WNT Signaling

DVL1 (TargetScan) and DVL3 (miRTar) are the shortlisted target genes of miR-1247-5p in the WNT signaling pathway. These genes are members of canonical WNT pathways and, importantly, activation of the cytoplasmic effector Dishevelled (Dvl) is a critical step in WNT/β-catenin signaling initiation [30,31]. Interestingly, no difference in DVL1 and DVL3 gene expression was found in the analyses of ACTH-secreting pituitary adenomas [32]. Therefore, it could be possible that DVL1 and DVL3 are only targeted by miR-1247-5p specifically in the adrenal of CPA and PBMAH patients, leading to its characterized tumor progression. EDN1, TGFBR1 (TargetScan), and ROR1 (miRTar) were the target genes of miR-379-5p related to the WNT pathway. In epithelial ovarian cancer, Endothelin-1 (EDN-1) was found to regulate the epithelial–mesenchymal transition (EMT) and a chemoresistant phenotype [33]. In the case of receptor tyrosine kinase-like orphan receptor 1 (ROR1), higher expression of the gene was associated with a poor prognosis in ovarian cancer [34]. Concurrently, suppression of TGFBR1-mediated signaling by conditional knockout in mice was found to drive the pathogenesis of endometrial hyperplasia, independent of the influence of ovarian hormones [35]. Therefore, it could be hypothesized that the dysregulated expression of these factors in adrenals could trigger similar hyperplastic effects mediated by these factors, as in ovarian tissues.

3.5. Bottlenecks and Future Outlook

Interestingly, among these genes, only DVL1 and ROR1 were found to be significantly upregulated in the RNA-seq data (Figure S2). The major regulatory role of miRNAs in gene expression come from their ability to repress gene expression at the level of transcription and translation. There are also reports of miRNA-mediated gene upregulation; however, the physiological evidence of the role is still unresolved [36]. Therefore, it is interesting to see the selected targets of miR-1247-5p and miR-379-5p upregulated. Moreover, it should be noted that most of the experimentally validated miRNA targets were identified by CLIP methods [37]. Crosslinking immunoprecipitation (CLIP) are binding assays that provide genome-wide maps of potential miRNA-target gene interactions based on sequencing. Moreover, these assays do not make functional predictions on the outcome of miRNA binding, and neither do upregulation or downregulation [38,39]. Therefore, in our current experimental setting, we could only identify potential miRNA target genes and speculate on their pathological role based on the published literature and in silico analyses. Furthermore, extensive mechanistic analyses based on these potential targets could help in elaborating the specific epigenetic pathways that fine-tune CS pathology in different subtypes.

4. Materials and Methods

4.1. Sample Collection and Ethics Approval

All patients were registered in the German Cushing’s Registry, the ENS@T or/and NeoExNET databases (project number protocol code 379-10 and 152-10). The study was approved by the Ethics Committee of the University of Munich. All experiments were performed according to relevant guidelines and protocols, and written informed consent was obtained from all patients involved. The adrenal samples used in the sequencing (miRNA and RNA) belong to the same patient.
For miRNA-specific next-generation sequencing (NGS), a total of 19 adrenocortical tissue samples were used. The cohort consisted of the following patient groups: ACTH-independent CPA, n = 7; ACTH-dependent hypertrophic adrenals of CD patients after bilateral adrenalectomy, n = 8; normal adjacent adrenal tissue from patients with pheochromocytoma as controls, n = 8. For QPCR validation, the patient groups included adrenal tissue from ACTH-independent PBMAH, n = 10, and ACTH-dependent ectopic CS, n = 3.
In the case of mRNA sequencing, a total of 23 adrenocortical tissue samples were used. This includes the following patient groups: CPA, n = 7; PBMAH, n = 8; normal adjacent adrenal tissue from patients with pheochromocytoma as controls, n = 8.
The clinical characteristics of the patients are given in Table 2. Furthermore, of the eight CPA samples in the study, three of them carried known somatic driver mutations in the PRKACA gene and in the ten PBMAH samples, two carried germline mutations in the ARMC5 gene.
Table 2. Clinical characteristics of the patient groups. Data are given as median with 25th and 75th percentiles in brackets. CPA, cortisol producing adenoma; CD, Cushing’s disease.
Table
The adrenal tissues were stored at −80 °C. Total RNA isolation was carried out from all adrenal cortex samples by an RNeasy Tissue Kit (Qiagen, Hilden, Germany). The isolated RNA was kept frozen at −80 °C until further use.

4.2. MiRNA and RNA Sequencing

RNA integrity and the absence of contaminating DNA were confirmed by Bioanalyzer RNA Nano (Agilent Technologies, Santa Clara, CA, USA) and by Qubit DNA High sensitivity kits, respectively. Sequencing libraries were prepared using the Illumina TruSeq Small RNA Library Preparation Kit. NGS was performed on 2 lanes of an Illumina HiSeq2500 (Illumina, CA, USA) multiplexing all samples (paired end read, 50 bp). The quality of sequencing reads was verified using FastQC0.11.5 (http://www.bioinformatics.babraham.ac.uk/projects/fastqc, date last accessed: 13 March 2020) before and after trimming. Adapters were trimmed using cutadapt [40]. Reads with <15 bp and >40 bp insert sequences were discarded. An alignment of reads was performed using miRBase V21 [41,42] with sRNAbench [43]. EdgeR and DeSeq in R were used for further analyses [44,45]. MiRNAs with at least 5 raw counts per library were included. RNA-seq was performed by Qiagen, Hilden, Germany. For mRNA, sequencing was performed on Illumina NextSeq (single end read, 75 bp). Adapter and quality trimming were performed by the “Trim Reads” tool from CLC Genomics Workbench. Furthermore, reads were trimmed based on quality scores. The QC reports were generated by the “QC for Sequencing Reads” tool from CLC Genomics Workbench. Read mapping and gene quantification were performed by the “RNA-seq Analysis” tool from CLC Genomics Workbench [46]. The miRNA-seq data generated in this study have been submitted to the NCBI (PRJNA847385).

4.3. Validation of Individual miRNAs

MiRNAs and genes significantly differentially expressed by NGS were validated by QPCR. Reverse transcription of miRNA-specific cDNA was performed by using the TaqMan MicroRNA Reverse Transcription Kit (Thermo Fisher Scientific, Munich, Germany), and the reverse transcription of RNA genes was done by using the Superscript VILO cDNA synthesis Kit (Thermo Fisher Scientific, Munich, Germany). 50 ng of RNA was used for each of the reverse transcription reactions. Quantitative real-time PCR was performed using the TaqMan Fast Universal PCR Master Mix (2×) (Thermo Fisher Scientific, Munich, Germany) on a Quantstudio 7 Flex Real-Time PCR System (Thermo Fisher Scientific, Munich, Germany) in accordance with the manufacturer’s protocol. All QPCR reactions were performed in a final reaction volume of 20 μL and with 1 μL of 1:5 diluted cDNA. Negative control reactions contained no cDNA templates. Gene expression was quantified using the relative quantification method by normalization with reference gene [47]. Statistical analysis using the bestkeeper tool was used to compare and select the best reference gene with stable expression across the human adrenal samples [48]. Reference genes with significantly different Ct values (p-value < 0.01) between the samples were excluded. Furthermore, primer efficiency and the associated correlation coefficient R2 of the selected reference gene were determined by the standard curve method in serially diluted cDNA samples [49]. In the case of miRNA reference genes, miR-16-5p [48,50,51] and RNU6B [52] previously used in similar studies were compared. MiR-16-5p was found to show the most stable expression levels across the samples with a p-value of 0.452 in comparison to RNU6B which had a p-value of 0.001. In the case of RNA reference genes, PPIA [53] and GAPDH [54] were compared. Here, PPIA was found to show the most stable expression levels across the samples with a p-value of 0.019 in comparison to GAPDH which had a p-value of 0.003. Therefore, these genes were used for the normalization of miRNA and RNA expression in human adrenal samples.

4.4. Target Screening

In silico prediction of the possible miRNA targets was performed using the miRNA target database, TargetScan, and miRTarBase [19,37]. The top predicted targets were further screened based on their expression status in the RNA-seq data from the adrenocortical tissues of CPA, PBMAH, and controls (unpublished data). Pathway analyses of the targets were performed using Reactome [55] and Panther [56] online platforms. The selected downregulated targets were analyzed by QPCR in the adrenocortical samples to confirm their expression status. The successfully validated candidates were then analyzed for regulation by the miRNA using a dual luciferase assay [57].

4.5. Dual Luciferase Assay

The interaction between the predicted 3′-UTR region of Cyb5a and miR-1247-5p was detected using a luciferase activity assay. The 3′UTR sequences of Cyb5a (129 bp) containing the predicted miR-1247-5p binding sites (psiCHECK-2 Cyb5a 3′UTR WT) were cloned into the psiCHECK-2 vector (Promega, Fitchburg, WI, USA). A QuikChange Site-Directed Mutagenesis kit (Agilent Technologies, CA, USA) was used to mutate the miR-1247-5p binding site (psiCHECK-2 Cyb5a 3′UTR mutant) according to the manufacturer’s protocol. All the sequences were verified by Sanger sequencing. Then, 200 ng of the plasmid was used for each transfection. Synthetic miR-1247-5p mimics and specific oligonucleotides that inhibit endogenous miR-1247-5p (miR-1247-5p inhibitors) were purchased from Promega and 100 nmol of the molecules were used for each transfection according to the manufacturer’s protocol. For the assay, HeLa cells were seeded in 96-well plates and incubated for 24 h. The following day, cells were transfected using the following different conditions: (1) psiCHECK-2 Cyb5a 3′UTR WT + miR-1247-5p mimic; (2) psiCHECK-2 Cyb5a 3′UTR WT + miR-1247-5p inhibitor; (3) psiCHECK-2 Cyb5a 3′UTR WT + water; (4) psiCHECK-2 Cyb5a 3′UTR mutant + miR-1247-5p mimic; (5) psiCHECK-2 Cyb5a 3′UTR mutant + miR-1247-5p inhibitor; (6) psiCHECK-2 Cyb5a 3′UTR mutant + water. Forty-eight hours later, luciferase activity in the cells was measured using the dual luciferase assay system (Promega, Fitchburg, WI, USA) in accordance with the manufacturer’s instructions. Renilla luciferase activity was normalized to firefly luciferase activity. Each treatment was performed in triplicate. Any interaction between the cloned gene, Cyb5a (WT and mutant), and miR-1247-5p mimic is accompanied by a decrease in luminescence. This decrease in luminescence would not be observed when the plasmids are transfected with the miR-1247-5p inhibitor, indicating that observed luminescence differences are caused by specific interactions between the plasmid and the miR-1247-5p mimic. Transfection of the plasmid with water corrects any background interactions between the cloned gene and endogenous miRNAs in the culture.

4.6. In Vivo ACTH Stimulation

Experiments were performed on 13-week-old C57BL/6 J female mice (Janvier, Le Genest-Saint-Isle, France). Mice were intraperitoneally injected with 1 mg/kg of ACTH (Sigma Aldrich, Munich, Germany) and adrenals were collected after 10, 30, and 60 min of injections. In addition, control adrenals were collected from mice at baseline conditions (0 min). Mice were killed by cervical dislocation and adrenals were isolated, snap-frozen in liquid nitrogen, and stored at −80 °C for later RNA extraction. MiR-26a was taken as a housekeeping gene in the QPCR [58]. All mice were maintained in accordance with facility guidelines on animal welfare and approved by Landesdirektion Sachsen, Chemnitz, Germany.

4.7. Statistical Analysis and Software

R version 3.6.1 was used for the statistical analyses. To identify RNAs differentially expressed, a generalized linear model (GLM, a flexible generalization of ordinary linear regression that allows for variables that have distribution patterns other than a normal distribution) in the software package edgeR (Empirical Analysis of DGE in R) was employed to calculate p-values [45,59]. p-values were adjusted using the Benjamin–Hochberg false discovery rate (FDR) procedure [60]. Disease groups were compared using the unpaired Mann–Whitney test, and to decrease the false discovery rate a corrected p-value was calculated using the Benjamin–Hochberg method. p adjusted < 0.05 and log2 fold change >1.25 was applied as the cut-off for significance for NGS data. GraphPad Prism Version 8 was used for the statistical analysis of QPCR. To calculate differential gene expression, the dCt method (delta Ct (cycle threshold) value equals target miRNA’s Ct minus housekeeping miRNA’s Ct) was used (Microsoft Excel 2016, Microsoft, Redmond, WA, USA). For QPCR, an ANOVA test with Bonferroni correction was used [61] to assess significance; p-values < 0.05 were considered significant.

5. Conclusions

In conclusion, while comprehensive information regarding the role of miRNAs in acute and chronic phases of steroidogenesis is available, there is little known about the pathological independent role of miRNAs in the pathology of CS. In our study, we have described ACTH-independent miR-1247-5p and miR-379-5p expression in CS for the first time. Thus, by regulating different genes in the WNT signaling pathway, the miRNAs may individually contribute to the Cushing’s pathology in specific subtypes.

Supplementary Materials

The following supporting information can be downloaded at: https://www.mdpi.com/article/10.3390/ijms23147676/s1.

Author Contributions

Conceptualization, S.V., A.C. and A.R.; methodology, S.V., R.Z. and M.E.; software, S.V. and M.E.; validation, R.Z., A.O., D.W. and B.W.; formal analysis, S.V.; investigation, S.V., R.Z., M.E., A.O. and D.W.; resources, A.C., B.W., M.R. and A.R.; data curation, S.V. and R.Z.; writing—original draft preparation, S.V., R.Z. and A.R.; writing—review and editing, S.S., M.R. and A.R.; visualization, S.V.; supervision, A.R.; project administration, A.R.; funding acquisition, A.C., S.S., M.R. and A.R. All authors have read and agreed to the published version of the manuscript.

Funding

This work was supported by a grant from the Deutsche Forschungsgemeinschaft (DFG) (within the CRC/Transregio 205/1 “The Adrenal: Central Relay in Health and Disease”) to A.C., B.W., S.S., M.R. and A.R., and individual grant SB 52/1-1 to S.S. This work is part of the German Cushing’s Registry CUSTODES and has been supported by a grant from the Else Kröner-Fresenius Stiftung to MR (2012_A103 and 2015_A228). A.R. was supported by the FöFoLe Program of the Ludwig Maximilian University, Munich. We thank I. Shapiro, A. Parl, C. Kühne, and S. Zopp for their technical support.

Institutional Review Board Statement

The study was conducted according to the guidelines of the Declaration of Helsinki and approved by the Ethics Committee of the Ludwig Maximilian University, Munich (protocol code 379-10, 152-10 and 20 July2021).

Informed Consent Statement

Informed consent was obtained from all subjects involved in the study.

Data Availability Statement

The miRNA-seq data generated in this study have been submitted to the NCBI (PRJNA847385).

Conflicts of Interest

The authors declare no conflict of interest.

References

  1. Kotłowska, A.; Puzyn, T.; Sworczak, K.; Stepnowski, P.; Szefer, P. Metabolomic biomarkers in urine of cushing’s syndrome pa-tients. Int. J. Mol. Sci. 2017, 18, 294. [Google Scholar] [CrossRef] [PubMed][Green Version]
  2. Valassi, E.; Tabarin, A.; Brue, T.; Feelders, R.A.; Reincke, M.; Netea-Maier, R.; Toth, M.; Zacharieva, S.; Webb, S.M.; Tsagarakis, S.; et al. High mortality within 90 days of diagnosis in patients with Cushing’s syndrome: Results from the ERCUSYN registry. Eur. J. Endocrinol. 2019, 181, 461–472. [Google Scholar] [CrossRef]
  3. Stratakis, C. Cushing syndrome caused by adrenocortical tumors and hyperplasias (corticotropin-independent Cushing syn-drome). Endocr. Dev. 2008, 13, 117–132. [Google Scholar]
  4. Jarial, K.D.S.; Walia, R.; Nahar, U.; Bhansali, A. Primary bilateral adrenal nodular disease with Cushing’s syndrome: Varying aeti-ology. BMJ. Case. Rep. 2017, 2017, bcr2017220154. [Google Scholar] [CrossRef] [PubMed]
  5. Kamilaris, C.D.C.; Stratakis, C.A.; Hannah-Shmouni, F. Molecular Genetic and Genomic Alterations in Cushing’s Syndrome and Primary Aldosteronism. Front. Endocrinol. 2021, 12, 142. [Google Scholar] [CrossRef] [PubMed]
  6. Feelders, R.A.; Pulgar, S.J.; Kempel, A.; Pereira, A.M. The burden of Cushing’s disease: Clinical and health-related quality of life aspects. Eur. J. Endocrinol. 2012, 167, 311–326. [Google Scholar] [CrossRef] [PubMed][Green Version]
  7. Feelders, R.A.; Newell-Price, J.; Pivonello, R.; Nieman, L.K.; Hofland, L.J.; Lacroix, A. Advances in the medical treatment of Cush-ing’s syndrome. Lancet Diabetes Endocrinol. 2019, 7, 300–312. [Google Scholar] [CrossRef]
  8. Krill, K.T.; Gurdziel, K.; Heaton, J.H.; Simon, D.P.; Hammer, G.D. Dicer Deficiency Reveals MicroRNAs Predicted to Control Gene Expression in the Developing Adrenal Cortex. Mol. Endocrinol. 2013, 27, 754–768. [Google Scholar] [CrossRef]
  9. Robertson, S.; Diver, L.A.; Alvarez-Madrazo, S.; Livie, C.; Ejaz, A.; Fraser, R.; Connell, J.M.; MacKenzie, S.M.; Davies, E. Regulation of Corticosteroidogenic Genes by MicroRNAs. Int. J. Endocrinol. 2017, 2017, 2021903. [Google Scholar] [CrossRef][Green Version]
  10. Bujko, M.; Kober, P.; Boresowicz, J.; Rusetska, N.; Zeber-Lubecka, N.; Paziewska, A.; Pekul, M.; Zielinski, G.; Styk, A.; Kunicki, J.; et al. Differential microRNA Expression in USP8-Mutated and Wild-Type Corticotroph Pituitary Tumors Reflect the Difference in Protein Ubiquitination Processes. J. Clin. Med. 2021, 10, 375. [Google Scholar] [CrossRef]
  11. Iliopoulos, D.; Bimpaki, E.I.; Nesterova, M.; Stratakis, C.A. MicroRNA Signature of Primary Pigmented Nodular Adrenocortical Disease: Clinical Correlations and Regulation of Wnt Signaling. Cancer Res. 2009, 69, 3278–3282. [Google Scholar] [CrossRef] [PubMed][Green Version]
  12. Tan, X.-G.; Zhu, J.; Cui, L. MicroRNA expression signature and target prediction in familial and sporadic primary macronodular adrenal hyperplasia (PMAH). BMC Endocr. Disord. 2022, 22, 11. [Google Scholar] [CrossRef]
  13. Vaczlavik, A.; Bouys, L.; Violon, F.; Giannone, G.; Jouinot, A.; Armignacco, R.; Cavalcante, I.P.; Berthon, A.; Letouzé, E.; Vaduva, P.; et al. KDM1A inactivation causes hereditary food-dependent Cushing syndrome. Genet. Med. 2021, 24, 374–383. [Google Scholar] [CrossRef]
  14. Bimpaki, E.I.; Iliopoulos, D.; Moraitis, A.; Stratakis, C.A. MicroRNA signature in massive macronodular adrenocortical disease and implications for adrenocortical tumorigenesis. Clin. Endocrinol. 2010, 72, 744–751. [Google Scholar] [CrossRef]
  15. Vetrivel, S.; Zhang, R.; Engel, M.; Altieri, B.; Braun, L.; Osswald, A.; Bidlingmaier, M.; Fassnacht, M.; Beuschlein, F.; Reincke, M.; et al. Circulating microRNA Expression in Cushing’s Syndrome. Front. Endocrinol. 2021, 12, 10. [Google Scholar] [CrossRef] [PubMed]
  16. O’Brien, J.; Hayder, H.; Zayed, Y.; Peng, C. Overview of microRNA biogenesis, mechanisms of actions, and circulation. Front. Endocrinol. 2018, 9, 402. [Google Scholar] [CrossRef][Green Version]
  17. Butz, H.; Patócs, A. MicroRNAs in endocrine tumors. Electron. J. Int. Fed. Clin. Chem. Lab. Med. 2019, 30, 146–164. [Google Scholar]
  18. Riester, A.; Issler, O.; Spyroglou, A.; Rodrig, S.H.; Chen, A.; Beuschlein, F. ACTH-Dependent Regulation of MicroRNA As Endogenous Modulators of Glucocorticoid Receptor Expression in the Adrenal Gland. Endocrinology 2012, 153, 212–222. [Google Scholar] [CrossRef][Green Version]
  19. Huang, X.; Zhong, R.; He, X.; Deng, Q.; Peng, X.; Li, J.; Luo, X. Investigations on the mechanism of progesterone in inhibiting endo-metrial cancer cell cycle and viability via regulation of long noncoding RNA NEAT1/microRNA-146b-5p mediated Wnt/β-catenin signaling. IUBMB Life 2019, 71, 223–234. [Google Scholar] [CrossRef][Green Version]
  20. Azhar, S.; Dong, D.; Shen, W.-J.; Hu, Z.; Kraemer, F.B. The role of miRNAs in regulating adrenal and gonadal steroidogenesis. J. Mol. Endocrinol. 2020, 64, R21–R43. [Google Scholar] [CrossRef]
  21. Allen, M.J.; Sharma, S. Physiology, Adrenocorticotropic Hormone (ACTH). StatPearls 2021. Available online: https://www.ncbi.nlm.nih.gov/books/NBK500031/ (accessed on 8 December 2021).
  22. Hu, Z.; Shen, W.-J.; Cortez, Y.; Tang, X.; Liu, L.-F.; Kraemer, F.B.; Azhar, S. Hormonal Regulation of MicroRNA Expression in Steroid Producing Cells of the Ovary, Testis and Adrenal Gland. PLoS ONE 2013, 8, e78040. [Google Scholar] [CrossRef][Green Version]
  23. Ghayee, H.K.; Rege, J.; Watumull, L.M.; Nwariaku, F.E.; Carrick, K.S.; Rainey, W.E.; Miller, W.L.; Auchus, R.J. Clinical, biochemical, and molecular characterization of macronodular adrenocortical hyperplasia of the zona reticularis: A new syndrome. J. Clin. Endocrinol. Metab. 2011, 96, E243–E250. [Google Scholar] [CrossRef] [PubMed][Green Version]
  24. Nakamura, Y.; Fujishima, F.; Hui, X.-G.; Felizola, S.J.A.; Shibahara, Y.; Akahira, J.-I.; McNamara, K.M.; Rainey, W.E.; Sasano, H. 3βHSD and CYB5A double positive adrenocortical cells during adrenal development/aging. Endocr. Res. 2015, 40, 8–13. [Google Scholar] [CrossRef] [PubMed][Green Version]
  25. Ng, L.F.; Kaur, P.; Bunnag, N.; Suresh, J.; Sung, I.C.H.; Tan, Q.H.; Gruber, J.; Tolwinski, N.S. WNT Signaling in Disease. Cells 2019, 8, 826. [Google Scholar] [CrossRef][Green Version]
  26. Song, J.L.; Nigam, P.; Tektas, S.S.; Selva, E. microRNA regulation of Wnt signaling pathways in development and disease. Cell. Signal. 2015, 27, 1380–1391. [Google Scholar] [CrossRef][Green Version]
  27. Beuschlein, F.; Fassnacht, M.; Assié, G.; Calebiro, D.; Stratakis, C.A.; Osswald, A.; Ronchi, C.L.; Wieland, T.; Sbiera, S.; Faucz, F.R.; et al. Constitutive Activation of PKA Catalytic Subunit in Adrenal Cushing’s Syndrome. N. Engl. J. Med. 2014, 370, 1019–1028. [Google Scholar] [CrossRef][Green Version]
  28. Ren, J.; Jian, F.; Jiang, H.; Sun, Y.; Pan, S.; Gu, C.; Chen, X.; Wang, W.; Ning, G.; Bian, L.; et al. Decreased expression of SFRP2 promotes development of the pituitary corticotroph adenoma by upregulating Wnt signaling. Int. J. Oncol. 2018, 52, 1934–1946. [Google Scholar] [CrossRef][Green Version]
  29. Pignatti, E.; Leng, S.; Yuchi, Y.; Borges, K.S.; Guagliardo, N.A.; Shah, M.S.; Ruiz-Babot, G.; Kariyawasam, D.; Taketo, M.M.; Miao, J.; et al. Beta-Catenin Causes Adrenal Hyperplasia by Blocking Zonal Transdifferentiation. Cell Rep. 2020, 31, 107524. [Google Scholar] [CrossRef]
  30. Grumolato, L.; Liu, G.; Mong, P.; Mudbhary, R.; Biswas, R.; Arroyave, R.; Vijayakumar, S.; Economides, A.N.; Aaronson, S.A. Canonical and noncanonical Wnts use a common mechanism to activate completely unrelated coreceptors. Genes Dev. 2010, 24, 2517–2530. [Google Scholar] [CrossRef][Green Version]
  31. Tauriello, D.V.F.; Jordens, I.; Kirchner, K.; Slootstra, J.W.; Kruitwagen, T.; Bouwman, B.A.M.; Noutsou, M.; Rüdiger, S.G.D.; Schwamborn, K.; Schambony, A.; et al. Wnt/β-catenin signaling requires interaction of the Dishevelled DEP domain and C terminus with a discontinuous motif in Frizzled. Proc. Natl. Acad. Sci. USA 2012, 109, E812–E820. [Google Scholar] [CrossRef][Green Version]
  32. Colli, L.M.; Saggioro, F.; Neder Serafini, L.; Camargo, R.C.; Machado, H.; Moreira, A.C.; Antonini, S.R.; De Castro, M. Components of the Canonical and Non-Canonical Wnt Pathways Are Not Mis-Expressed in Pituitary Tumors. PLoS ONE 2013, 8, e62424. [Google Scholar] [CrossRef] [PubMed][Green Version]
  33. Rosanò, L.; Cianfrocca, R.; Tocci, P.; Spinella, F.; Di Castro, V.; Caprara, V.; Semprucci, E.; Ferrandina, G.; Natali, P.G.; Bagnato, A. En-dothelin A receptor/β-arrestin signaling to the Wnt pathway renders ovarian cancer cells resistant to chemotherapy. Cancer Res. 2014, 74, 7453–7464. [Google Scholar] [CrossRef] [PubMed][Green Version]
  34. Zhang, H.; Qiu, J.; Ye, C.; Yang, D.; Gao, L.; Su, Y.; Tang, X.; Xu, N.; Zhang, D.; Xiong, L.; et al. ROR1 expression correlated with poor clinical outcome in human ovarian cancer. Sci. Rep. 2014, 4, 5811. [Google Scholar] [CrossRef] [PubMed][Green Version]
  35. Gao, Y.; Li, S.; Li, Q. Uterine epithelial cell proliferation and endometrial hyperplasia: Evidence from a mouse model. Mol. Hum. Reprod. 2014, 20, 776–786. [Google Scholar] [CrossRef]
  36. Orang, A.V.; Safaralizadeh, R.; Kazemzadeh-Bavili, M. Mechanisms of miRNA-Mediated Gene Regulation from Common Downregulation to mRNA-Specific Upregulation. Int. J. Genom. 2014, 2014, 970607. [Google Scholar]
  37. Huang, H.Y.; Lin, Y.C.D.; Li, J.; Huang, K.Y.; Shrestha, S.; Hong, H.C.; Tang, Y.; Chen, Y.G.; Jin, C.N.; Yu, Y.; et al. miRTarBase 2020: Up-dates to the experimentally validated microRNA–target interaction database. Nucleic Acids Res. 2020, 48, D148–D154. [Google Scholar] [CrossRef] [PubMed][Green Version]
  38. Liu, W.; Wang, X. Prediction of functional microRNA targets by integrative modeling of microRNA binding and target expres-sion data. Genome Biol. 2019, 20, 18. [Google Scholar] [CrossRef] [PubMed]
  39. Wang, X. Improving microRNA target prediction by modeling with unambiguously identified microRNA-target pairs from CLIP-ligation studies. Bioinformatics 2016, 32, 1316–1322. [Google Scholar] [CrossRef]
  40. Martin, M. Cutadapt removes adapter sequences from high-throughput sequencing reads. EMBnet. J. 2011, 17, 10–12. [Google Scholar] [CrossRef]
  41. Kozomara, A.; Griffiths-Jones, S. miRBase: Annotating high confidence microRNAs using deep sequencing data. Nucleic Acids Res. 2014, 42, D68–D73. [Google Scholar] [CrossRef][Green Version]
  42. Griffiths-Jones, S. miRBase: The MicroRNA Sequence Database. Methods Mol. Biol. 2006, 342, 129–138. [Google Scholar] [PubMed]
  43. Aparicio-Puerta, E.; Lebrón, R.; Rueda, A.; Gómez-Martín, C.; Giannoukakos, S.; Jáspez, D.; Medina, J.M.; Zubković, A.; Jurak, I.; Fromm, B.; et al. sRNAbench and sRNAtoolbox 2019: Intuitive fast small RNA profiling and differential expression. Nucleic Acids Res. 2019, 47, W530–W535. [Google Scholar] [CrossRef] [PubMed][Green Version]
  44. Anders, S.; Huber, W. Differential expression analysis for sequence count data. Genome Biol. 2010, 11, R106. [Google Scholar] [CrossRef] [PubMed][Green Version]
  45. Robinson, M.D.; McCarthy, D.J.; Smyth, G.K. EdgeR: A Bioconductor package for differential expression analysis of digital gene expression data. Bioinformatics 2010, 26, 139–140. [Google Scholar] [CrossRef][Green Version]
  46. Liu, C.-H.; Di, Y.P. Analysis of RNA Sequencing Data Using CLC Genomics Workbench. Methods Mol. Biol. 2020, 2102, 61–113. [Google Scholar] [CrossRef]
  47. Pfaffl, M.W.; Tichopad, A.; Prgomet, C.; Neuvians, T.P. Determination of stable housekeeping genes, differentially regulated target genes and sample integrity: BestKeeper–Excel-based tool using pair-wise correlations. Biotechnol. Lett. 2004, 26, 509–515. [Google Scholar] [CrossRef]
  48. Wang, X.; Zhang, X.; Yuan, J.; Wu, J.; Deng, X.; Peng, J.; Wang, S.; Yang, C.; Ge, J.; Zou, Y. Evaluation of the performance of serum miRNAs as normalizers in microRNA studies focused on cardiovascular disease. J. Thorac. Dis. 2018, 10, 2599–2607. [Google Scholar] [CrossRef]
  49. Geigges, M.; Gubser, P.M.; Unterstab, G.; Lecoultre, Y.; Paro, R.; Hess, C. Reference Genes for Expression Studies in Human CD8 + Naïve and Effector Memory T Cells under Resting and Activating Conditions. Sci. Rep. 2021, 10, 9411. [Google Scholar] [CrossRef]
  50. Song, J.; Bai, Z.; Han, W.; Zhang, J.; Meng, H.; Bi, J.; Ma, X.; Han, S.; Zhang, Z. Identification of Suitable Reference Genes for qPCR Analysis of Serum microRNA in Gastric Cancer Patients. Dig. Dis. Sci. 2011, 57, 897–904. [Google Scholar] [CrossRef]
  51. Szabó, D.R.; Luconi, M.; Szabó, P.M.; Tóth, M.; Szücs, N.; Horányi, J.; Nagy, Z.; Mannelli, M.; Patócs, A.; Rácz, K.; et al. Analysis of cir-culating microRNAs in adrenocortical tumors. Lab. Investig. 2014, 94, 331–339. [Google Scholar] [CrossRef][Green Version]
  52. Butz, H.; Mészáros, K.; Likó, I.; Patocs, A. Wnt-Signaling Regulated by Glucocorticoid-Induced miRNAs. Int. J. Mol. Sci. 2021, 22, 11778. [Google Scholar] [CrossRef] [PubMed]
  53. Muñoz, J.J.; Anauate, A.C.; Amaral, A.G.; Ferreira, F.M.; Watanabe, E.H.; Meca, R.; Ormanji, M.S.; Boim, M.A.; Onuchic, L.F.; Heilberg, I.P. Ppia is the most stable housekeeping gene for qRT-PCR normalization in kidneys of three Pkd1-deficient mouse models. Sci. Rep. 2021, 11, 19798. [Google Scholar] [CrossRef] [PubMed]
  54. Xia, X.; Liu, Y.; Liu, L.; Chen, Y.; Wang, H. Selection and verification of the combination of reference genes for RT-qPCR analysis in rat adrenal gland development. J. Steroid. Biochem. Mol. Biol. 2021, 208, 105821. [Google Scholar] [CrossRef] [PubMed]
  55. Gillespie, M.; Jassal, B.; Stephan, R.; Milacic, M.; Rothfels, K.; Senff-Ribeiro, A.; Griss, J.; Sevilla, C.; Matthews, L.; Gong, C.; et al. The reactome pathway knowledgebase 2022. Nucleic Acids Res. 2022, 50, D687–D692. [Google Scholar] [CrossRef]
  56. Mi, H.; Ebert, D.; Muruganujan, A.; Mills, C.; Albou, L.-P.; Mushayamaha, T.; Thomas, P.D. PANTHER version 16: A revised family classification, tree-based classification tool, enhancer regions and extensive API. Nucleic Acids Res. 2021, 49, D394–D403. [Google Scholar] [CrossRef]
  57. Wu, T.; Lin, Y.; Xie, Z. MicroRNA-1247 inhibits cell proliferation by directly targeting ZNF346 in childhood neuroblastoma. Biol. Res. 2018, 51, 13. [Google Scholar] [CrossRef][Green Version]
  58. Muñoz, J.J.; Anauate, A.; Amaral, A.G.; Ferreira, F.M.; Meca, R.; Ormanji, M.S.; Boim, M.A.; Onuchic, L.F.; Heilberg, I.P. Identification of housekeeping genes for microRNA expression analysis in kidney tissues of Pkd1 deficient mouse models. Sci. Rep. 2020, 10, 231. [Google Scholar] [CrossRef][Green Version]
  59. Love, M.I.; Huber, W.; Anders, S. Moderated estimation of fold change and dispersion for RNA-seq data with DESeq2. Genome Biol. 2014, 15, 550. [Google Scholar] [CrossRef][Green Version]
  60. Hu, Z.; Gao, S.; Lindberg, D.; Panja, D.; Wakabayashi, Y.; Li, K.; Kleinman, J.E.; Zhu, J.; Li, Z. Temporal dynamics of miRNAs in human DLPFC and its association with miRNA dysregulation in schizophrenia. Transl. Psychiatry 2019, 9, 196. [Google Scholar] [CrossRef]
  61. Esteva-Socias, M.; Gómez-Romano, F.; Carrillo-Ávila, J.A.; Sánchez-Navarro, A.L.; Villena, C. Impact of different stabilization methods on RT-qPCR results using human lung tissue samples. Sci. Rep. 2020, 10, 3579. [Google Scholar] [CrossRef]
Publisher’s Note: MDPI stays neutral with regard to jurisdictional claims in published maps and institutional affiliations.

Osilodrostat Improves Physical Manifestations of Hypercortisolism for Most Adults

Osilodrostat is associated with improvements in physical manifestations of hypercortisolism and reductions in mean body weight and BMI in adults with Cushing’s syndrome, according to a speaker.

As Healio previously reported, in findings from the LINC 4 phase 3 trial, osilodrostat (Isturisa, Recordati) normalized mean urinary free cortisol level at 12 weeks in more than 75% of adults with Cushing’s disease. In new findings presented at the AACE Annual Scientific and Clinical Conference, most adults with Cushing’s syndrome participating in the LINC 3 phase 3 trial had improvements in physical manifestations of hypercortisolism 72 weeks after initiating osilodrostat, with more than 50% having no dorsal fat pad, supraclavicular fat pad, facial rubor, proximal muscle atrophy, striae, ecchymoses and hirsutism for women at 72 weeks.

Adrenal transparent _Adobe
Source: Adobe Stock

“Many patients with Cushing’s syndrome suffer from clinical manifestations related to hypercortisolism,” Albert M. Pedroncelli, MD, PhD, head of clinical development and medical affairs for Recordati AG in Basel, Switzerland, told Healio. “The treatment with osilodrostat induced a rapid normalization of cortisol secretion, and improvements in physical manifestations associated with hypercortisolism were observed soon after initiation of osilodrostat and were sustained throughout the study.”

Albert M. Pedroncelli

Pedroncelli and colleagues analyzed changes in the physical manifestations of hypercortisolism in 137 adults with Cushing’s syndrome (median age, 40 years; 77.4% women) assigned osilodrostat. Dose titration took place from baseline to 12 weeks, and therapeutic doses were administered from 12 to 48 weeks, with some participants randomly assigned to withdrawal between 26 and 34 weeks. An extension phase of the trial took place from 48 to 72 weeks. Investigators subjectively rated physical manifestations of hypercortisolism in participants as none, mild, moderate or severe. Participants were evaluated at baseline and 12, 24, 34, 48 and 72 weeks.

At baseline, the majority of the study cohort had mild, moderate or severe physical manifestations of hypercortisolism in most individual categories, including dorsal fat pad, central obesity, supraclavicular fat pad, facial rubor, hirsutism in women and striae. Central obesity was the most frequent physical manifestation rated as severe.

The percentage of participants with improvements in physical manifestations of hypercortisolism increased from week 12 on for all individual manifestations evaluated in the study, and improvements were maintained through week 72. At 72 weeks, the percentage of participants who had no individual physical manifestations was higher than 50% for each category except central obesity, where 30.6% of participants had no physical manifestations.

In addition to improvement in physical manifestations, the study cohort had decreases in body weight, BMI and waist circumference at weeks 48 and 72 compared with baseline.

“The main goal of treating patients with Cushing’s syndrome is to normalize cortisol secretion,” Pedroncelli said. “The rapid reduction and normalization of cortisol levels is accompanied by improvement in the associated clinical manifestations. This represents an important objective for patients.”

From https://www.healio.com/news/endocrinology/20220512/osilodrostat-improves-physical-manifestations-of-hypercortisolism-for-most-adults