Cushing’s disease (CD) is an extremely rare diagnosis in children. In this report, we present the case of an almost 16-year-old, short and thin boy with CD, the first symptoms of which were spinal pain and vertebral fractures as a result of osteoporosis. In light of his growth retardation and short stature, the boy underwent diagnostics, which excluded growth hormone (GH) deficiency, hypothyroidism and celiac disease. Finally, based on cortisol profile results, dexamethasone suppression tests and bilateral sampling during catheterization of the inferior petrosal sinuses, CD was diagnosed.
Cushing’s disease (CD) is an extremely rare diagnosis in children; however, if it occurs, it is more likely to present in older children [1,2]. It is a type of ACTH-dependent Cushing’s syndrome (CS), in which the pituitary gland is the source of ACTH secretion. The highest incidence of CD occurs in children aged 12.3–14.1 years [3]. The incidence of CD during this developmental age is approximately 5% of that seen in adults (with an annual incidence of 0.89–1 per million pediatric patients) [1,2,4]. The rarest form of ACTH-dependent CS in children is ectopic Cushing’s syndrome (ECS), associated with ectopic production of ACTH or CRH, most commonly by neuroendocrine tumors such as bronchial carcinoids, gastrointestinal tumors, medullary thyroid carcinoma, or pheochromocytomas [2,4,5]. Children with ECS constitute 1% of patients with CS in the developmental age [2]. An even rarer disease is ACTH-independent Cushing’s syndrome—associated with adrenal lesions (adenoma, carcinoma, bilateral macronodular adrenal hyperplasia (BMAH), or primary pigmented nodular adrenocortical disease (PPNAD)) [2].
Regarding CD, ACTH is secreted in an overwhelming majority of cases by pituitary corticotropic microadenomas and—less commonly—by macroadenomas, the latter occurring in only 10% of adult CD cases and even more rarely in children (2%) [1,3]. Long-term hypercortisolemia can also lead to bone-mineralization disorders, including osteoporosis, especially in the bones of the central skeleton [4,6,7].
In children, the most common features of CD are rapid weight gain (93–98%), growth retardation (63–100%) and/or facial changes (63–100%) [4]. Mood disturbances, muscle weakness, osteopenia, and headaches are less frequent symptoms. Limited data are available about bone mineral density (BMD) in children with CD. Lonser et al. [8] observed fractures in 7% of patients with CD that were studied. Chronic glucocorticoid excess associated with CD has negative effects on bone turnover, leading to bone-mineralization disorders in both adults and children. Multiple factors contribute to decreased bone mineral density in CD, including the direct effect of glucocorticoids on osteoclasts and osteoblasts, both impairing bone formation and enhancing bone resorption. Glucocorticoids also act to decrease gastrointestinal calcium absorption and renal calcium reabsorption. Bone loss occurs more frequently in Cushing’s syndrome caused by adrenal tumors in CD [6,7].
An additional factor involved in bone-mineralization disorders, particularly in adult patients with CD, may be hypogonadotropic hypogonadism. Reproductive and sexual dysfunctions are highly prevalent in CS, with higher frequency observed in patients with pituitary-related CS, compared to those with adrenal-related CS. Hypogonadism is identified in as much as 50–75% of men with CS and menstrual irregularities are present in 43–80% of women diagnosed with this condition. During active disease, there is a significant reduction in plasma testosterone and gonadotropin levels in men [7,9]. These testosterone levels typically normalize during remission of the disease. Pivonello et al. [7] suggest that the lack of testosterone normalization three months after CS treatment indicates the need for administration of testosterone to protect the patient’s bone mass. In children, cortisol excess can also suppress gonadotropin, TSH and growth hormone secretion, contributing to the absence of pubertal characteristics or inhibiting its progression in patients who have already entered puberty [1].
So far, to our knowledge, there have been no reports on children where bone-mineralization disorders (without weight gain and hirsutism) are the first sign of CD.
2. Case Presentation
We present the case of an almost 16-year-old boy with short stature who, in May 2021, was referred to the Osteoporosis Outpatient Clinic of the Polish Mother’s Memorial Hospital—Research Institute (PMMH-RI) in Lodz, Poland, due to severe back pain. Low bone mass was diagnosed via dual-energy X-ray absorptiometry (DXA).
Initially, it seemed that the occurrence of those symptoms might be related to steroid therapy, because in November 2020 (just after SARS-CoV-2 infection) the child had developed severe abdominal pain, accompanied by an increase in the activity of liver enzymes, and after excluding an infectious cause, autoimmune hepatitis was diagnosed. Deflazacort (Calcort) therapy was prescribed in gradually reduced doses, with the initial dose being 24 mg in the morning and 18 mg in the afternoon. This therapy was discontinued on 1 October 2021. As early as on the fifth day of glucocorticosteroid treatment, pain presented in the lumbar spine region, increasing with movement. Initially, the pain was intermittent, then it became constant. No painkillers were needed. On 7 May 2021, on the basis of DXA, low bone mass was diagnosed (Z-score Spine: −4.2, Z-score TBLH: −1.9). In June 2021 (while still undergoing treatment with steroids) the boy was admitted to the Department of Endocrinology and Metabolic Diseases PMMH-RI for further diagnostics (Table 1).
Table 1. The medical history and the course of diagnostics and treatment.
The patient was a second child, born at 40 weeks of gestational age, weighing 4150 g, measuring 56 cm, and achieving a 10-point Apgar score. During infancy, he received vitamin D supplementation in accordance with Polish recommendations at that time. However, after his first year of life, the supplementation was not taken regularly. The boy received vaccinations according to the standard immunization schedule. There was no significant family medical history.
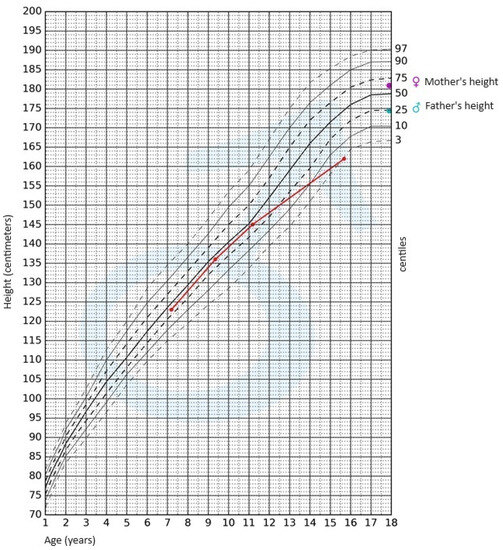
During the physical examination, apart from the presence of short stature, no other notable abnormalities were detected. The skin was clear, without pathological lesions; no features of hyperandrogenism were observed. The boy’s body weight was 47.4 kg (3rd–10th centile); his height, 162 cm (<3rd centile); and height SDS, −2.36; while his BMI was 18.06 kg/m2 (10th–25th centile). Pubarche was assessed as stage 4 according to the Tanner scale; the volume of the testes was 10–12 mL each. After available anthropometric measurements from the patient’s medical history were plotted on the growth chart for sex and chronological age, it became evident that the boy experienced growth retardation from the age of 11 (Figure 1).
Figure 1. Growth chart for boys. The red line represents growth retardation from the age of 11.
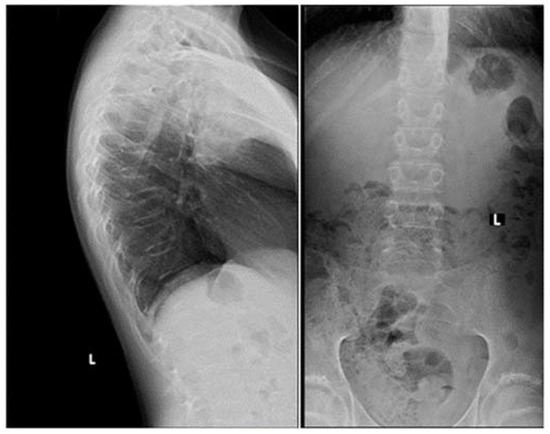
Apart from slightly increased calcium excretion in the 24 h urine collection (Calcium: 9.52 mmol/24 h), there were no significant abnormalities in the laboratory tests assessing calcium–phosphate metabolism (Calcium: 2.41 mmol/L, Phosphorus: 1.3 mmol/L). Serum parathormone (PTH) and vitamin D concentrations remained normal (PTH: 22.9 pg/mL, 25(OH)D: 46.7 ng/mL). Due to the described pain complaints, a thoracolumbar spine X-ray was performed. A decrease in the height of the Th5-Th9 vertebrae and central lowering of the upper border plate of the L4 and L5 were observed (Figure 2).
Figure 2. A thoracolumbar spine X-ray with multilevel vertebral fractures. Decrease in the height of the Th5–Th9 vertebrae and central lowering of the upper border plate of the L4 and L5 were found.
Magnetic resonance imaging (MRI) of the spine confirmed multilevel vertebral fractures, which, together with the presence of low bone mass on DXA examination, allowed a diagnosis (according to ISCD guidelines) of osteoporosis to be made. Treatment included calcium supplements and cholecalciferol. The parents did not consent to treatment with bisphosphonates (sodium pamidronate), which is an off-label treatment.
In light of the patient’s short stature and growth retardation, an endocrinological assessment was conducted. The possibility of growth hormone (GH) deficiency and hypothyroidism as underlying causes for the growth retardation was ruled out. Gonadotropin and androgen levels were adequate for the pubertal stage (FSH—8.3 IU/L, LH—4.7 IU/L, testosterone—4.750 ng/mL, DHEA-S—230.30 µg/dL (normal range: 70.2–492), 17-OH-progesterone—0.78 ng/mL). The bone age was assessed to be 15 years.
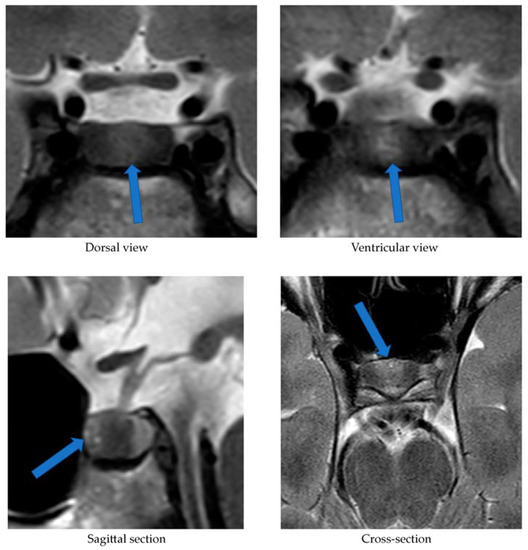
Alongside continued steroid therapy for autoimmune hepatitis, profiles of cortisol and ACTH secretion were performed. Due to the patient’s elevated cortisol levels during night hours (cortisol 24:00—10.7 µg/dL), an overnight dexamethasone suppression test (DST) and low-dose dexamethasone suppression test (LDDST) were performed. After administering 1 mg dexamethasone (23:00), his morning cortisol level (8:00) still remained elevated (cortisol—3.4 µg/dL). However, after administering 0.5 mg dexamethasone every 6 h for the next 2 days, cortisol levels (8:00) normalized (cortisol—1.0 µg/dL). An MRI of the pituitary gland showed only a poorly demarcated area in the anterior part of the glandular lobe, measuring approximately 2.0 × 3.5 × 5.0 mm on T2W images (Figure 3). A follow-up MRI examination was recommended, which was performed during the child’s next hospitalization in January 2022. The previously described area was still very faint.
Figure 3. MRI examination image depicting the poorly demarcated area in the anterior part of the glandular lobe. The arrows point to a structure suspected of being an adenoma.
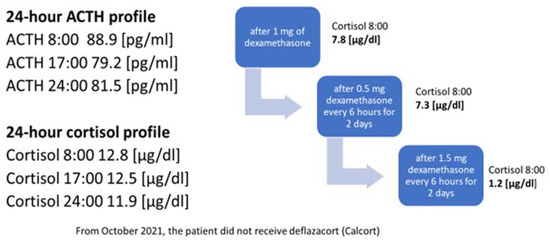
In October 2021, the administration of deflazocort as a treatment was discontinued. During hospitalization in January 2022, the diurnal pattern of ACTH and cortisol secretion was re-evaluated, yet no consistent diurnal rhythm was observed; cortisol levels remained elevated at night. For this reason, overnight DST and then LDDST were carried out again (Figure 4), in which no suppression of cortisol concentrations was obtained. Only after a high-dose DST (HDDST), in which a high 1.5 mg of dexamethasone was administered every 6 h (125 µg/kg/24 h), was cortisol secretion suppressed.
Figure 4. Laboratory findings indicating the diagnosis of ACTH-dependent Cushing’s syndrome.
Based on the above results, CD was suspected as the cause of osteoporosis and growth retardation. In February 2022, a CRH test was performed upon the patient, which revealed a four-fold increase in ACTH levels and a two-fold increase in serum cortisol levels (Table 2).
Table 2. The results of human CRH (hCRH) stimulation test and bilateral inferior petrosal sinus sampling (BIPSS).
The CRH stimulation test was administered in the morning using human synthetic CRH (Ferring) at a dose of 1 μg/kg of body weight. During the test, cortisol and ACTH levels were measured in serum at the following time points: −15, 0, 15, 30, 60, and 90 min (see Table 2). As part of the diagnostic process, urinary free cortisol excretion was also measured over two consecutive days. Only on the first day was there a slight elevation in urinary free cortisol concentration, measuring 183.60 μg/24 h (normal range: 4.3–176). The measurement performed on the second day showed a normal urinary free cortisol concentration of 145.60 μg/24 h (normal range: 4.3–176). On 2 March 2022, the patient underwent a bilateral inferior petrosal sinus sampling (BIPSS). Human CRH stimulation was also used during the procedure. The presence of ACTH-dependent hypercortisolemia of pituitary origin was confirmed. The outcome of the CRH stimulation during the BIPSS is presented in Table 2. The boy qualified for transsphenoidal surgery (TSS) of the pituitary adenoma and was successfully operated on (8 March 2022). Postoperative histopathological examination revealed features of a corticotroph-rich pituitary adenoma.
3. Discussion
Osteoporosis, like CD, is extremely rare in the developmental age population. Bone-mineralization disorders among children may be primary (e.g., osteogenesis imperfecta), or secondary to other diseases or their treatment (e.g., with glucocorticosteroids). This case report presents a boy with osteoporosis, the cause of which was originally attributed to the treatment of autoimmune hepatitis with glucocorticosteroids. Steroid therapy is the most common cause of bone-mineralization disorders in children. However, osteoporosis is a late complication of steroid treatment. Briot et al. [10] demonstrated that the risk of fractures increases as early as 3 months after initiating steroid therapy. An additional factor increasing the risk of fractures is the dose of glucocorticosteroids used, corresponding to 2.5–5 mg of prednisolone per day [10]. In the case of the present patient, the appearance of spinal pain and thus vertebral fractures could not have been related to the deflazacort treatment started 5 days earlier. The bone-mineralization disorder must therefore have occurred much earlier. For this reason, the authors considered it necessary to search for other endocrine causes of osteoporosis development, including hypogonadism, growth hormone deficiency or Cushing’s syndrome/disease.
The serum vitamin D concentration can also influence bone mineral density. Every patient with mineralization disorders, especially with osteoporosis, requires a thorough assessment of calcium–phosphate metabolism [11]. Until the initiation of steroid therapy in March 2021, the patient did not undergo regular vitamin D supplementation. At the start of deflazacort treatment, his serum 25(OH)D concentration was 12.4 ng/mL. Consequently, additional cholecalciferol supplementation at a dose of 3000 IU/day was introduced. In a subsequent measurement conducted in June 2021, the concentration was within the reference range [25(OH)D: 46.7 ng/mL].
Considering the lack of regular supplementation before March 2021, it can be assumed that in October 2020, when the boy experienced SARS-CoV-2 infection, his serum vitamin D concentration was likely decreased as well, which could have had a further negative impact on the patient’s bone mineralization. Scientific reports indicate that adequate vitamin D levels reduce the risk of viral infections, including SARS-CoV-2 [12]. Di Filippo et al. [13] demonstrated that vitamin D deficiency observed in 68.2% of SARS-CoV-2-infected individuals correlated with a more severe course of the infection. In our patient, the course of COVID-19 was asymptomatic, and the diagnosis was established based on positive IgM antibody titers against SARS-CoV-2. The vitamin deficiency was most likely associated with irregular supplementation and lack of exposure to UV radiation (due to lockdown measures in Poland at that time). A reduced serum 25(OH)D concentration could have contributed to worsened bone mineral density and increased susceptibility to SARS-CoV-2 infection; however, it is the chronic hypercortisolism characteristic of CD that most likely led to the development of osteoporosis with accompanying fractures.
Another factor necessitating further diagnostic investigation into CD was the patient’s growth retardation observed since the age of 11. Both the pubertal state of the boy, and his gonadotropin and testosterone serum levels, allowed us to exclude hypogonadism. Maximum spontaneous nocturnal secretion of the growth hormone was 31.84 ng/mL. The diagnosis of CD was established on the basis of elevated cortisol levels at night and the lack of cortisol suppression in the test after administering dexamethasone. Final confirmation of the diagnosis was obtained in a post-CRH stimulation test. In pediatric cases, the absence of typical diurnal variation in serum corticosolemia, especially the nocturnal decline, and the inability to suppress cortisol secretion at midnight, are highly sensitive indicators of hypercortisolemia [6,8]. Consequently, in our patient, osteoporosis was a complication of diagnosed CD.
The patient in question was not obese, which is the predominant symptom of CD. This symptom, according to Ferrigno et al. [1], is present in 92–98% of examined children diagnosed with CD. Storr et al. [14] showed that facial changes and facial swelling were observed in 100% of subjects with CD, whereas Lonser et al. [8] observed this in only 63% of children with CD. In our patient, no changes in facial appearance were observed. Other symptoms typical of CS, such as hirsutism, acne, or bruises, were not noticed either. These symptoms were observed in all children with CD studied by Wędrychowicz et al. [3]. Non-specific symptoms of this condition may include mood changes, depression and emotional vacillation [1,8]. However, our patient’s parents did not observe any changes in the boy’s behavior. The indication for initiating the whole diagnostic process was (in addition to osteoporosis) growth retardation. Ferrigno et al. [1] point out that chronic hypercortisolemia most often leads to growth disorders accompanied by excessive weight gain. This is an early, highly sensitive and characteristic sign of CD. Short stature is not always observed and occurs in one in two children diagnosed with CD. The patient we present was short (height—162 cm (<3rd centile hSDS: −2.36)); growth retardation was observed from the age of 11 years.
The occurrence of vertebral fractures and the accompanying pain as the initial symptoms of hypercortisolism, the absence of obesity, and the confirmation of CD, an exceedingly rare condition in the pediatric population, collectively underscore the uniqueness of our patient’s disease presentation. A case involving a child with such an atypical course of ACTH-dependent CS has not been described before. Han et al. [15] reported a case of a 28-year-old lean woman (BMI: 19 kg/m²) with ACTH-independent CS due to a left adrenal adenoma, where, similarly to our patient, the initial manifestation of hypercortisolism was compression fractures of the thoracic vertebrae. The authors emphasize that vertebral fractures may affect 30–50% of patients with Cushing’s syndrome, with a higher frequency observed in patients with ACTH-independent CS compared to those in whom hypercortisolism results from the presence of pituitary adenoma [15].
The lack of obesity in a patient with hypercortisolism could be attributed to malnutrition, which accompanies the growth process in ECS. Hence, a crucial aspect was the differential diagnosis between CD and ECS. To this end, we performed a stimulation test using hCRH. We considered cut-off points for diagnosing CD to be a 35% increase in ACTH concentration at 15 and/or 30 min, and at least a 20% increase in cortisol concentration at 30 and 45 min [16,17]. In the case of ECS, a significant rise in CRH and cortisol concentrations is not observed. Recently published reports emphasize the need to explore new cut-off points to enhance the sensitivity and specificity of this test. Detomas et al. [5] indicate that an increase in ACTH ≥ 31% and cortisol ≥ 12% in the 30th minute of CRH tests allows for a highly sensitive and specific differentiation between CD and ECS. The authors highlight that measuring these hormones at the 60 min stage of the test does not provide diagnostic benefits. Notably, the study employed ovine CRH, which exhibits stronger and more prolonged stimulatory effects compared to the hCRH available in Europe that was used to diagnose our patient [5]. Conversely, Elenius et al. [16] suggest that optimal values for distinguishing between CD and ECS in the CRH stimulation test involve an increase in ACTH and/or cortisol levels of more than 40% during the test. In our patient, an over four-fold increase in ACTH levels and a more than two-fold increase in cortisol levels were observed at the 30 min mark of the test, thus independently and definitively excluding ECS regardless of the adopted cut-off points.
Our patient’s case also demonstrates that MRI is not a perfect method of visualizing an ACTH-secreting pituitary adenoma. In the first MRI examination performed upon our patient, a poorly demarcated area (2.0 × 3.5 × 5.0 mm) was described in the anterior part of the glandular lobe; in the examination performed 6 months later, this area maintained poor visibility, while laboratory results at the time clearly indicated an ACTH-dependent form of CS. It was only the bilateral inferior petrosal sinus sampling (BIPSS) that allowed a clear diagnosis. Data from the literature indicate that microadenomas smaller than 3–4 mm are visible on MRI in only half of cases. In two large studies including children, pituitary adenomas were found on MRI in 63% and 55% of cases [18]. Among the patients with CD studied by Wędrychowicz et al. [3], pituitary adenomas were described on MRI in all of them, but in two patients (50%) this was only achieved upon follow-up. In the standard procedure, in the absence of a pituitary lesion in the MRI examination, it is recommended that a BIPSS be performed. In the case of our patient, this examination was necessary to make a definitive diagnosis.
When analyzing the results of the BIPSS with hCRH stimulation, we employed the classical cut-offs for the ACTH IPS:P (Inferior Petrosal Sinus: Peripheral) ratio (i.e., ≥2 at baseline and ≥3 after hCRH stimulation) [1]. This allowed the confirmation of CD and determination of the pituitary adenoma’s localization, followed by the procedure for its surgical removal. The optimal cut-off values for the IPS:P ratio remain controversial. There are ongoing efforts to establish new, more precise cut-off points. Detomas et al. [19] demonstrated that an IPS:P ratio ≥ 2.1 during desmopressin stimulation in the BIPSS most accurately differentiates CD from ECS. Conversely, Chen et al. [20] showed that the optimal pre-desmopressin stimulation IPS:P ratio cut-off is 1.4, and post-stimulation it is 2.8. Both studies suggest the utilization of lower cut-off values for the IPS:P ratio than those traditionally adopted. Chen et al. [20] also advocate for avoiding stimulation during BIPSS. In most cases, the IPS:P ratio before stimulation is sufficient for diagnosing CD. According to the authors, desmopressin stimulation should be reserved for patients with ambiguous MRI findings or with a pituitary adenoma with diameter less than 6 mm. However, considering that the concentration of ACTH in the right inferior petrosal sinus in our patient was over 4 times higher than in the peripheral vessel and nearly 14 times higher after hCRH stimulation, regardless of the applied criteria, CD could be unequivocally diagnosed in our patient, and the lateralization of the microadenoma could be determined with certainty.
The rarity of CD, and the diagnostic difficulties stemming from its oligosymptomatic or atypical course, encourage description in the form of case reports. Eviz et al. [21] delineate the occurrence of cerebral cortical atrophy in two children with ECS. Additionally, other researchers have underscored the potential for thyroid disorders to manifest alongside hypercorticosolemia [22]. Although obesity typically stands out as a primary symptom of CD, Pomahacova et al. [23] reported a case involving two children with CD who maintained normal body weight, mirroring our patient’s situation. The symptoms that prompted diagnostic investigation in these instances included weakness, sleep disturbances and growth retardation. Interestingly, growth retardation, along with facial changes, was observed in all examined children with CD [23]. Nonetheless, to the best of our knowledge, we have yet to encounter a case report resembling ours. Therefore, it remains crucial to share our experiences.
4. Conclusions
Cushing’s disease is an extremely rare diagnosis in children. In Poland, there is no statistical record of occurrences of this disease among children. Wędrychowicz et al. reported that in their single Polish center, between 2012 and 2018, they identified four cases of children aged 7–15 who were diagnosed with CD [3]. The case we present shows that obesity, commonly considered as a predominant symptom of CD, is not necessarily observed in patients with this diagnosis in the developmental age population. Among children, it is growth disturbance that may be the first manifestation. On the other hand, a late complication of CD may be osteoporosis, so whenever a child is diagnosed with a bone-mineralization disorder, the cause of its development should be sought.
Diagnosis should be pursued until all potential causes of the described symptoms, including the rarest ones, are definitively ruled out—even if the clinical presentation, as in the case of our patient, initially does not point towards the final diagnosis. Thus far, no case of a child with CD exhibiting such subtle symptomatology has been described in the literature. The challenges in diagnosis we encountered primarily resulted from the atypical clinical outcome of CD in our patient—normal body weight, absence of hyperandrogenism, mood disturbances not apparent to caregivers and the patient’s immediate environment, as well as normal progression of puberty, did not immediately lead to the consideration of endocrinological causes of osteoporosis. The steroid therapy employed due to autoimmune hepatitis also complicated the diagnostic process. Only after discontinuing deflazacort treatment was it possible to definitively diagnose CD.
Our patient required hydrocortisone replacement in gradually decreasing doses for a year following TSS. Considering that pituitary adenomas in children can be genetically predisposed (e.g., MEN 1 mutation, AIP mutation, USP8 mutation, and other rarer ones), genetic consultation was sought [1]. However, the conducted tests have thus far excluded the most common mutations in our patient. Due to the diagnosed osteoporosis, chronic supplementation with calcium and cholecalciferol was recommended, along with annual follow-up DXA scans. Studies indicate that patients in remission from CD experience a gradual improvement in bone mineral density [3]. While we can currently observe remission in our patient’s case, the advanced bone age of the child (indicating the completion of the growth process) left limited potential for significant improvement in final growth. The patient still requires regular endocrinological and neurosurgical follow-ups, hormonal assessments, and pituitary MRI examinations.
Author Contributions
Conceptualization—R.S. and A.Ł.; software—S.A.; formal analysis—R.S.; investigation—A.Ł. and G.Z.; data curation—A.Ł.; writing—original draft preparation—A.Ł., R.S. and S.A.; writing—review and editing—A.L.; visualization—S.A.; supervision—A.L. All authors have read and agreed to the published version of the manuscript.
Funding
This study was funded by statutory funds from the Medical University of Lodz, Lodz, Poland (503/1-107-03/503-11-001).
Institutional Review Board Statement
Not applicable.
Informed Consent Statement
Written informed consent has been obtained from the patient to publish this paper.
Stratakis, A. Cushing syndrome in pediatrics. Endocrinol. Metab. Clin. N. Am. 2012, 41, 793–803. [Google Scholar] [CrossRef]
Wędrychowicz, A.; Hull, B.; Tyrawa, K.; Kalicka-Kasperczyk, A.; Zieliński, G.; Starzyk, J. Cushing disease in children and adolescents—Assessment of the clinical course, diagnostic process, and effects of the treatment—Experience from a single paediatric centre. Pediatr. Endocrinol. Diabet. Metab. 2019, 25, 127–143. [Google Scholar] [CrossRef]
Concepción-Zavaleta, M.J.; Armas, C.D.; Quiroz-Aldave, J.E.; García-Villasante, E.J.; Gariza-Solano, A.C.; Del Carmen Durand-Vásquez, M.; Concepción-Urteaga, L.A.; Zavaleta-Gutiérre, F.E. Cushing disease in pediatrics: An update. Ann. Pediatr. Endocrinol. Metab. 2023, 28, 87–97. [Google Scholar] [CrossRef]
Detomas, M.; Ritzel, K.; Nasi-Kordhishti, I.; Wolfsberger, S.; Quinkler, M.; Losa, M.; Tröger, V.; Kroiss, M.; Fassnacht, M.; Vila, G.; et al. Outcome of CRH stimulation test and overnight 8 mg dexamethasone suppression test in 469 patients with ACTH-dependent Cushing’s syndrome. Front. Endocrinol. 2022, 13, 955945. [Google Scholar] [CrossRef] [PubMed]
Lodish, M.B.; Hsiao, H.P.; Serbis, A.; Sinaii, N.; Rothenbuhler, A.; Keil, M.F.; Boikos, S.A.; Reynolds, J.C.; Stratakis, C.A. Effects of Cushing disease on bone mineral density in a pediatric population. J. Pediatr. 2010, 56, 1001–1005. [Google Scholar] [CrossRef] [PubMed]
Pivonello, R.; Isidori, A.M.; De Martino, M.C.; Newell-Price, J.; Biller, B.M.; Colao, A. Complications of Cushing’s syndrome: State of the art. Lancet Diabetes Endocrinol. 2016, 4 (Suppl. S7), 611–629. [Google Scholar] [CrossRef] [PubMed]
Lonser, R.R.; Wind, J.J.; Nieman, L.K.; Weil, R.J.; DeVroom, H.L.; Oldfield, E.H. Outcome of surgical treatment of 200 children with Cushing’s disease. J. Clin. Endocrinol. Metab. 2013, 98, 892–901. [Google Scholar] [CrossRef]
Detomas, M.; Deutschbein, T.; Tamburello, M.; Chifu, I.; Kimpel, O.; Sbiera, S.; Kroiss, M.; Fassnacht, M.; Altieri, B. Erythropoiesis in Cushing syndrome: Sex-related and subtype-specific differences. Results from a monocentric study. J. Endocrinol. Investig. 2023; epub ahead of print. [Google Scholar] [CrossRef]
Briot, K.; Roux, C. Glucocorticoid-induced osteoporosis. RMD Open 2015, 1, 14. [Google Scholar] [CrossRef]
Laird, E.; Ward, M.; McSorley, E.; Strain, J.J.; Wallace, J. Vitamin D and bone health; potential mechanisms. Nutrients 2010, 2, 693–724. [Google Scholar] [CrossRef]
di Filippo, L.; Frara, S.; Nannipieri, F.; Cotellessa, A.; Locatelli, M.; Querini, P.R.; Giustina, A. Low vitamin D levels are associated with long COVID syndrome in COVID-19 survivors. J. Clin. Endocrinol. Metab. 2023, 1–11. [Google Scholar] [CrossRef] [PubMed]
di Filippo, L.; Allora, A.; Doga, M.; Formenti, A.M.; Locatelli, M.; Rovere Querini, P.; Frara, S.; Giustina, A. Vitamin D levels are associated with blood glucose and BMI in COVID-19 patients, predicting disease severity. J. Clin. Endocrinol. Metab. 2022, 107, 348–360. [Google Scholar] [CrossRef]
Han, J.Y.; Lee, J.; Kim, G.E.; Yeo, J.Y.; Kim, S.H.; Nam, M.; Kim, Y.S.; Hong, S. Case of Cushing syndrome diagnosed by recurrent pathologic fractures in a young woman. J. Bone Metab. 2012, 19 (Suppl. S2), 153–158. [Google Scholar] [CrossRef] [PubMed]
Elenius, H.; McGlotten, R.; Nieman, L.K. Ovine CRH stimulation and 8 mg dexamethasone suppression tests in 323 patients with ACTH-dependent Cushing’s syndrome. J. Clin. Endocrinol. Metab, 2023; Epub ahead of print. [Google Scholar] [CrossRef]
Nieman, L.K.; Biller, B.M.K.; Findling, J.W.; Newell-Price, J.; Savage, M.O.; Stewart, P.M.; Montori, V.M. The diagnosis of Cushing’s syndrome: An Endocrine Society Clinical Practice Guideline. J. Clin. Endocrinol. Metab. 2008, 93 (Suppl. S5), 1526–1540. [Google Scholar] [CrossRef] [PubMed]
Detomas, M.; Ritzel, K.; Nasi-Kordhishti, I.; Schernthaner-Reiter, M.H.; Losa, M.; Tröger, V.; Altieri, B.; Kroiss, M.; Kickuth, R.; Fassnacht, M.; et al. Bilateral inferior petrosal sinus sampling with human CRH stimulation in ACTH-dependent Cushing’s syndrome: Results from a retrospective multicenter study. Eur. J. Endocrinol. 2023, 188 (Suppl. S5), 448–456. [Google Scholar] [CrossRef]
Chen, S.; Chen, K.; Wang, S.; Zhu, H.; Lu, L.; Zhang, X.; Tong, A.; Pan, H.; Wang, R.; Lu, Z. The optimal cut-off of BIPSS in differential diagnosis of ACTH-dependent Cushing’s syndrome: Is stimulation necessary? J. Clin. Endocrinol. Metab. 2020, 105 (Suppl. S4), 1673–1685. [Google Scholar] [CrossRef]
Eviz, E.; Yesiltepe, M.G.; Arduc, A.A.; Erbey, F.; Guran, T.; Hatun, S. An overlooked manifestation of hypercortisolism—Cerebral cortical atrophy and challenges in identifying the etiology of hypercortisolism: A report of 2 pediatric cases. Horm. Res. Paediatr. 2023, 27. [Google Scholar] [CrossRef]
Paragliola, R.M.; Corsello, A.; Papi, G.; Pontecorvi, A.; Corsello, S.M. Cushing’s syndrome effects on the thyroid. Int. J. Mol. Sci. 2021, 22, 3131. [Google Scholar] [CrossRef]
Disclaimer/Publisher’s Note: The statements, opinions and data contained in all publications are solely those of the individual author(s) and contributor(s) and not of MDPI and/or the editor(s). MDPI and/or the editor(s) disclaim responsibility for any injury to people or property resulting from any ideas, methods, instructions or products referred to in the content.
Łupińska, A.; Aszkiełowicz, S.; Zieliński, G.; Stawerska, R.; Lewiński, A. Osteoporosis as the First Sign of Cushing’s Disease in a Thin 16-Year-Old Boy—A Case Report. J. Clin. Med.2023, 12, 5967. https://doi.org/10.3390/jcm12185967
AMA StyleŁupińska A, Aszkiełowicz S, Zieliński G, Stawerska R, Lewiński A. Osteoporosis as the First Sign of Cushing’s Disease in a Thin 16-Year-Old Boy—A Case Report. Journal of Clinical Medicine. 2023; 12(18):5967. https://doi.org/10.3390/jcm12185967
Chicago/Turabian StyleŁupińska, Anna, Sara Aszkiełowicz, Grzegorz Zieliński, Renata Stawerska, and Andrzej Lewiński. 2023. “Osteoporosis as the First Sign of Cushing’s Disease in a Thin 16-Year-Old Boy—A Case Report” Journal of Clinical Medicine 12, no. 18: 5967. https://doi.org/10.3390/jcm12185967
Find Other Styles
Note that from the first issue of 2016, this journal uses article numbers instead of page numbers. See further details here.
Article Metrics
Citations
No citations were found for this article, but you may check on Google Scholar
The diagnosis of Cushing’s syndrome is challenging; however, through the clinical picture and the search for secondary causes of osteoporosis, it was possible to reach the diagnosis of the case reported. There was an independent, symptomatic ACTH hypercortisolism manifested by typical phenotypic changes, severe secondary osteoporosis and arterial hypertension in a young patient.
Case presentation
A 20-year-old Brazilian man with low back pain for 8 months. Radiographs showed fragility fractures in the thoracolumbar spine, and bone densitometry showed osteoporosis, especially when evaluating the Z Score (− 5.6 in the lumbar spine). On physical examination, there were wide violaceous streaks on the upper limbs and abdomen, plethora and fat increase in the temporal facial region, hump, ecchymosis on limbs, hypotrophy of arms and thighs, central obesity and kyphoscoliosis. His blood pressure was 150 × 90 mmHg. Cortisol after 1 mg of dexamethasone (24.1 µg/dL) and after Liddle 1 (28 µg/dL) were not suppressed, despite normal cortisoluria. Tomography showed bilateral adrenal nodules with more severe characteristics. Unfortunately, through the catheterization of adrenal veins, it was not possible to differentiate the nodules due to the achievement of cortisol levels that exceeded the upper limit of the dilution method. Among the hypotheses for the differential diagnosis of bilateral adrenal hyperplasia are primary bilateral macronodular adrenal hyperplasia, McCune–Albright syndrome and isolated bilateral primary pigmented nodular hyperplasia or associated with Carney’s complex. In this case, primary pigmented nodular hyperplasia or carcinoma became important etiological hypotheses when comparing the epidemiology in a young man and the clinical-laboratory-imaging findings of the differential diagnoses. After 6 months of drug inhibition of steroidogenesis, blood pressure control and anti-osteoporotic therapy, the levels and deleterious metabolic effects of hypercortisolism, which could also impair adrenalectomy in the short and long term, were reduced. Left adrenalectomy was chosen, given the possibility of malignancy in a young patient and to avoid unnecessary definitive surgical adrenal insufficiency if the adrenalectomy was bilateral. Anatomopathology of the left gland revealed expansion of the zona fasciculate with multiple nonencapsulated nodules.
Conclusion
The early identification of Cushing’s syndrome, with measures based on the assessment of risks and benefits, remains the best way to prevent its progression and reduce the morbidity of the condition. Despite the unavailability of genetic analysis for a precise etiological definition, it is possible to take efficient measures to avoid future damage.
Cushing’s syndrome may be exogenous or endogenous and, in this case, can be ACTH-dependent or independent. In the case reported, there was an independent, symptomatic ACTH hypercortisolism manifested by typical phenotypic changes, severe secondary osteoporosis and arterial hypertension in a young patient. Osteoporosis secondary to hypercortisolism occurs due to chronic reduction in bone formation, loss of osteocytes and increased reabsorption caused by intense binding of cortisol to glucocorticoid receptors present in bone cells [1]. In addition, excess cortisol impairs vitamin D metabolism and reduces endogenous parathyroid hormone secretion, intestinal calcium reabsorption, growth hormone release, and lean body mass [2]. Subclinical Cushing disease occurs in up to 11% of individuals diagnosed with early-onset osteoporosis and 0.5–1% of hypertension patients. [3] A cross-sectional study published in 2023 revealed a prevalence of 81.5% bone loss in 19 patients with Cushing’s syndrome [2]. The prevalence of osteopenia ranges from 60 to 80%, and the prevalence of osteoporosis ranges from 30 to 65% in patients with Cushing’s syndrome. Additionally, the incidence of fragility fractures ranges from 30 to 50% in these patients [4] and is considered the main cause of morbidity affecting the quality of life. The diagnosis is challenging, given the presence of confounding factors; however, through the clinical picture and the search for secondary causes of osteoporosis, it was possible to reach a syndromic diagnosis. Early identification of this syndrome, with measures based on the assessment of risks and benefits, remains the best way to prevent progression and reduce morbidity related to this disease [2].
Case presentation
A 20-year-old Brazilian male patient reported low back pain that had evolved for 8 months, with no related trauma. He sought emergency care and performed spinal radiographs on this occasion (03/2019). Due to the several alterations observed in the images, he was referred to the Orthopedics Service of the Hospital of Federal University of Juiz de Fora, which prescribed orthopedic braces, indicated physical therapy and was referred again to the Osteometabolic Diseases outpatient clinic of the Endocrinology and Rheumatology Services of the Hospital of Federal University of Juiz de Fora on 10/2019.
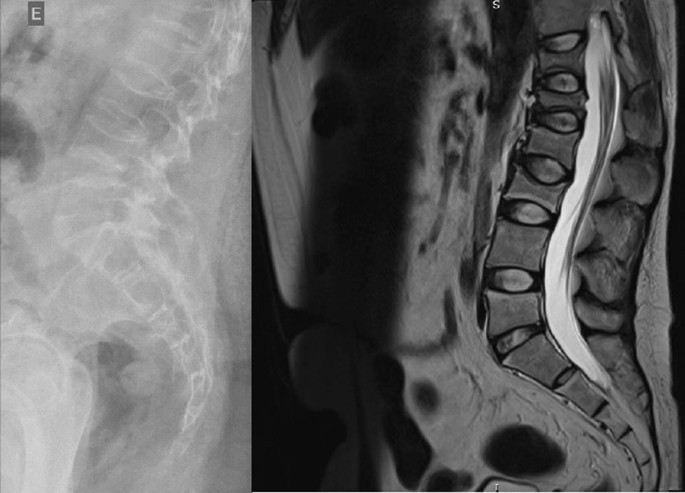
The radiographs showed a marked reduction in the density of bone structures, scoliotic deviation with convexity toward the left and reduction in the height of the lumbar vertebrae, with partial collapses of the vertebral bodies at the level of T12, L1, L2, L3 and L5, with recent collapses in T12 and L1, suggesting bone fragility fractures. The same can be seen in posterior magnetic resonance imaging (Fig. 1).
Fig. 1
Radiography and Magnetic Resonance Imaging (MRI) of lumbosacral spine in profile
Bone scintigraphy on 08/2019 did not reveal hyper flow or anomalous hyperemia in the topography of the thoracolumbar spine, and in the later images of the exam, there was a greater relative uptake of the tracer in the lumbar spine (vertebrae T10–T12, L2–L4), of nonspecific aspect, questioning the presence of osteoarticular processes or ankylosing spondylitis.
It was also observed in the bone densitometry requested in October 2019, performed by dual-energy X-ray absorptiometry (DXA), low bone mineral density (BMD) in the lumbar spine, femoral neck and total femur, when comparing the results to evaluating the Z Score (Table 1).
Thus, the diagnosis of osteoporosis was established, and treatment with vitamin D 7000 IU per week was started due to vitamin D3 insufficiency associated with the bisphosphonate alendronate 70 mg, also weekly. The patient had a past pathological history of fully treated syphilis (2018) and perianal condyloma with a surgical resection on 09/2017 and 02/2018. In the family history, it was reported that a maternal uncle died of systemic sclerosis. In the social context, the young person denied drinking alcohol and previous or current smoking.
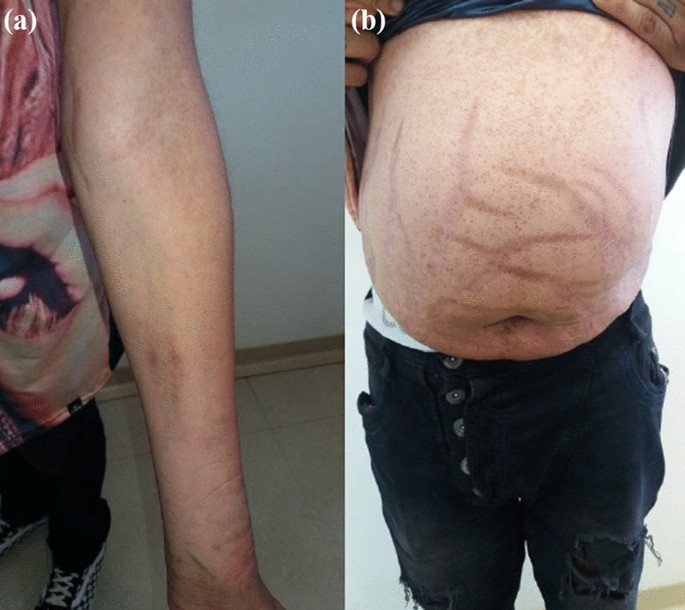
On physical examination, there were no lentiginous skin areas or blue nevi; however, wide violet streaks were observed on the upper limbs and abdomen, with plethora and increased fat in the temporal facial region and hump (Fig. 2a, b), limb ecchymosis, hypotrophy of the arms and thighs, central obesity and kyphoscoliosis. Systemic blood pressure (sitting) was 150 × 90 mmHg, BMI was 26.09 kg/m2, and waist circumference was 99 cm, with no reported reduction in height, maintained at 1.55 m.
Fig. 2
Changes in the physical examination. a Violet streaks on the upper limbs, b Violet streaks on abdomen
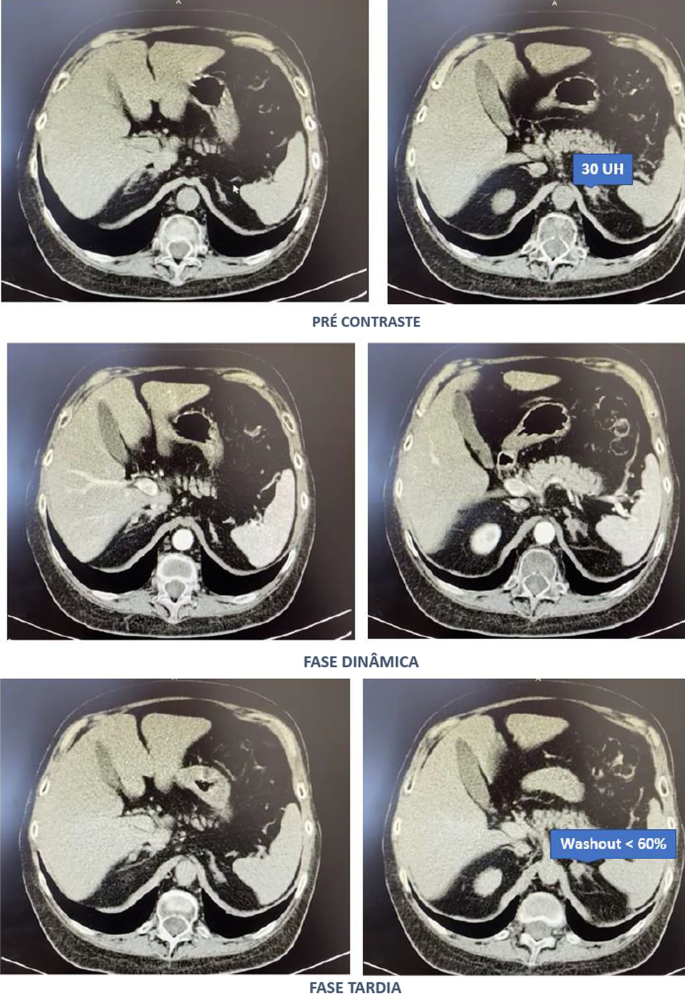
Computed tomography of the abdomen with adrenal protocol performed on 08/13/2020 characterized isodense nodular formation in the body of the left adrenal and in the lateral portion of the right adrenal, measuring 1.5 cm and 0.6 cm, respectively. The lesions had attenuation of approximately 30 HU, showing enhancement by intravenous contrast, with an indeterminate washout pattern in the late phase after contrast (< 60%) (Fig. 3).
After contact with the interventional radiology of the Hospital of Federal University of Juiz de Fora, catheterization of adrenal veins was performed on 10/2020; however, it was not possible to perform adequate lesion characterization due to obtaining serum cortisol levels that extrapolated the dilutional upper limit of the method (Table 3).
The calculation of the selectivity index was 6.63 (Reference Value (RV) > 3), confirming the good positioning of the catheter within the vessels during the procedure. The calculated lateralization index was 1.1296 (VR < 3), denoting bilateral hormone production. However, as aldosterone was not collected from a peripheral vein, it was not possible to obtain the contralateral rate and define whether there was contralateral suppression of aldosterone production [5].
Due to pending diagnoses for a better therapeutic decision and Cushing’s syndrome in clear evolution and causing organic damage, it was decided, after catheterization, to make changes in the patient’s drug prescription. Ketoconazole 400 mg per day was started, the dose of vitamin D was increased to 14,000 IU per week, and ramipril 5 mg per day was prescribed due to secondary hypertension. In addition, given the severity of osteoporosis, it was decided to replace previously prescribed alendronate with zoledronic acid.
Magnetic resonance imaging of the upper abdomen was performed on 06/19/2021, which demonstrated lobulated nodular thickening in the left adrenal gland with areas of decreased signal intensity in the T1 out-phase sequence, denoting the presence of fat, and homogeneous enhancement using contrast, measuring approximately 1.7 × 1.5 × 1.3 cm, suggestive of an adenoma. There was also a small nodular thickening in the lateral arm of the right adrenal, measuring approximately 0.8 × 0.6 cm, which was difficult to characterize due to its small dimensions and nonspecific appearance.
PPNAD or carcinoma became an important etiological hypothesis for the case described when comparing the epidemiology in a young man and the clinical-laboratory-imaging findings of the differential diagnoses. According to a dialog with the patient and family, the group of experts opted for unilateral glandular surgical resection on the left side (11/11/2021), where more significant changes were visualized, as there was a possibility of malignancy in a young patient and to avoid a definitive adrenal insufficiency condition because of bilateral adrenalectomy. This would first allow the analysis of the material and follow-up of the evolution of the condition with the permanence of the contralateral gland.
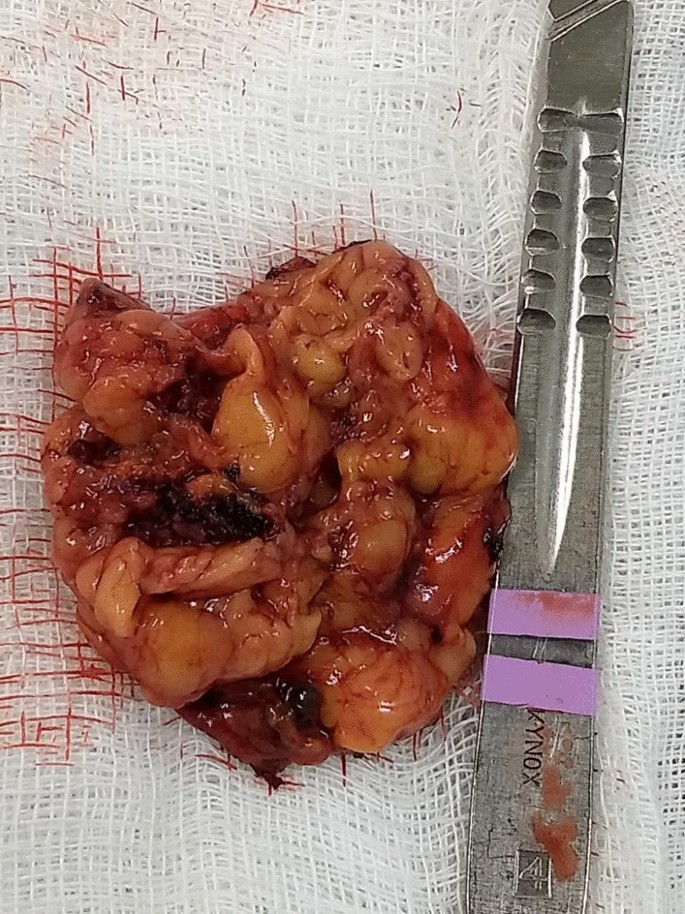
In the macroscopic analysis of the adrenalectomy specimen, adrenal tissue weighing 20 g and measuring 9.3 × 5.5 × 2.0 cm was described, completely surrounded by adipose tissue. The gland has a multinodular surface and varies between 0.2 and 1.6 cm in thickness, showing a cortex of 0.1 cm in thickness and a medulla of 1.5 cm in thickness (Fig. 4).
The microscopic analysis described the expansion of the zona fasciculate, with the formation of multiple nonencapsulated nodules composed of polygonal cells with ample and eosinophilic cytoplasm and frequent depletion of intracytoplasmic lipid content. No areas of necrosis or mitotic activity were observed. The histopathological picture is suggestive of cortical pigmented micronodular hyperplasia of the adrenal gland.
For the final etiological definition and an indication of contralateral adrenalectomy, which could be unnecessary and would avoid chronic corticosteroid therapy, or else, it would be necessary to protect the patient from future complications with the maintenance of the disease in the right adrenal gland, it would be essential to search for mutations in the PRKAR1A, PDE11A, PDE8B and PRKACA genes [15]; however, such genetic analysis is not yet widely available, and the impossibility of carrying it out at the local level did not allow a complete conclusion of the case.
Discussion
Through the clinical picture presented and the research of several secondary causes for osteoporosis, it was possible to arrive at the diagnosis of Cushing syndrome [6]. There was symptomatic independent ACTH hypercortisolism, manifested by typical phenotypic changes, severe secondary osteoporosis, and arterial hypertension in a young patient.
The diagnosis of Cushing’s syndrome is always challenging, given the presence of confounding factors such as the following:
Frequent and, even unknown, short- and long-term use of corticosteroids under different presentations;
Increase in the general population incidence of diabetes and obesity;
Screening tests with singularities for collection and individualized for different patient profiles.
It is important to note that the basal morning cortisol measurement is not the ideal test to assess hypercortisolism and is better applied to the assessment of adrenal insufficiency. However, the hypercortisolism of the case was unequivocal, and this test was also shown to be altered several times. As no test is 100% accurate, the current guidelines suggest the use of at least two first-line functional tests that focus on different aspects of the pathophysiology of the hypothalamic‒pituitary‒adrenal axis to confirm the hypercortisolism state: 24-hours cortisol, nocturnal salivary cortisol, morning serum cortisol after suppression with 1 mg of dexamethasone or after Liddle 1. Given that night-time salivary cortisol would require hospitalization, the other suggested tests were chosen, which are easier to perform in this context [7, 8].
Subsequently, tests were performed to determine the cause of hypercortisolism, such as serum ACTH levels and adrenal CT. The suppressed ACTH denoted the independence of its action. CT showed bilateral adrenal nodules with more severe features: solid lesion, attenuation > 10 UI on noncontrast images, and contrast washout speed < 60% in 10 minutes. In this case, it is essential to make a broad clinical decision and dialog with the patient to weigh and understand the risks and benefits of surgical treatment [9].
Among the main diagnostic hypotheses for the differential diagnosis of bilateral adrenal hyperplasia are primary bilateral macronodular adrenal hyperplasia, McCune–Albright syndrome (MAS) and bilateral primary pigmented nodular hyperplasia (PPNAD) isolated or associated with Carney’s complex. Another possibility would be bilateral adrenocorticotropic hormone (ACTH)-dependent macronodular hyperplasia secondary to long-term adrenal stimulation in patients with Cushing’s disease (ACTH-secreting pituitary tumor) or ectopic ACTH production, but the present case did not present with ACTH elevation.
Primary macronodular adrenal hyperplasia (nodules > 1 cm) predominates in women aged 50–60 years and may also be detected in early childhood (before 5 years) in the context of McCune–Albright syndrome. Most cases are considered sporadic; however, there are now several reports of familial cases whose presentation suggests autosomal dominant transmission. Several pathogenic molecular causes were identified in the table, indicating that it is a heterogeneous disease [10]. The pathophysiology occurs through the expression of anomalous ectopic hormone receptors or amplified eutopic receptors in the adrenals. It usually manifests in an insidious and subclinical way, with cortisol secretion mediated through receptors for gastric inhibitory peptide (GIP), vasopressin (ADH), catecholamines, interleukin 1 (IL-1), leptin, luteinizing hormone (LH), serotonin or others. Nodular development is not always synchronous or multiple; thus, hypercortisolism only manifests when there is a considerable increase in the number of adrenocortical cells, with severe steroidogenesis observed by cortisoluria greater than 3 times the upper limit of normal. Patients with mild Cushing’s syndrome should undergo screening protocols to identify aberrant receptors, as this may alter the therapeutic strategy. If there is evidence of abnormal receptors, treatment with beta-blockers is suggested for patients with beta-adrenergic receptors or with gonadotropin-releasing hormone (GnRH) agonists (and sex steroid replacement) for patients with LH/hCG receptors. In patients in whom aberrant hormone receptors are not present or for whom no specific pharmacological blockade is available or effective, the definitive treatment is bilateral adrenalectomy, which is known to make the patient dependent on chronic corticosteroid therapy [11]. Studies have shown the effectiveness of unilateral surgery in the medium and long term, opting for the resection of the adrenal gland of greater volume and nodularity by CT, regardless of the values obtained by catheterization of adrenal veins, but with the possibility of persistence or recurrence in the contralateral gland. Another possibility would be total unilateral adrenalectomy associated with subtotal contralateral adrenalectomy [12].
In McCune–Albright syndrome (MAS), there are activating mutations in the G-protein GNAS1 gene, generating autonomic hyperfunction of several tissues, endocrine or not, and there may be, for example, a constant stimulus similar to ACTH on the adrenal gland. In this case, pituitary levels of ACTH are suppressed, and adrenal adenomas with Cushing’s syndrome appear. Hypercortisolism may occur as an isolated manifestation of the syndrome or be associated with the triad composed of polyostotic fibrous dysplasia, café au lait spots with irregular borders and gonadal hyperfunction with peripheral precocious puberty. The natural history of Cushing’s syndrome in McCune-Albright syndrome (MAS) is heterogeneous, with some children evolving with spontaneous resolution of hypercortisolism, while others have a more severe condition, eventually requiring bilateral adrenalectomy [13].
PPNAD predominates in females, in people younger than 30 years, multiple and small (< 6 mm) bilateral pigmented nodules (surrounded by atrophied cortex), which can reach 1.5 cm in adulthood, with family genetic inheritance (66%) or sporadic inheritance (33%), and as part of the Carney complex reported in 40% of cases. In 70% of cases, inactivating mutations are identified in the PKA regulatory 1-alpha subunit (PRKAR1A), a tumor suppressor gene [14]. Osteoporosis is often associated with this condition [15]. One test that can distinguish patients with PPNAD from other primary adrenocortical lesions is cortisoluria after sequential suppression with low- and high-dose dexamethasone. In contrast to most patients with primary adrenocortical disease, who demonstrate no change in urinary cortisol, 70% of PPNAD patients have a paradoxical increase in urinary cortisol excretion [16]. The treatment of choice for PPNAD is bilateral adrenalectomy due to the high recurrence rate for primary adrenal disease [17].
Carney complex is a multiple neoplastic syndrome with autosomal dominant transmission, characterized by freckle-like cutaneous hyperpigmentation (lentiginosis), endocrine tumors [(PPNAD), testicular and/or thyroid tumors and acromegaly] and nonendocrine tumors, including cutaneous, cardiac, mammary, and osteochondral myxomas, among others. In the above case, the transthoracic echocardiogram of the patient on 03/18/2021 showed cavities of normal dimensions, preserved systolic and diastolic functions, no valve changes and no lentiginous skin areas and blue nevi, making the diagnosis of the syndrome less likely. The definitive diagnosis of Carney requires two or more main manifestations. Several related clinical components may suggest the diagnosis but not define it. The diagnosis can also be made if a key criterion is present and a first-degree relative has Carney or an inactivating mutation of the gene encoding PRKAR1A [18].
The adenoma is usually small in size (< 3 cm), similar to the nodules in this case; however, it is usually unilateral, with an insidious and mild evolution, especially in adult women over 35 years of age, producing only 1 steroid class. Carcinomas are usually large (> 6 cm), and only 10% are bilateral. They should be suspected mainly when the tumor presents with hypercortisolism associated with hyperandrogenism. They have a bimodal age distribution, with peaks in childhood and adolescence, as well as at the end of life [3].
Conclusion
Early identification of Cushing’s syndrome, with measures based on the assessment of risks and benefits, remains the best way to prevent progression and reduce morbidity [2]. After 6 months of drug inhibition of steroidogenesis, blood pressure control and anti-osteoporotic therapy, the objective was to minimize the levels and deleterious metabolic effects of hypercortisolism, which could also harm the surgical procedure in the short and long term through infections, dehiscence, nonimmediate bed mobilization and cardiovascular events. Unilateral adrenalectomy was chosen, given the possibility of malignancy in a young patient and to avoid definitive surgical adrenal insufficiency if the adrenalectomy was bilateral. Despite the unavailability of genetic analysis for a precise etiological definition, it is possible to take efficient measures to avoid unnecessary consequences or damage.
Pedro AO, Plapler PG, Szejnfeld VL. Manual brasileiro de osteoporose: orientações práticas para os profissionais de saúde. 1st ed. São Paulo: Editora Clannad; 2021. ISBN 978-65-89832-00-3.
Naguib R, Elkemary EZ, Elsharkawi KM. The severity of bone loss: a comparison between Cushing’s disease and Cushing’s syndrome. J Endocrinol Metab. 2023;13(1):33–8. https://doi.org/10.14740/jem857.
Wang D, Dang CX, Hao YX, Yu X, Liu PF, Li JS. Relationship between osteoporosis and Cushing syndrome based on bioinformatics. Medicine (Baltimore). 2022;101(43): e31283.
Williams TA, Reincke M. Management of Endocrine Disease: diagnosis and management of primary aldosteronism: the Endocrine Society guideline 2016 revisited. Eur J Endocrinol. 2018;179(1):R19–29. https://doi.org/10.1530/EJE-17-0990.
Compston J, Cooper A, Cooper C, Gittoes N, Gregson C, Harvey N, National Osteoporosis Guideline Group (NOGG), et al. UK clinical guideline for the prevention and treatment of osteoporosis. Arch Osteoporos. 2017;12(1):43. https://doi.org/10.1007/s11657-017-0324-5.
Hsiao HP, Kirschner LS, Bourdeau I, Keil MF, Boikos SA, Verma S, et al. Clinical and genetic heterogeneity, overlap with other tumor syndromes, and atypical glucocorticoid hormone secretion in adrenocorticotropin-independent macronodular adrenal hyperplasia compared with other adrenocortical tumors. J Clin Endocrinol Metab. 2009;94(8):2930–7. https://doi.org/10.1210/jc.2009-0516.
Stratakis CA, Sarlis N, Kirschner LS, Carney JA, Doppman JL, Nieman LK, et al. Paradoxical response to dexamethasone in the diagnosis of primary pigmented nodular adrenocortical disease. Ann Intern Med. 1999;131(8):585–91. https://doi.org/10.7326/0003-4819-131-8-199910190-00006.
Almeida MQ, Stratakis CA. Carney complex and other conditions associated with micronodular adrenal hyperplasias. Best Pract Res Clin Endocrinol Metab. 2010;24(6):907–14. https://doi.org/10.1016/j.beem.2010.10.006.
Serviço de Endocrinologia, Hospital Universitário da Universidade Federal de Juiz de Fora, Juiz de Fora, Minas Gerais, Brazil
Bárbara Oliveira Reis, Christianne Toledo Sousa Leal, Danielle Guedes Andrade Ezequiel, Ana Carmen dos Santos Ribeiro Simões Juliano, Flávia Lopes de Macedo Veloso, Leila Marcia da Silva, Lize Vargas Ferreira, Mariana Ferreira & Gabriel Zeferino De Oliveira Souza
Contributions
All the authors contributed to the conception and design of the work and have approved the submitted version. All authors read and approved the final manuscript.
Written informed consent was obtained from the patient for publication of this case report and any accompanying images. A copy of the written consent is available for review by the Editor-in-Chief of this journal.
Competing interests
The authors declare that they have no competing interests.
Additional information
Publisher’s Note
Springer Nature remains neutral with regard to jurisdictional claims in published maps and institutional affiliations.
Supplementary Information
Additional file 1. Surgical removal of adrenal gland.
Rights and permissions
Open Access This article is licensed under a Creative Commons Attribution 4.0 International License, which permits use, sharing, adaptation, distribution and reproduction in any medium or format, as long as you give appropriate credit to the original author(s) and the source, provide a link to the Creative Commons licence, and indicate if changes were made. The images or other third party material in this article are included in the article’s Creative Commons licence, unless indicated otherwise in a credit line to the material. If material is not included in the article’s Creative Commons licence and your intended use is not permitted by statutory regulation or exceeds the permitted use, you will need to obtain permission directly from the copyright holder. To view a copy of this licence, visit http://creativecommons.org/licenses/by/4.0/. The Creative Commons Public Domain Dedication waiver (http://creativecommons.org/publicdomain/zero/1.0/) applies to the data made available in this article, unless otherwise stated in a credit line to the data.
Cushing’s syndrome (CS) is a rare disease with approximately 0.7 to 2.4 new cases per 1 million per year.1 Osteoporosis and osteopenia are typical comorbidities of patients with endogenous and exogenous CS. Depending on the study, 60% to 80% of patients have evidence for a reduced bone mineral density2 characteristically affecting the entire skeleton.3 About 5% of all cases of secondary osteoporosis are caused by hypercortisolism.4 However, data from prospective, well‐powered studies are rare, and few risk factors that would predict bone health have been identified so far. Guidelines for the management of osteoporosis due to endogenous CS are still missing.5 In terms of risk assessment, the subtype of CS does not seem to influence osteoporosis risk,6 whereas the morning cortisol levels are negatively correlated with lumbar bone mineral density.6 The duration of endogenous Cushing’s syndrome (or the duration of exogenous replacement therapy after successful surgery) obviously affects bone mineral density.7 Whether the T‐score is the best predictor for fracture risk is not quite clear.2
Another area of uncertainty is the natural course of osteoporosis and bone turnover markers once the diagnosis of Cushing’s syndrome has been established. A number of studies have addressed this topic, but the interpretation of the results is hampered because of limited patient numbers, concomitant osteoanabolic treatment, or both.8–10 In‐depth insight on bone remodeling in CS might come from bone turnover marker studies. For example, the bone formation marker osteocalcin is suppressed in untreated CS,3 a consistent observation making it useful as a diagnostic marker for CS.2
Based on the paucity of data, the lack of evidence for treatment guidelines, and the pressing open questions regarding risk assessment and management of osteoporosis, we performed a sufficiently powered study to analyze the natural course of bone turnover and bone mineral density in a monocentric cohort of patients with endogenous Cushing’s syndrome. To the best of our knowledge, this is the first such study, and the data obtained will be instrumental for clinicians who care for patients with Cushing’s syndrome.
Materials and Methods
Patients
This study was performed as part of the prospective German Cushing registry, which has included 450 consecutive patients referred to our department for suspected CS since 2012. Structure and general characteristics of the registry have been described in detail previously.11–14 All patients included in the registry underwent a standardized biochemical screening and clinical examination at time of diagnosis and a yearly follow‐up after treatment to treat comorbidities and diagnose recurrence of the disease early.
In all patients, standard screening for CS with a 1 mg low‐dose overnight dexamethasone suppression test (LDDST), collection of 24‐hour urine (UFC), and sampling of midnight salivary cortisol were performed. When the diagnosis of CS was confirmed, further subtyping was based on plasma adrenocorticotropic hormone (ACTH), corticotropin‐releasing hormone (CRH) test, high‐dose dexamethasone suppression test, imaging, and inferior petrosal sinus sampling (in case of ACTH dependence). Final diagnosis was CS in 156 patients and exclusion of CS in the remaining 294 patients. Patients with excluded CS were a quite heterogenic group with lead symptoms such as obesity (73%), arterial hypertension (50%), or hirsutism (33%). Final diagnoses in these subjects were metabolic syndrome, polycystic ovary syndrome (PCOS), obesity, depression, or primary hyperaldosteronism. Patient selection is shown in Fig. 1.
Patient selection. *Very young age; patient conducted densitometry in a different clinic/outpatient clinic; patient refused densitometry. CS = Cushing’s syndrome; BMD = bone mineral density; BMI = body mass index. Bold text indicates actual cohort of the study.
In our analysis, we excluded patients for whom no densitometry data were available (n = 63) and patients receiving pharmacologic treatment for osteoporosis following diagnosis (n = 4). Densitometry data were not available for multiple reasons (very young age, external densitometry in a different clinic, missing consent to perform densitometry).
We matched the remaining 89 patients with 71 controls subjects selected from those subjects in whom CS was excluded. Matching was done according to sex, age, and body mass index (BMI). None of the patients and controls received specific osteoanabolic or antiresorptive treatment, but 47% of patients with CS received vitamin D supplementation after remission. At time of diagnosis, 11% of controls and 17% of patients with CS received vitamin D supplementation.
Methods
In patients with confirmed CS, a bone mineral densitometry was conducted. Bone mineral density (BMD) was determined at the lumbar spine and the femur (neck and total femur).
If a reduced bone mineral density was diagnosed, a follow‐up densitometry was performed 2 years after surgery. If bone mineral density was normal initially or during follow‐up, only one further densitometry was performed 2 or 3 years after initial diagnosis. An improvement or decrease of bone mineral density was defined according to the least significant change (LSC = 2.8 × 1.8%).15 Accordingly, an alteration of more than 5.04% of BMD was rated as significant. A detailed fracture history was taken and X‐ray of the spine was performed when clinical suspicion for fractures was high.
In all patients, blood samples (serum and plasma) were taken at time of diagnosis and also 1 and 2 years after successful transsphenoidal surgery or adrenalectomy. Blood was taken in the fasting state between 8:00 and 10:00 a.m. Samples were centrifuged within 20 minutes at 4°C and stored at −80° until assayed. Three bone formation markers and two bone resorption markers were measured: osteocalcin, intact procollagen I‐N‐propeptide (PINP), and bone alkaline phosphatase (BAP) as bone formation markers, and CrossLaps (CTX‐I) and tartrate‐resistant acid phosphatase (5b TrAcP5b) as bone resorption marker, on basis of published data demonstrating their usefulness in CS and primary osteoporosis.2, 16
Samples were measured at the Endocrine Laboratory of the Department of Internal Medicine IV on the iSYS automated analyzer (IDS‐iSYS, Boldon, UK) by well‐validated assays.17, 18 Published, method‐specific reference intervals are available from a large healthy population.19, 20 For the determination of osteocalcin, an N‐MID assay was used, as pre‐analytics are less critical in this assay.21 TrAcp 5b is a new marker, which, in contrast to CTX‐1, can also reliably be measured in the non‐fasting state.22
Statistical analysis
In a priori power analysis, we calculated that a total sample size of 102 would be sufficient to identify significant differences between groups, assuming a medium effect size (0.5), a power of 1 – β = 0.80 and a type I error of α = 0.05, with 51 subjects having Cushing’s syndrome and 51 subjects being control subjects after excluding Cushing’s syndrome.
For statistical analysis, SPSS 25 (IBM Corp., Armonk, NY, USA) was used. Clinical characteristics are shown as mean and standard deviation when data is normal distributed; otherwise as median and ranges. Because of the lack of normal distribution of bone turnover markers, nonparametric tests were used to test differences between groups. Differences between bone turnover markers at different times were tested by Friedman test. Multiple regression analysis was used to investigate differences between CS and the control group regarding bone turnover markers adjusted for sex, age, and BMI. Any p values < 0.05 were considered to indicate statistical significance.
Results
Patient characteristics
The clinical and biochemical characteristics of the patient sample are summarized in Table 1. Sixty‐five percent of patients had pituitary CS, 28% adrenal, and 7% suffered from ectopic CS. Patients and controls were well‐matched regarding sex, age, and vitamin D levels and supplementation, but differed in terms of diabetes prevalence.
Table 1. Clinical and Biochemical Baseline Characteristics of Patients with Cushing’s Syndrome (CS) and Control Subjects in Whom CS Has Been Excluded
CS at time of diagnosis (n = 89)
CS excluded (n = 71)
p Value
Sex
66 women (74%), 23 men (26%)
53 women (75%), 18 men (25%)
0.94
Age (years)
44 ± 13
43 ± 14
0.56
BMI
30 ± 7
31 ± 6
0.11
Vitamin D (ng/mL)
24 ± 10
24 ± 12
0.59
Vitamin D supplementation
17%
11%
0.37
Diabetes mellitus
30% (26)
11% (7)
0.007
Morning serum cortisol (μg/dL)
18 (11.7–24.9)
8.4 (5.9–11.6)
≤0.001
LDDST (μg/dL)
14.7 (7.7–23.7)
1.0 (0.8–1.2)
≤0.001
UFC (μg/24 h)
587 (331–843)
140 (78–216)
≤0.001
ACTH (pg/mL)
47 (9–76)
13 (9–18)
≤0.001
Late‐night salivary cortisol (ng/mL)
7.9 (3.3–11.8)
1.2 (0.6–1.8)
≤0.001
Bone turnover markers
Osteocalcin (ng/mL)
8 (5–13)
13 (10–17)
<0.001
PINP (ng/mL)
35 (29–62)
52 (35–73)
0.025
BAP (μg/L)
23 (16–31)
17 (14–24)
0.006
CTX‐I (ng/mL)
0.28 (0.17–0.42)
0.23 (0.12–0.32)
0.033
TrAcP (U/L)
2.3 (1.7–3.4)
1.9 (1.3–2.4)
0.009
Date are shown as mean ± standard deviation or median and ranges.
At time of diagnosis, the mean levels of bone formation markers osteocalcin and intact PINP were significantly decreased compared with the controls, and the bone formation marker bone alkaline phosphatase was increased (Table 1; Fig. 2). Both bone degradation markers CTX and TrAcP were increased (Table 1). Taken together, this demonstrates increased bone resorption and decreased bone formation in florid CS. Results of multiple linear regression analysis comparing Cushing’s syndrome patients and controls are shown in Table 2. Bone markers were similar in patients with a reduced bone mass versus those with a normal bone mass (data not shown).
Bone turnover markers and bone mineral density at baseline and 1 and 2 years after remission. Boxplot = median and ranges of bone turnover marker in patients with Cushing’s syndrome.Gray box = median and ranges of bone turnover markers in the control group.PINP = procollagen I‐N‐propeptide; BAP = bone alkaline phosphatase; TrAcP = tartrate‐resistant acid phosphatase; CTX‐I = CrossLaps.
Table 2. Results of Multiple Linear Regression Analysis Comparing Cushing’s Syndrome Patients Versus Controls
Dependent variable
Standardized regression coefficient and p value for group variable
Overall, bone mineral density was decreased with an average lowest T‐score of −1.4 (±1.1). BMD was significantly lower (p = 0.001) at the femoral neck (T‐score = −0.9 ± 1.0) and the spine (T‐score = −1.0 ± 1.5) compared with the total femur (T‐score = −0.5 ± 1.2). Twenty‐eight patients (32%) had a normal bone mineral density, 46 (52%) osteopenia, and the other 15 patients (17%) osteoporosis with a T‐score lower than −2.5.
Seventeen of the patients (19%) had a history of low‐trauma osteoporotic fractures (9 vertebral fractures, 8 nonvertebral fractures). The fractures took place shortly before diagnosis (58%) or more than 2 years before diagnosis of the CS (42%). Patients with osteoporotic fractures had a significantly lower T‐score than patients without fractures (T‐score = −1.9 ± 0.8 versus −1.3 ± 1.1, p = 0.03) but did not differ in the values of the bone turnover markers or standard biochemical screening. Subtype, age, or BMI also did not differ between groups. However, men were significantly at higher risk of having fractures than women (35% of men had fractures versus 14% of women, p = 0.03). Both severity of hypercortisolism and duration of CS did not contribute to fractures rates (data not shown), but UFC was significantly higher in patients with a T‐score lower than −1.5 (Table 3).
Table 3. Biochemical Markers in Patients With Cushing’s Syndrome With a T‐Score Lower Than −1.5 and Above −1.5 Shown in Median and Ranges
Surgical tumor resection leading to biochemical remission of CS resulted in a strong increase of bone formation markers tested at 1‐year follow‐up (Table 4; Fig. 2A, B). After 2 years, the markers had decreased slightly but remained elevated. Bone resorption markers were mildly increased at time of diagnosis, increased further at 1 year post‐surgery, and returned almost to normal levels at 2 years (Table 4; Fig. 2D, E). A follow‐up bone densitometry conducted in 40 patients showed a parallel increase of the T‐score of 0.6 ± 0.8 (Fig. 2F). In particular, BMD of the spine improved (Table 5).
Table 4. Bone Turnover Markers and Bone Mass in Patients With Cushing’s Syndrome at Time of Diagnosis and During 2 Years of Follow‐Up
Table 5. Overview: T‐Scores, Z‐Scores, and BMD Values With Percent Changes (Mean and Standard Deviation)
Variable
CS at time of diagnosis
CS 2 years in remission
p Values, percent changes (↑)
Femoral neck
T‐score femoral neck
−0.81 ± 0.97
−0.59 ± 0.86
0.06
Z‐score femoral neck
−0.59 ± 0.98
−0.28 ± 0.79
0.02
BMD (g/cm2) femoral neck
0.91 ± 0.12
0.95 ± 0.12
0.16; 4% ↑
Femur
T‐score femur
−0.49 ± 1.11
−0.42 ± 1.04
0.67
Z‐score femur
−0.40 ± 1.04
−0.37 ± 0.85
0.31
BMD (g/cm2) femur
0.95 ± 0.15
0.97 ± 0.14
0.77, 2% ↑
Spine
T‐score spine
−0.96 ± 1.56
−0.55 ± 1.25
<0.001
Z‐score spine
−0.85 ± 1.53
−0.58 ± 1.14
<0.001
BMD (g/cm2) spine
1.08 ± 0.22
1.13 ± 0.15
0.001, 0.6% ↑
BMD = bone mineral density; CS = Cushing’s syndrome. Bold numbers indicate statistical significance.
In 78% of patients, bone mineral density improved after 2 years; in 45% of patients, T‐score improved more than 0.5. No clinical fractures occurred after successful treatment of the CS. There was no significant correlation between improvement of bone mineral density and any of the bone turnover markers.
Discussion
This study investigated for the first time to our knowledge a panel of bone formation and resorption markers in a large cohort of patients with CS over the long term. The unique and comprehensive data show that initially bone metabolism is characterized by decreased bone formation and increased bone resorption, in line with the classical action of glucocorticoids. Successful treatment of endogenous Cushing’s syndrome leads to a strong activation of bone turnover, characterized by increased bone formation and bone resorption, a process that is continuous beyond year 2 after remission of CS, although at a reduced activity level. In parallel, bone mineral density increases in the majority of patients. Although 19% had low‐trauma fractures at baseline, none of the subjects experienced clinical fractures during follow‐up. In summary, these data give new insight into bone healing after remission of CS. They strongly suggest that an observational approach to the bone phenotype is justified as long as remission from CS is secured.
Reversibility of osteoporosis and bone turnover markers
Although established in osteoporosis research, bone turnover markers are not measured on a routine basis in patients with CS. However, it is a consistent result from different studies that osteocalcin is depressed in patients with CS. In fact, this finding is so reliable that it was even suggested to use osteocalcin in the diagnosis of CS.2 P1NP and procollagen carboxy‐terminal propeptide (P1CP) have also been studied in several studies, with contradictory results.23 In a retrospective study with 21 patients with CS, it was shown that osteocalcin is depressed; this applies also for PINP, whereas CTX is increased.24
Some studies already have focused on the reversibility of osteoporosis after treatment of CS. In the majority of patients, bone mineral density increased within 2 years after successful treatment8–10, 25 Hermus and colleagues showed in a study with 20 patients that bone mineral density did not change 3 or 6 months after surgery but increased thereafter in almost all patients.8 In a study with 68 patients, the patients were followed up for 4 years. Bone mineral density increased over lumbar spine and femur but decreased at the forearm.25 The authors concluded that bone minerals were redistributed from the peripheral to the axial skeleton.
In our study, bone mineral density also improved in the majority of patients but remained reduced in some. We did not find any difference in bone turnover markers between patients with improvement and without improvement.
Current treatment guidelines and treatment suggestions
As observed in our study, bone formation markers increase significantly after surgical cure, whereas bone degradation markers are mildly elevated at baseline and increase slightly at 1 year, returning within the normal range at 2 years. So far, there is no international guideline on the treatment of osteoporosis induced by endogenous CS and very few controlled interventional studies. In an opinion paper, Scillitani and colleagues recommended to treat all patients with vitamin D and calcium but not with bisphosphonates.5 In a randomized open‐label study by Di Somma and colleagues,26 39 patients (18 patients with active CS and 21 patients with CS in remission) received alendronate or no medication. Patients with active CS also received ketoconazole to control hypercortisolism. Bone mineral density improved and serum levels of osteocalcin increased in patients who received alendronate to a greater extent than those receiving no alendronate.
In a small study by the same research group,27 15 patients with CS (9 adolescent patients and 6 adults) were observed for 2 years after successful treatment, showing that osteocalcin levels and bone mineral density increased significantly.
Strengths and limitations
Although this study has several strengths, including the large prospective design and measuring a panel of bone formation and resorption markers, there are a few limitations. Some asymptomatic fractures may have been overlooked because an X‐ray was not taken systematically in each patient. Furthermore, a follow‐up bone densitometry was not available for all patients. Additionally, patients in the control group suffered from diabetes, overweight, arterial hypertension, or other diseases.
Novel aspects and outlook
This study analyzes for the first time in a comprehensive way bone turnover markers during the course of CS. The data show that cure from CS leads to increases in bone remodeling and bone mineral density, in line with spontaneous “bone healing.” Our data support a wait‐and‐watch strategy despite a high endogenous risk for additional fractures, based on the baseline assessment. This observation will influence future therapeutic strategies in patients with CS.
Our data suggest that the phase immediately after remission from CS is characterized by a high rate of bone turnover, resulting in a spontaneous net increase in bone mineral density in the majority of patients. Both bone attachment and bone degradation markers increase significantly, leading to an increase in bone mass and to a reduced risk of osteoporotic fractures. This unconstrained increase in bone formation markers after remission should be considered before specific therapy is initiated. Our data do not favor specific pharmacologic interventions with bisphosphonates or denosumab during this phase of remodeling because they may disrupt the osteoblast‐mediated bone mass increase.
Disclosures
All authors state that they have no conflicts of interest.
Acknowledgments
This work is part of the German Cushing’s Registry CUSTODES and has been supported by a grant from the Else Kröner‐Fresenius Stiftung to MR (2012_A103 and 2015_A228). Additionally, AR, FB, and MR received funding by the Deutsche Forschungsgemeinschaft (CRC/TRR 205/1 “The Adrenal Gland”). Furthermore, funds for this project were provided by the Verein zur Förderung von Wissenschaft und Forschung an der Medizinischen Fakultät der Ludwig‐Maximilians‐Universität München eV to LB.
The data are stored on the following repository: https://figshare.com/ and will be made accessible after publication of the article.
Authors’ roles: LB served as the principal investigator in this work and was responsible for the study conception and design, the analysis and interpretation of the data, and the drafting of the manuscript. JF, SZ, AO, AR, GR and SB contributed to the collection and analysis of the data. MS, FB, MD, MB substantially contributed to the interpretation of the data and the drafting of the manuscript. RS contributed to the conceptual design of the study, the interpretation of data and the revision of the paper. MR contributed to the conceptual design of the study, the collection, analysis and interpretation of data, and the drafting and revision of the paper. All authors contributed to the critical revision of the manuscript and approved the final version for publication.
In patients with Cushing’s disease, removing the pituitary tumor via an endoscopic transsphenoidal surgery (TSS) leads to better remission rates than microscopic TSS, according to new research.
But regardless of surgical approach, plasma cortisol levels one day after surgery are predictive of remission, researchers found.
Because it improves visualization and accessibility, endoscopic TSS has been gaining popularity over microscopic TSS to remove pituitary tumors in Cushing’s disease patients. Yet, although this surgery has been associated with high remission rates, whether it outperforms microscopic surgery and determining the factors affecting long-term outcomes may further ease disease recurrence after TSS.
A team with the All India Institute of Medical Sciences addressed this topic in 104 patients who underwent surgery from January 2009 to June 2017. Among these patients, 47 underwent microscopic surgery and 55 endoscopic surgery. At presentation, their ages ranged from 9 to 55 (mean age of 28). Also, patients had been experiencing Cushing’s symptoms over a mean duration of 24 months.
Eighty-seven patients showed weight gain. Hypertension (high blood pressure) and diabetes mellitus were among the most common co-morbidities, found in 76 and 33 patients, respectively. Nineteen patients had osteoporosis and 12 osteopenia, which refers to lower-than-normal bone mineral density.
As assessed with magnetic resonance imaging, 68 patients had a microadenoma (a tumor diameter smaller than one centimeter) and 27 had a macroadenoma (a tumor one centimeter or larger). Only two patients had an invasive pituitary adenoma.
Two patients with larger tumors were operated on transcranially (through the skull). The surgery resulted in total tumor removal in 90 cases (86.5%). A blood loss greater than 100 milliliter was more common with endoscopic than with microscopic TSS.
Ten patients developed transient diabetes inspidus, two experienced seizures after surgery, and six of nine patients with macroadenoma and visual deterioration experienced vision improvements after TSS.
The incidence of intraoperative leak of cerebrospinal fluid — the liquid surrounding the brain and spinal cord — was 23.2%, while that of post-operative leak was 7.7% and was more common in microadenoma than macroadenoma surgery (9.8% vs. 5.0%).
Seventeen patients were lost to follow-up and two died due to metabolic complications and infections. The average follow-up was shorter for endoscopic than with microscopic surgery (18 months vs. 35 months).
Among the remaining 85 cases, 65 (76.5%) experienced remission, as defined by a morning cortisol level under 5.0 μg/dL, restored circadian rhythm (the body’s internal clock, typically impaired in Cushing’s patients), and suppression of serum cortisol to below 2 μg/dl after overnight dexamethasone suppression test.
The remission rate was 54.5% in pediatric patients and was higher with endoscopic than with microscopic TSS (88.2% vs. 56.6%). Also, patients with microadenoma showed a trend toward more frequent remission than those with macroadenoma (73.2% vs. 64.3%).
Ten of the remaining 20 patients experienced disease recurrence up to 28 months after surgery. Sixteen cases revealed signs of hypopituitarism, or pituitary insufficiency, which were managed with replacement therapy.
A subsequent analysis found that morning cortisol level on day one after surgery was the only significant predictor of remission. Specifically, a one-unit increase in cortisol lowered the likelihood of remission by 7%. A cortisol level lower than 10.7 μgm/dl was calculated as predicting remission.
Overall, the study showed that “postoperative plasma cortisol level is a strong independent predictor of remission,” the researchers wrote, and that “remission provided by endoscopy is significantly better than microscopic approach.”
Metoclopramide, a gastrointestinal medicine, can increase cortisol levels after unilateral adrenalectomy — the surgical removal of one adrenal gland — and conceal adrenal insufficiency in bilateral macronodular adrenal hyperplasia (BMAH) patients, a case report suggests.
BMAH is a subtype of adrenal Cushing’s syndrome, characterized by the formation of nodules and enlargement of both adrenal glands.
In this condition, the production of cortisol does not depend on adrenocorticotropic hormone (ACTH) stimulation, as usually is the case. Instead, cortisol production is triggered by a variety of stimuli, such as maintaining an upright posture, eating mixed meals — those that contain fats, proteins, and carbohydrates — or exposure to certain substances.
A possible treatment for this condition is unilateral adrenalectomy. However, after the procedure, some patients cannot produce adequate amounts of cortisol. That makes it important for clinicians to closely monitor the changes in cortisol levels after surgery.
Metoclopramide, a medicine that alleviates gastrointestinal symptoms and is often used during the postoperative period, has been reported to increase the cortisol levels of BMAH patients. However, the effects of metoclopramide on BMAH patients who underwent unilateral adrenalectomy are not clear.
Researchers in Japan described the case of a 61-year-old postmenopausal woman whose levels of cortisol remained high after surgery due to metoclopramide ingestion.
The patient was first examined because she had experienced high blood pressure, abnormal lipid levels in the blood, and osteoporosis for ten years. She also was pre-obese.
She was given medication to control blood pressure with no results. The lab tests showed high serum cortisol and undetectable levels of ACTH, suggesting adrenal Cushing’s syndrome.
Patients who have increased cortisol levels, but low levels of ACTH, often have poor communication between the hypothalamus, the pituitary, and the adrenal glands. These three glands — together known as the HPA axis — control the levels of cortisol in healthy people.
Imaging of the adrenal glands revealed they were both enlarged and presented nodules. The patient’s cortisol levels peaked after taking metoclopramide, and her serum cortisol varied significantly during the day while ACTH remained undetectable. These results led to the BMAH diagnosis.
The doctors performed unilateral adrenalectomy to control cortisol levels. The surgery was successful, and the doctors reduced the dose of glucocorticoid replacement therapy on day 6.
Eight days after the surgery, however, the patient showed decreased levels of fasting serum cortisol, which indicated adrenal insufficiency — when the adrenal glands are unable to produce enough cortisol.
The doctors noticed that metoclopramide was causing an increase in serum cortisol levels, which made them appear normal and masked the adrenal insufficiency.
They stopped metoclopramide treatment and started replacement therapy (hydrocortisone) to control the adrenal insufficiency. The patient was discharged 10 days after the surgery.
The serum cortisol levels were monitored on days 72 and 109 after surgery, and they remained lower than average. Therefore she could not stop hydrocortisone treatment.
The levels of ACTH remained undetectable, suggesting that the communication between the HPA axis had not been restored.
“Habitual use of metoclopramide might suppress the hypothalamus and pituitary via negative feedback due to cortisol excess, and lead to a delayed recovery of the HPA axis,” the researchers said.
Meanwhile, the patient’s weight decreased, and high blood pressure was controlled.
“Detailed surveillance of aberrant cortisol secretion responses on a challenge with exogenous stimuli […] is clinically important in BMAH patients,” the study concluded. “Caution is thus required for assessing the actual status of the HPA axis.”