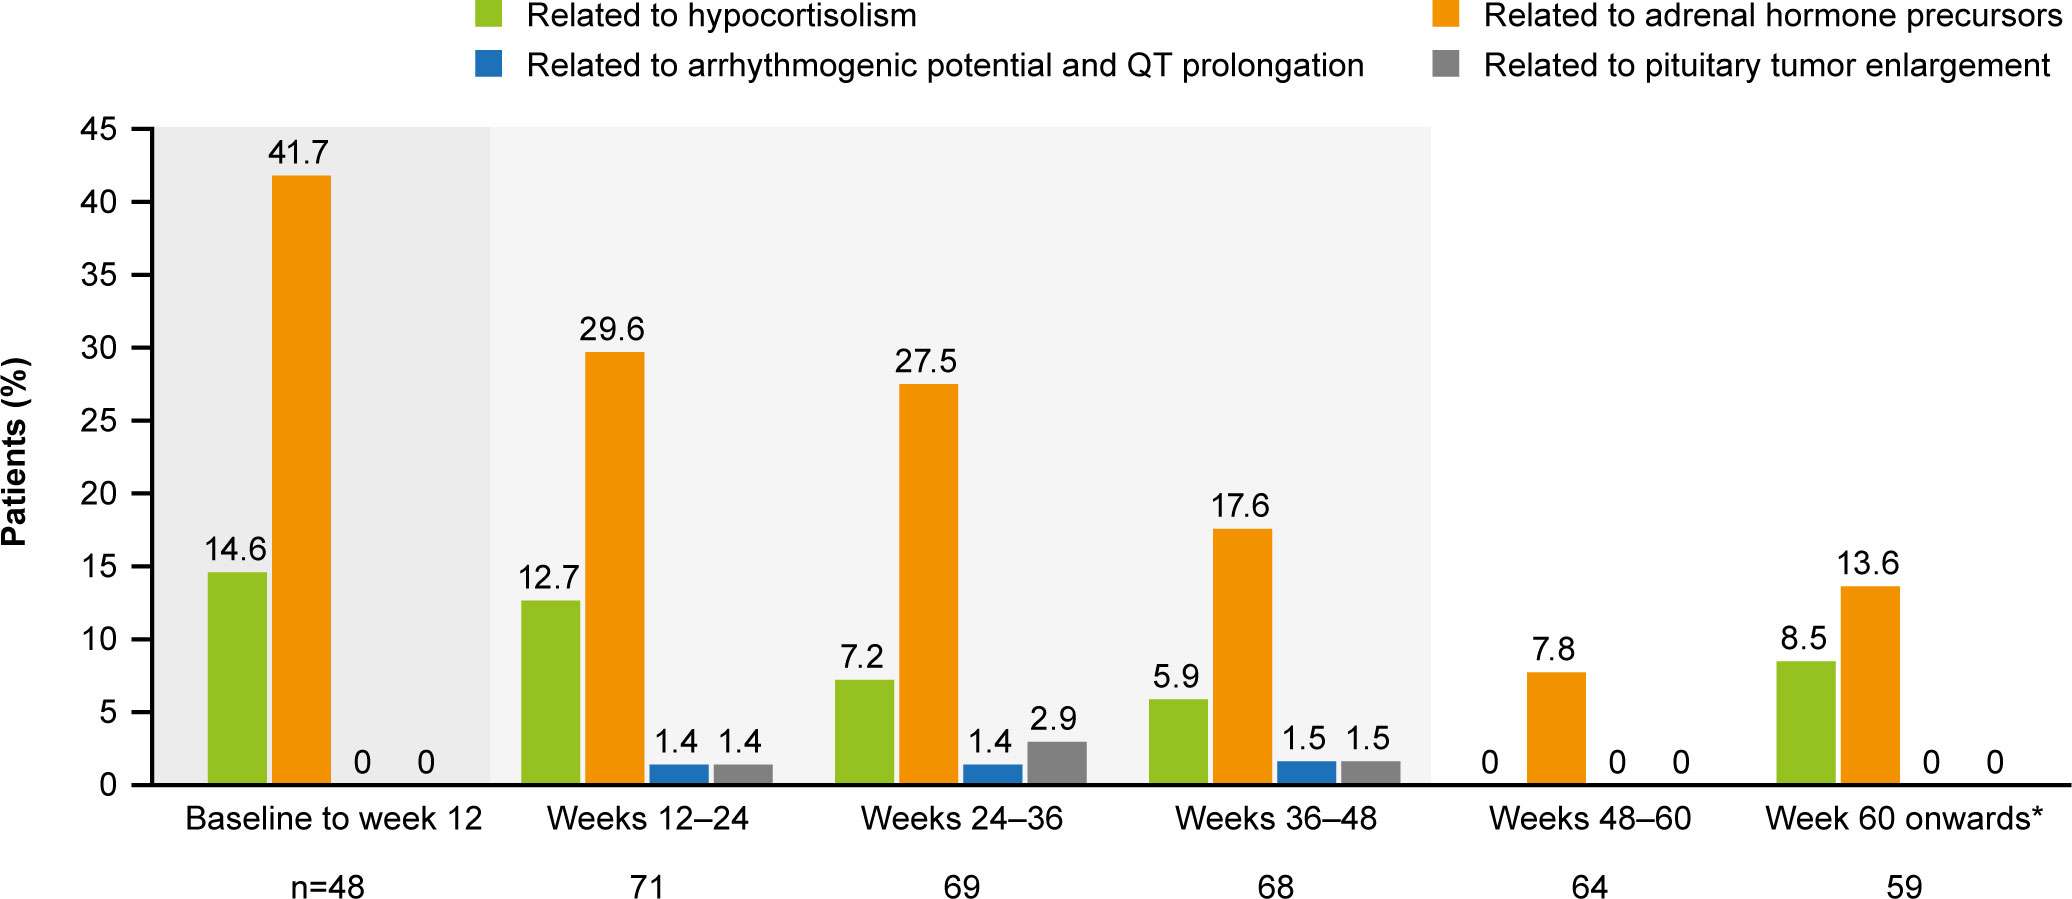
Dexamethasone Suppression for 18F-FDG PET/CT to Localize ACTH-Secreting Pituitary Tumors

Abstract

Background

18Fluorine-Fluoro-deoxy-glucose (18F-FDG) positron emission tomography (PET) is widely used for diagnosing various malignant tumors and evaluating metabolic activities. Although the usefulness of 18F-FDG PET has been reported in several endocrine diseases, studies on pituitary disease are extremely limited. To evaluate whether dexamethasone (DEX) suppression can improve 18F-FDG PET for the localization of adrenocorticotropic hormone-secreting adenomas in the pituitary gland in Cushing’s disease (CD).

Methods

We included 22 patients with CD who underwent PET imaging before and after DEX administration. We compared the success rates of PET before and after DEX suppression, magnetic resonance imaging (MRI), and bilateral inferior petrosal sinus sampling (BIPSS). We determined the final locations of adenomas based on intraoperative multiple-staged resection and tumor tissue identification using frozen sections. Standardized uptake value (SUV) were analyzed to confirm the change of intensity of adenomas on PET.

Results

Twenty-two patients were included (age at diagnosis: 37 [13–56] years), and most were women (90.91%). Pituitary adenomas compared to normal pituitaries showed increased maximum SUV after DEX suppression but without statistical significance (1.13 versus. 1.21, z=-0.765, P = 0.444). After DEX suppression, the mean and maximum SUV of adenomas showed a positive correlation with nadir cortisol levels in high-dose DEX suppression test (Rho = 0.554, P = 0.007 and Rho = 0.503, P = 0.017, respectively). In reference sites, mean SUV of cerebellum was significantly decreased (7.65 vs. 6.40, P = 0.006*), but those of the thalamus and gray matter was increased after DEX suppression (thalamus, 8.70 vs. 11.20, P = 0.010*; gray matter, 6.25 vs. 7.95, P = 0.010*).

Conclusion

DEX suppression did not improve 18F-FDG PET/CT localization in patients with CD.

Introduction

Cushing’s disease (CD) is a rare endocrine disease that results from chronic exposure to high cortisol levels because of adrenocorticotropic hormone (ACTH)-secreting pituitary tumors and is associated with increased morbidity and mortality. It represents approximately 80% of all cases of endogenous hypercortisolism [1,2,3]. Accurate localization of primary lesions in CD leads to improved remission rates and reduced adverse events following surgery [45]. A biochemical remission rate of 90–100% has been reported when tumors are localized before surgery, but it can decrease to 50–60% when surgery is performed when the location of the tumor is unknown in patients with CD [6,7,8].

Currently, magnetic resonance imaging (MRI) is the gold standard for detecting pituitary adenomas. Nevertheless, modern MRI modalities, including dynamic or volumetric sequences, can reliably detect corticotrophic adenomas in 50–90% cases of CD [9,10,11,12]. This indicates that complementary imaging strategies are required to improve the localization of primary lesions in CD.

One of the most characteristic features of corticotrophic adenomas is a compromised response to negative glucocorticoid feedback, which defines glucocorticoid resistance [13]. ACTH activates the adrenal glands to synthesize and secrete cortisol, which in turn negatively modulates the release of ACTH from the pituitary gland and corticotrophin-releasing hormone (CRH) and vasopressin from the hypothalamus [1]. In CD, a corticotrophic tumor is only partially sensitive to the inhibitory feedback exerted by cortisol, which in turn is not regulating its own production and secretion of ACTH, resulting in both excessive ACTH and cortisol levels. Glucocorticoid resistance is caused by multiple factors including glucocorticoid receptor availability, splice variant expression and affinity, and imbalanced glucocorticoid receptor signaling [1415].

Radioactive 18 F-fluorodeoxyglucose positron emission tomography/computed tomography (18F-FDG PET/CT) often demonstrates increased fluorodeoxyglucose (FDG) uptake in nonfunctioning and hormone-secreting pituitary adenomas [16,17,18]. In large observational studies of whole-body 18F-FDG positron emission tomography (PET) scans, incidental sellar 18F-FDG uptake was found in < 1% of cases, and this sign is highly specific for pituitary adenomas [19,20,21]. 18F-FDG PET imaging can detect up to 40% of corticotropinomas, some as small as 3 mm, and the rate of PET detection of corticotropinomas can be increased by CRH stimulation [922].

Here, we evaluated whether DEX suppression could improve the localization of ACTH-secreting adenomas using 18F-FDG PET/CT in patients with CD. The rationale for this is as follows. FDG uptake of corticotrophic adenomas is less suppressed than that of normal pituitary glands after DEX suppression due to glucocorticosteroid resistance.

Materials and methods

Study design and population

In this retrospective cohort study, we enrolled all patients with CD who underwent two rounds of 18F-FDG-PET/CT before and after 8-mg DEX suppression and pituitary MRI before surgery. Total 22 patients were included in this study, of which thirteen had bilateral inferior petrosal sinus sampling (BIPSS) results. All patients were diagnosed with CD by staff of the Department of Endocrinology and/or Neurosurgery at Severance Hospital between 2014 and 2015. The diagnosis of CD was confirmed based on biochemical test results, including the cortisol, 24-hour urine free cortisol (24 h UFC), and serum ACTH levels, overnight dexamethasone suppression test (ON DST) results, and high-dose dexamethasone suppression test (HD DST) results.

Immediate remission was defined as hypocortisolism (serum cortisol level < 1.8 µg/dL) within the first 7 days after surgery. Delayed remission was defined as the achievement of hypocortisolism within 6 months, although immediate remission was not confirmed. If patients showed elevated postoperative cortisol levels and needed additional treatment within 6 months after surgery, we defined them as having persistent disease [23,24,25].

A serum cortisol concentration > 1.8 µg/dL for 8 h in the morning after 1 mg of DEX was given at midnight was considered to be a positive result in the ON DST [26]. Suppression of the serum cortisol level by > 50% for 6 h after 2 mg of DEX was administered for 2 days was defined as the suppression on the HD DST [26]. The final diagnosis was confirmed using surgical pathology and clinical follow-up.

Endocrinological evaluation

All laboratory analyses were performed at the Department of Laboratory Medicine, Severance Hospital. Preoperative cortisol and 24 h UFC were measured by chemiluminescence immunoassay using an automated UniCel DXC880i Synchron analyzer (Beckman Coulter, Pasadena, CA, USA; coefficient of variation [CV] ± 15 nmol/L at < 100 nmol/L and ± 15% at > 100 nmol/L). Preoperative ACTH levels were analyzed by electrochemiluminescence immunoassay using the Roche Cobas 6000 analyzer (Roche Diagnostics GmbH, Mannheim, Germany; CV ± 2.0 pmol/L at < 20 pmol/L and ± 10% at > 20 pmol/L).

The serum cortisol concentration at 8:00 am the following day after 1 mg of DEX was administered at midnight was considered positive on the ON DST. We determined the result as “suppression” by the cortisol level of < 1.8 µg/dL. A serum cortisol level suppressed by > 50% of the original level after 6 hourly administrations of 2 mg of DEX for 48 h was defined as suppression on the HD DST [27].

18F-FDG PET/CT evaluation

PET/CT was performed using a GEADVANCE PET scanner (GE, Milwaukee, WI, USA) after the intravenous injection of 7–9 mCi of 18F-FDG. All patients fasted for at least 6 h before the test. Emission scanning was continued for 15 min (4.25-mm axial spatial resolution, 4.8-mm transaxial spatial resolution). Transmission scans were performed for 8 min using triple Ge-68 rod sources to correct attenuation. Gathered data were reconstructed in a 128 × 128 × 35 matrix with a pixel size of 1.95 × 1.95 × 4.25 mm by means of a filtered back-projection algorithm employing a transaxial 8.5-mm Hanning filter and 8.5-mm axial ramp filter. Two specialists independently interpreted the encoded baseline PET images, and after a two-week period, they interpreted the encoded post DEX suppression PET images. Each specialist was blinded to MRI imaging, clinical characteristics, and surgical outcomes of these subjects. Each was tasked with determining whether the PET image indicated a “negative” or “positive” result for pituitary adenoma and its location on a high-resolution computer screen.

The scan after DEX suppression was performed 24 h after the oral administration of 8 mg of DEX using the same procedures as for the baseline PET/CT scan.

18F-FDG uptake analysis

The Region of interest (ROI) was drawn using MIM software (version 6.5, Software INc., Cleveland, OH, USA) (Fig. 1). PET images were reviewed by experienced by an experienced specialist. The pituitary gland was identified and a circular ROI was drawn. A fixed ROI with a 3-mm diameter was used for all patients. The ROI was placed on the lesion with the highest FDG uptake. If there was no significantly increased FDG uptake, the same sized circular ROI was drawn on the suspected adenoma location. For the normal pituitary gland, the same sized 3 mm ROI was used.

Fig. 1

figure 1

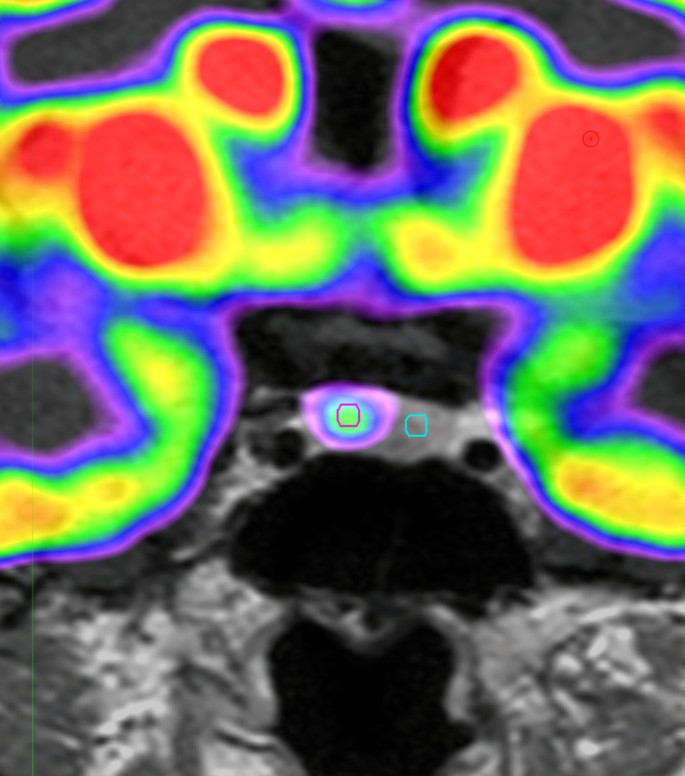
Images of ROI for pituitary adenoma on18F-FDG PET scan

Example of ROI definition in pituitary adenomas of 18F-FDG PET scan of the patients with CD. We draw the fixed circular ROI with a 3-mm diameter for pituitary adenomas (red circle) and normal pituitary gland (green circle)

ROI, Reason of interest; 18F-FDG PET, 18 F-fluorodeoxyglucose positron emission tomography; CD, Cushing disease

The mean standardized uptake value (SUVmean) and maximum SUV (SUVmax) for pituitary adenomas and normal pituitary glands were automatically measured using MIM, version 6.5 (Software Inc., Cleveland, OH, USA). The standardized uptake value (SUV) of the volume of interest was calculated as follows: (decoy-corrected activity (kBq) / volume (mL)) / (injected dose (kBq) / body weight (g)).

SUVmean and SUVmax of pituitary adenomas were divided into the SUVmean of normal pituitary glands for adjustment. We used the ratio of SUVmax to SUVmean to analyze the homogeneity of the pituitary adenomas.

MRI evaluation

All patients underwent pituitary MRI with a 3.0-Tesla scanner (Achieva, Philips Medical Systems, Best, the Netherlands). Imaging protocols included T1-weighted imaging, T2-weighted imaging, and delayed gadolinium-enhanced T1-weighted imaging. The extent, location, and sizes of the pituitary tumors were reviewed based on official records determined by radiologists.

Pituitary tumors were classified based on radiological findings using MRI of the sellar and parasellar regions. Type I refers to tumors < 1 cm in diameter limited to the sella. Type II tumors extend into the suprasellar space, < 1 cm from the diaphragm. Type III includes tumors extending into the suprasellar space > 1 cm from the diaphragm or sphenoid sinus and encroaching on the internal carotid arteries. Lastly, type IV refers to adenomas with obvious invasion into the cavernous sinus, as shown on MRI, and into the medial dural wall of the cavernous sinus, as confirmed during surgery.

BIPSS

Before surgery, BIPSS was performed to confirm the cause of CD and lateralize the tumors. A catheter was placed in patients using a unilateral femoral venous approach and 3 cc of blood was collected from the peripheral (P) and both inferior petrosal sinuses (IPS) [28]. CRH at a dose of 1 µg/kg was administered, and peripheral and petrosal samples were drawn after 5 and 10 min, respectively. The catheters and sheath were removed, and the groin was compressed under pressure until venous hemostasis was achieved.

The IPS:P prolactin ratio was calculated at each time point to confirm the accuracy of the inferior petrosal venous sampling. A value of ≥1.8 was considered successful IPS catheterization. The prolactin-normalized ACTH ratio was calculated by dividing the dominant ACTH IPS:P ratio by the concurrent and ipsilateral IPS:P prolactin ratio. A value of ≥1.3 was considered diagnostic of CD. An intersinus ACTH ratio of ≥1.4 either at baseline or after stimulation was used for lateralization of the pituitary adenoma [29].

Location of the adenoma

The final assignment of the true location of the pituitary adenoma was based on intraoperative multiple stage resection and tumor tissue identification using frozen sections. Surgically identified adenomas were histologically evaluated and stained for ACTH immunoreactivity. In cases of multiple specimens obtained during the procedure, the true location of the adenoma was assigned based on the original site of the specimen containing the adenoma [30].

Statistical analysis

Data are presented as medians (ranges) or numbers (percentages). The baseline characteristics of the patients were compared using Kruskal–Wallis’ test with Dunn’s procedure for nonparametric continuous variables. Categorical variables were compared using Fisher’s exact test. Spearman’s correlation coefficients were used to determine the correlation between FDG uptake and hormone levels. Wilcoxon’s signed-rank test was used to identify changes in the SUV after DEX administration.

The interobserver agreement for image analysis was assessed using κ statistics. κ values were categorized as follows: κ < 0.20 indicated poor agreement, κ of 0.21–0.40 indicated fair agreement, κ of 0.41–0.60 indicated moderate agreement, κ of 0.61–0.80 indicated good agreement, and κ > 0.81 indicated excellent agreement [31].

Statistical significance was set at a two-sided P < 0.05. All statistical analyses were performed using SPSS software (IBM Corp., Armonk, NY, USA).

Results

Patient characteristics

We enrolled all patients with CD who underwent two rounds of the 18F-FDG PET/CT with or without DEX suppression and sellar MRI before transsphenoidal adenectomy (TSA). Twenty-two patients were included (age at diagnosis: 37 [13–56] years), and most were women (90.91%). Patients’ baseline characteristics are shown in Table 1. There were 16 microadenomas and 6 macroadenomas. Immediate remission was achieved in 81.82% of the patients and delayed remission in 13.64%; one patient showed persistent disease after TSA. The median preoperative 24 h UFC, serum ACTH, and cortisol levels were 443.35 (93.00–4452.00) µg/day, 36.16 (6.00–92.00) pg/mL, and 18.55 (6.00–40.00) µg/dL. The size of pituitary adenomas on MRI was 7.85 (2.00–28.00) mm. The Ki-67 index of 47.06% of adenomas ranged from 1 to 2, that of 35.29% was below 1, and that of 17.65% was 2 or higher. Overall, 75.00% of the adenomas were classified as Knosp grade 0, 5.00% as grade 1, 5.00% as grade 3b, and 15.00% as grade 4. In total, 77.27% (17/22) of patients had an ACTH-staining adenoma. Only one patient showed unsuppressed cortisol levels on the HD DST.

Table 1 Patients’ imaging and clinical characteristics

MRI negative but PET positive case

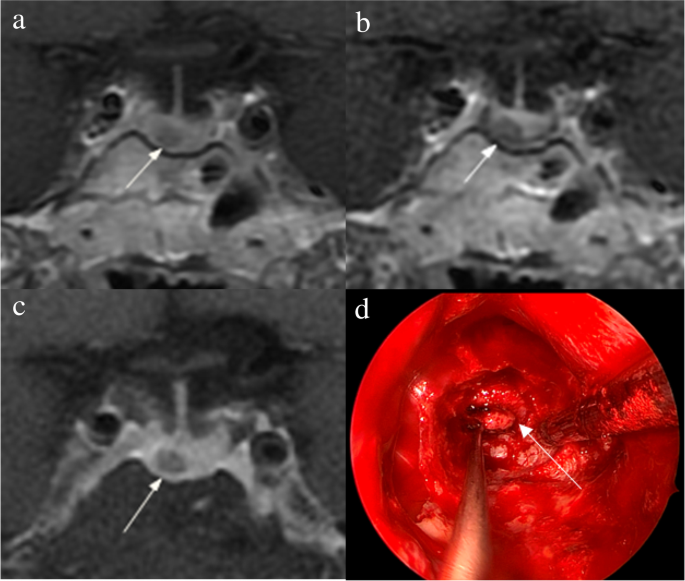
Two patients showed negative MRI results, and one of them showed FDG uptakes on both 18F-FDG PET scans at baseline and after DEX suppression. A 26-year-old man visited our hospital complaining of weight gain and was diagnosed with ACTH-dependent CD. Cortisol secretion was suppressed on the HD DST; however, sellar MRI did not reveal any suspicious lesions. BIPSS revealed a central tumor (central/peripheral ACTH level of 36.25 after CRH stimulation) lateralized to the right side of the pituitary gland. The patient underwent 18F-FDG-PET/CT before and after DEX suppression to identify the primary lesions. Baseline PET/CT showed diffused FDG uptake with an SUVmax of 1.03 at the pituitary fossa but failed to localize the tumor. After DEX treatment, focal FDG uptake with an SUVmax of 1.06 remained at the right side of the pituitary fossa, which resulted in the successful localization of the corticotrophic adenoma. The MRI and PET/CT images of this case are presented in Fig. 2A–C. During TSA, the surgeon identified solid tumor-like tissues on the right side of the pituitary gland and successfully removed them. Results of pathology and ACTH immunohistochemistry were negative, but the patient achieved immediate biochemical remission and CD-related symptoms were relieved after surgery. We followed the patient for 98 months after the surgery and confirmed that he had lived without recurrence.

Fig. 2

figure 2

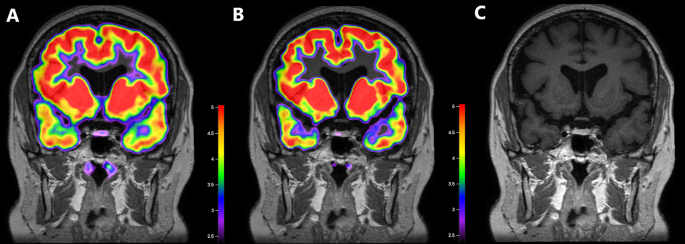
Images of a corticotroph with negative MRI but positive18 F-FDG PET/CT after DEX suppression

An MRI-negative adenoma was detected on 18F-FDG PET/CT at baseline and after DEX suppression. In this patient, the pituitary adenoma was visible on PET scans at baseline (B) and after DEX suppression (C) at the same location, as confirmed by the surgeon

A. Co-registered baseline 18F-FDG PET/CT and MRI images. Diffuse 18F-FDG uptake is detected in the pituitary fossa with an SUVmean of 0.86 and SUVmax of 1.03, but there was failure to localize the adenoma on baseline 18F-FDG PET/CT.

B. Co-registered 18F-FDG PET/CT and MRI images after DEX suppression. 18F-FDG uptake is not suppressed in the right side of the pituitary gland with an SUVmean of 1.03 and SUVmax of 1.06. 18F-FDG PET/CT after DEX suppression was successful in localizing the right-sided corticotrophic adenoma

C. MRI image. There is no suspicious lesion in the pituitary gland

ACTH, adrenocorticotropic hormone; MRI, magnetic resonance imaging; 18F-FDG, 18 F-fluorodeoxyglucose; PET/CT, positron emission tomography/computed tomography; DEX, dexamethasone; SUVmean, mean standardized uptake value; SUVmax, maximum standardized uptake value

Change of 18F-FDG uptake after DEX suppression

We included 18 pituitary adenomas that were successfully localized using PET/CT after DEX suppression, and analyzed the change of SUV for 15 adenomas, excluding outliers with SUV over 2.00. The results are presented in Fig. 3A and B. The SUVmean of adenomas did not changed after DEX suppression compared to normal pituitary glands (SUVmean of adenoma/SUVmean of normal pituitary glands: 1.13 [0.85–1.35] vs. 1.14 [0.87–1.39], z=-1.288, P = 0.198). DEX suppression increased SUVmax of adenomas compared to normal pituitary glands but without statistical significance (SUVmax of adenoma/SUVmean of normal pituitary glands: 1.13 [0.96–1.52] vs. 1.21 [0.97–1.56], z=-0.765, P = 0.444).

Fig. 3

figure 3

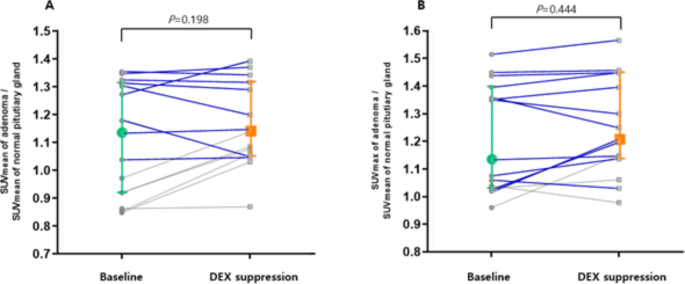
Changes in the SUVs of corticotrophs between18F-FDG PET/CT before and after DEX suppression

The SUVmean (A) and SUVmax (B) of corticotrophic adenomas are shown in this pairwise analysis. The SUVmean did not changed after DEX suppression from (z=-1.288, P = 0.198). The SUVmax of the corticotrophic adenoma increased from 1.13 to 1.21 (z=-0.765, P = 0.444). In this analysis, the SUVmean and SUVmax of pituitary adenomas were adjusted using the SUVmean of the normal pituitary gland. Colored plots and bars presented median and interquartile range in this figure. We presented the tumors with size larger than 5 mm and SUV adjusted by normal pituitary>1 for blue line

SUVmean, mean standardized uptake value; SUVmax, maximum standardized uptake value; DEX, dexamethasone; 18F-FDG, 18 F-fluorodeoxyglucose; PET/CT, positron emission tomography/computed tomography

In Fig. 3, the blue line indicates change in SUV of adenomas larger than 5 mm with higher FDG uptake than the surrounding pituitary parenchyma. For these adenomas, DEX suppression did not change the SUV (SUVmean of adenoma/SUVmean of normal pituitary glands: 1.31 [1.04–2.52] vs. 1.33 [1.05–2.38], z=-0.784, P = 0.433; SUVmax of adenoma/SUVmean of normal pituitary glands: 1.36 [1.02–2.61] vs. 1.40 [1.03–2.65], z=-1.022, P = 0.307).

The value of SUV increased in 73.33% adenomas, while the SUVmax increased in 66.67% compared with normal pituitary glands after DEX treatment.

Correlation between the hormone level and 18F-FDG uptake

Table 2 shows the results of the Spearman correlation analysis of the SUV with preoperative cortisol, ACTH, and nadir cortisol levels on the HD DST. On the baseline 18F-FDG PET scan, the SUVmax of the adenomas did not show any correlation with the levels of three hormones. The SUVmean of adenomas showed a positive correlation with nadir cortisol levels on the HD DST (P = 0.014) and preoperative ACTH levels, with marginal significance (P = 0.062). After DEX suppression, the SUVmax and SUVmean of adenomas had a positive correlation with moderate degrees of nadir cortisol on the HD DST (SUVmax: Spearman Rho = 503, P = 0.017; SUVmean: Spearman Rho = 0.554, P = 0.007).

Table 2 Correlation between FDG uptakes and hormone levels

FDG uptake of reference sites after DEX suppression

We evaluated the FDG uptake for five types of reference areas (normal pituitary gland, cerebellum, thalamus, white matter, and gray matter) (Table 3). Normal pituitary gland and white matter did not affect the unadjusted SUVmean by DEX suppression (all P >0.05). DEX significantly increased SUVmean of the thalamus and gray matter (thalamus, 8.70 [4.40–22.70] vs. 11.20 [6.40–17.5], P = 0.010*; gray matter, 6.25 [2.50–15.00] vs. 7.95 [5.00–11.90], P = 0.010*). However, SUVmean of the cerebellum significantly decreased after DEX administration (7.65 [4.50–10.80] vs. 6.40 [2.60–12.00], P = 0.006*).

Table 3 The change of FDG uptake for reference sites after DEX suppression in the patients with CD

Qualitative analysis by diagnostic modalities for CD

The qualitative results of localizing pituitary adenomas in CD patients are shown in Table 4 and Fig. 4. Only 13 patients had BIPSS results. The success rates were 90.91% for MRI and 84.62% for BIPSS.

Table 4 Qualitative analysis by diagnostic modalities for CD
Fig. 4

figure 4

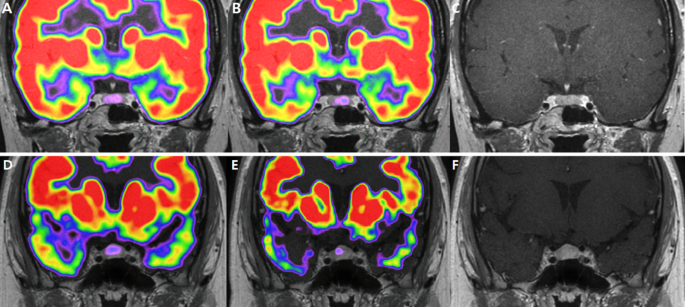
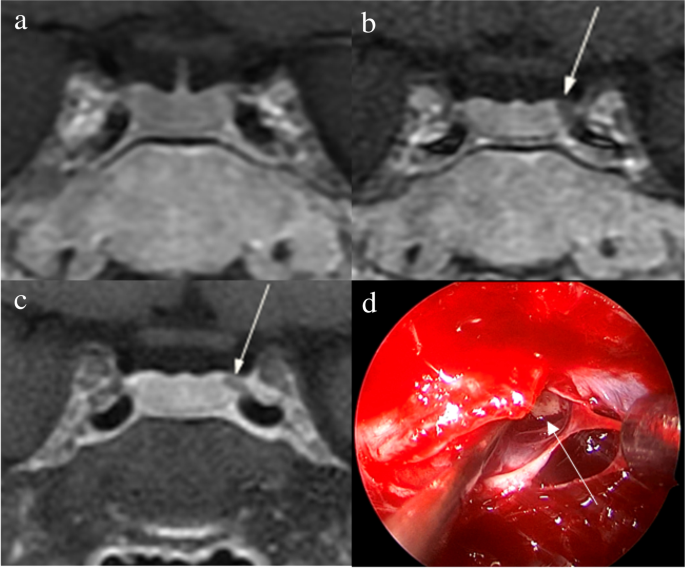
Images for corticotroph adenomas that appear different for localization in18F-FDG PET/CT.

9 mm sized adenoma in the left lateral wing of pituitary gland. It was found in the left lateral wing of the pituitary gland, showing an 18F-FDG uptake in the pituitary fossa with an SUVmean of 1.04 and SUVmax of 1.07. However, after DEX suppression, the left side of the pituitary gland did not exhibit suppressed 18F-FDG uptake, with SUVmean 1.05 SUVmax 1.14

(A). Co-registered baseline 18F-FDG PET/CT and MRI images. (B). Co-registered 18F-FDG PET/CT and MRI images after DEX suppression. (C). MRI image

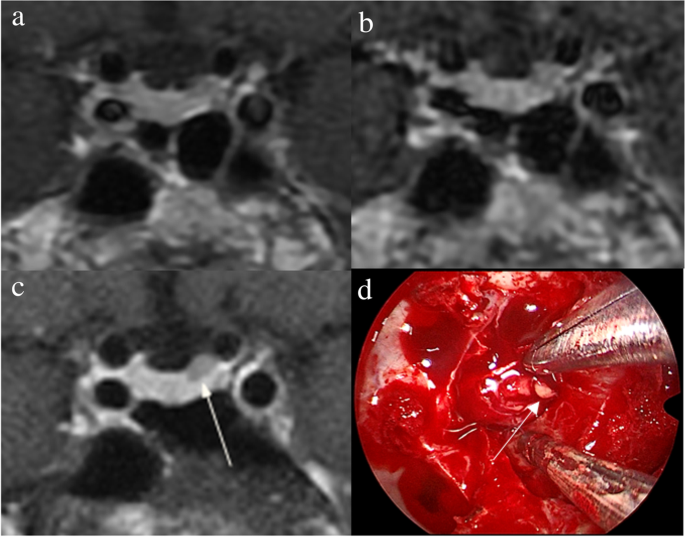
2 mm pituitary adenoma was detected at the left lateral wing, showing diffuse FDG uptake in the pituitary fossa with an SUVmean of 0.86 and SUVmax of 1.04. After DEX suppression, focal FDG uptake was observed, with SUVmean 0.87 and SUVmax 0.98. (D). Co-registered baseline 18F-FDG PET/CT and MRI images. (E). Co-registered 18F-FDG PET/CT and MRI images after DEX suppression. (F). MRI image

In baseline PET scans, the specialists agreed that pituitary adenomas were visible in 17 scans and not visible in 5 scans. They reached a consensus that the tumor was evident in two scans, but there was a discrepancy in their assessments of its location.

After DEX suppression, pituitary adenomas showed positive results in 16 scans and negative results in 5 scans. Specialists disagreed on the presence of pituitary adenomas in one case only.

Interobserver agreement for localizing adenomas was 0.872 (95%CI: 0.711, 1.033) for baseline PET/CT and 0.938 (95%CI: 0.762, 1.056) for post dexamethasone suppression PET/CT, confirming excellent interobserver agreements, and the result was judged reliable. Among the instances where both opinions agreed, there were no lesions that showed differences in visibility between scans before and after DEX administration. This meant that lesions were either consistently visible or invisible in both scenarios.

Discussion

We found that DEX suppression did not improve localization of ACTH-secreting pituitary adenomas using 18F-FDG PET/CT. Further, it did not significantly affect FDG uptakes in adrenocorticotrophic adenomas or normal pituitaries in patients with CD. The decision to administer 8 mg dexamethasone was based on the standard high-dose DST, which is internationally recommended for differentiating between ectopic ACTH secretion and CD [26]. This test involved comparing serum cortisol levels at 8 am before and after a single dose of 8 mg dexamethasone administered at 11 pm. Suppression of the serum cortisol level to less than 50% of the baseline value indicated a diagnosis of CD [3233]. Previous studies have reported that the 8-mg DST has a sensitivity of 90%, specificity of 100%, accuracy of 96.8%, positive predictive value of 100%, and negative predictive value of 95.5% [3435]. Our use of 8 mg dexamethasone was based on the theory that orally administering dexamethasone at this dose can effectively suppress cortisol levels in ACTH-secreting pituitary tumors.

We expected that FDG uptake by corticotrophic adenomas would not decrease after DEX administration in patients with CD, and this change may improve the ability to discriminate the tumor location from surrounding tissues on 18F-FDG PET. The SUVmax of pituitary adenomas adjusted for the normal pituitary gland increased from 1.13 to 1.21. However, this change was not statistically significant, and the success rate of localizing corticotrophic adenomas using 18F-FDG PET was not significantly improved after DEX suppression. If the FDG uptake of adenomas changed lesser compared to that of surrounding normal tissues after DEX suppression, the tumor could be more easily visualized because of the difference.

In addition, we attempted to evaluate FDG uptakes in other brain areas (cerebellum, thalamus, white matter, and gray matter) according to DEX administration in CD patients. SUVmean of the cerebellum decreased significantly, but that of the thalamus and gray matter increased after DEX suppression. DEX did not change FDG uptake in pituitary adenoma, normal pituitary, or white matter. In a previous study analyzing FDG PET in CD patients, researchers observed varying correlations between FDG uptake and blood cortisol concentration across different brain regions [3536]. Nevertheless, the examination did not include an analysis of FDG uptake in the pituitary gland. Additionally, no previous studies have explored the effects of high-dose dexamethasone suppression on brain glucose metabolism in individuals with CD. Further studies are needed to explain the change in FDG uptake after DEX administration in patients with CD.

18F-FDG PET/CT provides information regarding glucose metabolism in the brain in vivo and has been widely used to evaluate brain metabolism in clinical and research settings [37]. Here, the nadir cortisol level on the HD DST correlated with the SUVmean and SUVmax of pituitary adenomas on PET scans after DEX suppression. Cortisol secretion activity is thought to be associated with metabolic activity, and DEX administration altered this. Cortisol levels and FDG uptake in other regions of the brain are correlated in patients with CD, but the correlation between cortisol and FDG uptake in the pituitary glands and/or corticotrophic adenomas themselves has not been discussed [3536]. In our study, cortisol levels did not show a correlation with FDG uptake of corticotrophic adenomas, but after DEX suppression FDG uptake showed a correlation with the nadir cortisol level on the HD DST. This indicated that tumors in which cortisol secretion was less suppressed by on the HD DST showed higher FDG uptake than tumors with lower cortisol levels on the HD DST.

Although many studies have analyzed FDG uptake of brain tumors, reference sites defined in each study varied without a uniform standard. Gray matter, white matter, or adjacent tumor tissue was defined as a reference site [38,39,40]. We measured SUVmean of normal pituitary tissues, gray matter, white matter, thalamus, and cerebellum as possible references. We defined the SUVmean of normal pituitary tissues as a reference because the localization of adenomas requires an apparent difference between the adenoma and surrounding tissues.

Use of fixed ROI to measure FDG uptake caused partial volume effect in this study. However, lesions smaller than 5 mm with intense FDG uptake may still show increased FDG uptake, especially in tumors, albeit with lower SUV values compared with the actual values [41]. This study was performed because pituitary adenomas smaller than 5 mm with higher FDG uptake than the surrounding pituitary parenchyma have been observed in routine clinical practice. To control for the partial volume effect, the analysis was performed again for tumors which were larger than 5 mm and had higher FDG uptake than the surrounding pituitary parenchyma, and the results remained unchanged.

PET/CT has been explored as an alternative to or combined with MRI for the localization of corticotrophic adenomas. 18F-FDG PET/CT has a limited role in CD diagnosis, but CRH stimulation can increase its success rate [2242]. This study is important for increasing the effectiveness of PET using DEX. In addition, data on DEX effect on brain metabolism in patients with CD will be important for future studies.

Conclusions

DEX suppression did not improve the localization of 18F-FDG PET/CT in patients with CD. This is considered to have sufficient significance in an effort to increase the diagnostic value of 18F-FDG PET/CT.

Data Availability

All datasets generated and/or analyzed during the current study are not publicly available but are available from the corresponding author upon reasonable request.

Abbreviations

18F-FDG:
18F-fluorodeoxyglucose
PET/CT:
Positron emission tomography/computed tomography
DEX:
Dexamethasone
MRI:
Magnetic resonance imaging
BIPSS:
Bilateral inferior petrosal sinus sampling
CD:
Cushing’s disease
SUV:
Standardized uptake value
ACTH:
Adrenocorticotropic hormone
CRH:
Corticotrophin-releasing hormone
FDG:
Fluorodeoxyglucose
24hr UFC:
24-hour urine free cortisol
ON DST:
Overnight dexamethasone suppression test
HD DST:
High-dose dexamethasone suppression test
SUVmean :
Mean standardized uptake value
SUVmax :
Maximum standardized uptake value
P:
Peripheral
IPS:
Inferior petrosal sinuses
TSA:
Transsphenoidal adenectomy

References

  1. Newell-Price J, Bertagna X, Grossman AB, Nieman LK. Cushing’s syndrome. The Lancet. 2006;367:1605–17.

    Article CAS Google Scholar

  2. Steffensen C, Bak AM, Rubeck KZ, Jørgensen JOL. Epidemiology of Cushing’s syndrome. Neuroendocrinology. 2010;92:1–5.

    Article CAS PubMed Google Scholar

  3. Lacroix A, Feelders RA, Stratakis CA, Nieman LK. Cushing’s syndrome. The Lancet. 2015;386:913–27.

    Article CAS Google Scholar

  4. Moshang T Jr. Cushing’s Disease, 70 years later … and the beat goes on. J Clin Endocrinol Metab. 2003;88:31–3.

    Article CAS PubMed Google Scholar

  5. Bochicchio D, Losa M, Buchfelder M. Factors influencing the immediate and late outcome of Cushing’s disease treated by transsphenoidal surgery: a retrospective study by the european Cushing’s Disease Survey Group. J Clin Endocrinol Metab. 1995;80:3114–20.

    CAS PubMed Google Scholar

  6. Prevedello DM, Pouratian N, Sherman J, Jane JA, Vance ML, Lopes MB, et al. Management of Cushing’s disease: outcome in patients with microadenoma detected on pituitary magnetic resonance imaging: clinical article. J Neurosurg. 2008;109:751–9.

    Article PubMed Google Scholar

  7. Rees DA, Hanna FWF, Davies JS, Mills RG, Vafidis J, Scanlon MF. Long-term follow-up results of transsphenoidal surgery for Cushing’s disease in a single centre using strict criteria for remission. Clin Endocrinol (Oxf). 2002;56:541–51.

    Article CAS PubMed Google Scholar

  8. Semple PL, Vance ML, Findling J, Laws ER. Transsphenoidal surgery for Cushing’s disease: outcome in patients with a normal magnetic resonance imaging scan. Neurosurgery. 2000;46:553–8. discussion 558–559.

    Article CAS PubMed Google Scholar

  9. Chittiboina P, Montgomery BK, Millo C, Herscovitch P, Lonser RR. High-resolution(18)F-fluorodeoxyglucose positron emission tomography and magnetic resonance imaging for pituitary adenoma detection in Cushing disease. J Neurosurg. 2015;122:791–7.

    Article PubMed Google Scholar

  10. Chowdhury IN, Sinaii N, Oldfield EH, Patronas N, Nieman LK. A change in pituitary magnetic resonance imaging protocol detects ACTH-secreting tumours in patients with previously negative results. Clin Endocrinol (Oxf). 2010;72:502–6.

    Article PubMed Google Scholar

  11. Finelli DA, Kaufman B. Varied microcirculation of pituitary adenomas at rapid, dynamic, contrast-enhanced MR imaging. Radiology. 1993;189:205–10.

    Article CAS PubMed Google Scholar

  12. Kasaliwal R, Sankhe SS, Lila AR, Budyal SR, Jagtap VS, Sarathi V, et al. Volume interpolated 3D-spoiled gradient echo sequence is better than dynamic contrast spin echo sequence for MRI detection of corticotropin secreting pituitary microadenomas. Clin Endocrinol (Oxf). 2013;78:825–30.

    Article CAS PubMed Google Scholar

  13. Fukuoka H, Shichi H, Yamamoto M, Takahashi Y. The Mechanisms Underlying Autonomous adrenocorticotropic hormone secretion in Cushing’s Disease. Int J Mol Sci. 2020;21:9132.

    Article CAS PubMed PubMed Central Google Scholar

  14. Lamberts SWJ. Glucocorticoid receptors and Cushing’s disease. Mol Cell Endocrinol. 2002;197:69–72.

    Article CAS PubMed Google Scholar

  15. van Rossum EFC, Lamberts SWJ. Glucocorticoid resistance syndrome: a diagnostic and therapeutic approach. Best Pract Res Clin Endocrinol Metab. 2006;20:611–26.

    Article PubMed Google Scholar

  16. Alzahrani AS, Farhat R, Al-Arifi A, Al-Kahtani N, Kanaan I, Abouzied M. The diagnostic value of fused positron emission tomography/computed tomography in the localization of adrenocorticotropin-secreting pituitary adenoma in Cushing’s disease. Pituitary. 2009;12:309–14.

    Article CAS PubMed Google Scholar

  17. De Souza B, Brunetti A, Fulham MJ, Brooks RA, DeMichele D, Cook P, et al. Pituitary microadenomas: a PET study. Radiology. 1990;177:39–44.

    Article PubMed Google Scholar

  18. Campeau RJ, David O, Dowling AM. Pituitary adenoma detected on FDG positron emission tomography in a patient with mucosa-associated lymphoid tissue lymphoma. Clin Nucl Med. 2003;28:296–8.

    Article PubMed Google Scholar

  19. Jeong SY, Lee S-W, Lee HJ, Kang S, Seo J-H, Chun KA, et al. Incidental pituitary uptake on whole-body 18F-FDG PET/CT: a multicentre study. Eur J Nucl Med Mol Imaging. 2010;37:2334–43.

    Article PubMed Google Scholar

  20. Ju H, Zhou J, Pan Y, Lv J, Zhang Y. Evaluation of pituitary uptake incidentally identified on 18F-FDG PET/CT scan. Oncotarget. 2017;8:55544–9.

    Article PubMed PubMed Central Google Scholar

  21. Koo CW, Bhargava P, Rajagopalan V, Ghesani M, Sims-Childs H, Kagetsu NJ. Incidental detection of clinically occult pituitary adenoma on whole-body FDG PET imaging. Clin Nucl Med. 2006;31:42–3.

    Article PubMed Google Scholar

  22. Boyle J, Patronas NJ, Smirniotopoulos J, Herscovitch P, Dieckman W, Millo C, et al. CRH stimulation improves 18F-FDG-PET detection of pituitary adenomas in Cushing’s disease. Endocrine. 2019;65:155–65.

    Article CAS PubMed Google Scholar

  23. Valassi E, Biller BMK, Swearingen B, Pecori Giraldi F, Losa M, Mortini P, et al. Delayed remission after transsphenoidal surgery in patients with Cushing’s disease. J Clin Endocrinol Metab. 2010;95:601–10.

    Article CAS PubMed PubMed Central Google Scholar

  24. Dai C, Feng M, Sun B, Bao X, Yao Y, Deng K, et al. Surgical outcome of transsphenoidal surgery in Cushing’s disease: a case series of 1106 patients from a single center over 30 years. Endocrine. 2022;75:219–27.

    Article CAS PubMed Google Scholar

  25. Hinojosa-Amaya JM, Cuevas-Ramos D. The definition of remission and recurrence of Cushing’s disease. Best Pract Res Clin Endocrinol Metab. 2021;35:101485.

    Article PubMed Google Scholar

  26. Fleseriu M, Auchus R, Bancos I, Ben-Shlomo A, Bertherat J, Biermasz NR, et al. Consensus on diagnosis and management of Cushing’s disease: a guideline update. Lancet Diabetes Endocrinol. 2021;9:847–75.

    Article PubMed PubMed Central Google Scholar

  27. Nieman LK, Biller BMK, Findling JW, Newell-Price J, Savage MO, Stewart PM, et al. The diagnosis of Cushing’s syndrome: an endocrine Society Clinical Practice Guideline. J Clin Endocrinol Metab. 2008;93:1526–40.

    Article CAS

    1.  PubMed PubMed Central Google Scholar
    2. Park JW, Park S, Kim JL, Lee HY, Shin JE, Hyun DH, et al. Bilateral inferior petrosal sinus sampling by unilateral femoral venous approach. Neurointervention. 2011;6:23–6.

      Article PubMed PubMed Central Google Scholar

    3. Sharma ST, Raff H, Nieman LK. Prolactin as a marker of successful catheterization during IPSS in patients with ACTH-Dependent Cushing’s syndrome. J Clin Endocrinol Metab. 2011;96:3687–94.

      Article CAS PubMed PubMed Central Google Scholar

    4. Lim JS, Lee SK, Kim SH, Lee EJ, Kim SH. Intraoperative multiple-staged resection and tumor tissue identification using frozen sections provide the best result for the accurate localization and complete resection of tumors in Cushing’s disease. Endocrine. 2011;40:452–61.

      Article CAS PubMed Google Scholar

    5. Jakobsson U, Westergren A. Statistical methods for assessing agreement for ordinal data. Scand J Caring Sci. 2005;19:427–31.

      Article PubMed Google Scholar

    6. Dichek HL, Nieman LK, Oldfield EH, Pass HI, Malley JD, Cutler GB. A comparison of the standard high dose dexamethasone suppression test and the overnight 8-mg dexamethasone suppression test for the differential diagnosis of adrenocorticotropin-dependent Cushing’s syndrome. J Clin Endocrinol Metab. 1994;78:418–22.

      Article CAS PubMed Google Scholar

    7. Aytug S, Laws ER, Vance ML. Assessment of the utility of the high-dose dexamethasone suppression test in confirming the diagnosis of cushing disease. Endocr Pract Off J Am Coll Endocrinol Am Assoc Clin Endocrinol. 2012;18:152–7.

      Google Scholar

    8. Sriussadaporn S, Ploybutr S, Peerapatdit T, Plengvidhya N, Nitiyanant W, Vannasaeng S, et al. Nocturnal 8 mg dexamethasone suppression test: a practical and accurate test for identification of the cause of endogenous Cushing’s syndrome. Br J Clin Pract. 1996;50:9–13.

      Article CAS PubMed Google Scholar

    9. Liu S, Wang Y, Xu K, Ping F, Li F, Wang R, et al. Voxel-based comparison of brain glucose metabolism between patients with Cushing’s disease and healthy subjects. NeuroImage Clin. 2018;17:354–8.

      Article PubMed Google Scholar

    10. Liu S, Wang Y, Xu K, Ping F, Wang R, Li F, et al. Brain glucose metabolism is associated with hormone level in Cushing’s disease: a voxel-based study using FDG-PET. NeuroImage Clin. 2016;12:415–9.

      Article PubMed PubMed Central Google Scholar

    11. Sokoloff L, Reivich M, Kennedy C, Rosiers MHD, Patlak CS, Pettigrew KD, et al. The [14c]deoxyglucose method for the measurement of local cerebral glucose utilization: Theory, Procedure, and normal values in the conscious and anesthetized albino Rat1. J Neurochem. 1977;28:897–916.

      Article CAS PubMed Google Scholar

    12. Chen W, Silverman DHS. Advances in evaluation of primary brain tumors. Semin Nucl Med. 2008;38:240–50.

      Article PubMed Google Scholar

    13. Delbeke D, Meyerowitz C, Lapidus RL, Maciunas RJ, Jennings MT, Moots PL, et al. Optimal cutoff levels of F-18 fluorodeoxyglucose uptake in the differentiation of low-grade from high-grade brain tumors with PET. Radiology. 1995;195:47–52.

      Article CAS PubMed Google Scholar

    14. Meric K, Killeen RP, Abi-Ghanem AS, Soliman F, Novruzov F, Cakan E, et al. The use of 18F-FDG PET ratios in the differential diagnosis of common malignant brain tumors. Clin Imaging. 2015;39:970–4.

      Article PubMed Google Scholar

    15. Soret M, Bacharach SL, Buvat I. Partial-volume effect in PET tumor imaging. J Nucl Med. 2007;48:932–45.

      Article PubMed Google Scholar

    16. Xin C, Rui-xue C, Hui P, Tao Y, Hui-Juan Z, Fang L. Value of [18F] fluoro-2-deoxy-D-glucose positron emission tomography/computed tomography in diagnosis and localization of Cushing’s disease. Zhongguo Yi Xue Ke Xue Yuan Xue Bao. 2011;33:107–10.

      PubMed Google Scholar

    Download references

    Acknowledgements

    We would like to thank Editage (www.editage.co.kr) for English language editing.

    Funding

    The study was supported by the “Team Science Award” of Yonsei University College of Medicine (6-2022-0150).

    Author information

    Authors and Affiliations

    1. Endocrinology, Institute of Endocrine Research, Department of Internal Medicine, Yonsei University College of Medicine, Seoul, Republic of Korea

      Kyungwon Kim, Cheol Ryong Ku & Eun Jig Lee

    2. Department of Radiology, Severance Hospital, Yonsei University College of Medicine, Seoul, Republic of Korea

      Dong Kyu Kim

    3. Department of Neurosurgery, Severance Hospital, Yonsei University College of Medicine, Seoul, Republic of Korea

      Ju Hyung Moon, Eui Hyun Kim & Sun Ho Kim

    Contributions

    Conception and design: EJL, CRK, KK. Acquisition of data: KK, DKK. Analysis and interpretation of data: KK. Drafting the article: KK. Administrative/technical/material support: JHM, EHK, SHK. Study supervision: EJL, CRK. Writing, review, and revision of the manuscript: KK, DKK, SHK, CRK. Final approval of the manuscript: CRK, EJL.

    Corresponding authors

    Correspondence to Cheol Ryong Ku or Eun Jig Lee.

    Ethics declarations

    Ethics approval and consent to participate

    The data were collected under the conditions of regular clinical care with approval from the ethics committee of our hospital, and the requirement for written informed consent was waived owing to its retrospective design (institutional review board number: 2023-0110-001).

    Consent for publication

    Not applicable.

    Competing interests

    The authors declare no conflicts of interest that could be perceived as prejudicing the impartiality of this study.

    Additional information

    Publisher’s Note

    Springer Nature remains neutral with regard to jurisdictional claims in published maps and institutional affiliations.

    Electronic supplementary material

    Additional file 1 of Dexamethasone suppression for 18F-FDG PET/CT to localize ACTH-secreting pituitary tumors

    Additional file 1

    Below is the link to the electronic supplementary material.

    Cite this article

    Kim, K., Kim, D.K., Moon, J.H. et al. Dexamethasone suppression for 18F-FDG PET/CT to localize ACTH-secreting pituitary tumors. Cancer Imaging 23, 85 (2023). https://doi.org/10.1186/s40644-023-00600-8

    Download citation

    Share this article

    Anyone you share the following link with will be able to read this content:

    Get shareable linkProvided by the Springer Nature SharedIt content-sharing initiative

    Keywords

    • 18F-FDG PET/CT
    • ACTH-secreting pituitary tumor
    • Cushing’s disease
    • Dexamethasone suppression
    • High-dose dexamethasone suppression test

    From https://cancerimagingjournal.biomedcentral.com/articles/10.1186/s40644-023-00600-8

Long-Term Efficacy and Safety of Osilodrostat in Patients with Cushing’s Disease

Objective: To evaluate the long-term efficacy and safety of osilodrostat in patients with Cushing’s disease.

Methods: The multicenter, 48-week, Phase III LINC 4 clinical trial had an optional extension period that was initially intended to continue to week 96. Patients could continue in the extension until a managed-access program or alternative treatment became available locally, or until a protocol amendment was approved at their site that specified that patients should come for an end-of-treatment visit within 4 weeks or by week 96, whichever occurred first. Study outcomes assessed in the extension included: mean urinary free cortisol (mUFC) response rates; changes in mUFC, serum cortisol and late-night salivary cortisol (LNSC); changes in cardiovascular and metabolic-related parameters; blood pressure, waist circumference and weight; changes in physical manifestations of Cushing’s disease; changes in patient-reported outcomes for health-related quality of life; changes in tumor volume; and adverse events. Results were analyzed descriptively; no formal statistical testing was performed.

Results: Of 60 patients who entered, 53 completed the extension, with 29 patients receiving osilodrostat for more than 96 weeks (median osilodrostat duration: 87.1 weeks). The proportion of patients with normalized mUFC observed in the core period was maintained throughout the extension. At their end-of-trial visit, 72.4% of patients had achieved normal mUFC. Substantial reductions in serum cortisol and LNSC were also observed. Improvements in most cardiovascular and metabolic-related parameters, as well as physical manifestations of Cushing’s disease, observed in the core period were maintained or continued to improve in the extension. Osilodrostat was generally well tolerated; the safety profile was consistent with previous reports.

Conclusion: Osilodrostat provided long-term control of cortisol secretion that was associated with sustained improvements in clinical signs and physical manifestations of hypercortisolism. Osilodrostat is an effective long-term treatment for patients with Cushing’s disease.

Clinical trial registration: ClinicalTrials.gov, identifier NCT02180217

Introduction

Cushing’s disease is a rare but serious disorder resulting from an adrenocorticotropic hormone (ACTH)-producing pituitary adenoma that, in turn, promotes excess adrenal cortisol (1). Chronic exposure to excess cortisol is associated with numerous comorbidities, including hypertension, muscle weakness, hirsutism, central obesity, hypercoagulability and diabetes mellitus, all of which lead to an increased risk of mortality and poor health-related quality of life (HRQoL) (13). The longer the exposure to excess cortisol, the lower the chance of reversing morbidity (2).

Although transsphenoidal surgery is the recommended first-line treatment, approximately one-third of patients experience persistent or recurrent disease following surgery (4), and some patients are ineligible for or refuse surgery (46). Steroidogenesis inhibitors are usually the first choice for medical treatment (6). The effect of medical treatment can be easily monitored by measurement of serum and urine cortisol. Owing to the unremitting nature of Cushing’s disease, patients often require continued medical therapy to maintain long-term control of cortisol excretion. To date, long-term efficacy and safety data for steroidogenesis inhibitors from prospective clinical trials are limited (78).

Osilodrostat is a potent oral inhibitor of 11β-hydroxylase and is approved for the treatment of adult patients with Cushing’s disease (USA) or endogenous Cushing’s syndrome (EU and Japan) who are eligible for medical therapy (912). The LINC 4 study was a multicenter, 48-week, Phase III clinical trial in patients with Cushing’s disease that included an upfront 12-week randomized, double-blind, placebo-controlled period. Osilodrostat led to rapid normalization of mean urinary free cortisol (mUFC) excretion and was significantly superior to placebo at week 12; normal mUFC excretion was sustained in most patients throughout the 48-week core period (13).

Following the 48-week core period, patients could enter an optional open-label extension period intended to run for an additional 48 weeks. Here, we report the long-term efficacy and safety data from the extension of LINC 4. These data augment the existing efficacy and safety profile of osilodrostat (781314).

Methods

Patients

Eligibility criteria have been described previously (13). Briefly, the study enrolled adult patients with a confirmed diagnosis of persistent or recurrent Cushing’s disease after pituitary surgery and/or irradiation, or de novo Cushing’s disease (if not surgical candidates), with mUFC >1.3 times the upper limit of normal (ULN; 138 nmol/24 h or 50 μg/24 h; calculated from three samples collected on three consecutive days, with ≥2 values >1.3 x ULN). Patients who continued to receive clinical benefit from osilodrostat, as assessed by the study investigator, could enter the extension phase.

The study was conducted in accordance with the Declaration of Helsinki, with an independent ethics committee/institutional review board at each site approving the study protocol; patients provided written informed consent to participate and consented again at week 48 to taking part in the extension phase. The trial is registered at ClinicalTrials.gov (NCT02180217).

Study design

Data from the 48-week core period of this Phase III study, consisting of a 12-week randomized, placebo-controlled, double-blind period followed by a 36-week open-label treatment period, have been published previously (13). The optional open-label extension phase was initially planned to run for an additional 48 weeks (to week 96 for the last patient enrolled). However, patients could continue in the extension only until a managed-access program or alternative treatment became available locally, or until a protocol amendment was approved at their site that specified that patients enrolled in the optional extension phase should come for an end-of-treatment (EOT) visit within 4 weeks or by week 96, whichever occurred first. Patients still receiving clinical benefit from osilodrostat at their EOT visit were eligible to join a separate long-term safety follow-up study (NCT03606408). Consequently, the extension phase ended when all patients had transitioned to the long-term safety follow-up study, if eligible, or had discontinued from the study. Patients continued to receive open-label osilodrostat at the established effective dose from the core phase (dose adjustments were permitted based on efficacy and tolerability; the maximum dose was 30 mg twice daily [bid]).

Outcomes

Study outcomes assessed during the extension phase were as follows: complete (mUFC ≤ULN), partial (mUFC decrease ≥50% from baseline and >ULN) and mUFC response rate at weeks 60, 72, 84, 96 and 108, then every 24 weeks until the extension EOT visit; change in mUFC, serum cortisol and late-night salivary cortisol (LNSC) at weeks 60, 72, 84, 96 and 108, then every 24 weeks until the extension EOT visit; time to loss of mUFC control, defined as the time (in weeks) from the first collection of post-baseline normal mUFC (≤ULN) to the first mUFC >1.3 x ULN on two consecutive scheduled visits on the highest tolerated dose of osilodrostat and not related to a dose interruption or reduction for safety reasons after week 26; change in cardiovascular/metabolic-related parameters associated with Cushing’s disease (fasting plasma glucose [FPG] and glycated hemoglobin [HbA1c]) at weeks 60, 72, 84, 96 and 108, then every 24 weeks until the extension EOT visit; blood pressure, waist circumference and weight every 4 weeks until week 72, then every 12 weeks until week 108, then every 24 weeks until the extension EOT visit; change from baseline in physical manifestations of hypercortisolism at weeks 72, 96 and 108, then every 24 weeks until the extension EOT visit; changes in HRQoL (determined by Cushing’s Quality of Life Questionnaire [CushingQoL] and Beck Depression Inventory II [BDI-II]) at weeks 72 and 96 and the extension EOT visit; and proportion of patients with ≥20% decrease or increase in tumor volume. mUFC (mean of two or three 24-hour urine samples), serum cortisol (measured between 08:00 and 10:00) and LNSC (measured from two samples collected between 22:00 and 23:00) were evaluated using liquid chromatography-tandem mass spectrometry and assessed centrally. Pituitary magnetic resonance imaging with and without gadolinium enhancement was performed locally at weeks 72 and 96 and the extension EOT visit; images were assessed centrally for change in tumor size. Safety was continually assessed from core study baseline throughout the extension for all enrolled patients by monitoring for adverse events (AEs); all AEs from first patient first visit to last patient last visit are reported. AEs of special interest (AESIs) included events related to hypocortisolism, accumulation of adrenal hormone precursors, arrhythmogenic potential and QT prolongation, and enlargement of the pituitary tumor.

Statistical methods

Analyses presented here are based on cumulative data generated for the full analysis set (all patients enrolled at core study start who received at least one dose of osilodrostat) up to last patient last visit. Safety analyses included all enrolled patients who received at least one dose of osilodrostat and had at least one valid post-baseline safety assessment. All analyses excluded data for patients in the placebo arm collected during the placebo-controlled period. Results were analyzed descriptively, and no formal statistical testing was performed. Correlations were evaluated using the Pearson’s correlation coefficient; extreme outliers were defined as >(Q3 + 3 x IQR) or <(Q1 − 3 x IQR), where Q1 and Q3 are the first and third quartiles and IQR is the interquartile range (Q3 − Q1).

Results

Patient disposition and baseline characteristics

LINC 4 was conducted from October 3, 2016 to December 31, 2020. Of the 73 patients who were enrolled and received treatment in the core phase, 65 completed the core phase and 60 (82.2%) opted to enter the extension; 53 (72.6%) patients completed the extension (Figure 1). At core study baseline, most patients had undergone previous pituitary surgery (87.7%) or received prior medical therapy (61.6%; Table 1). Patients had a variety of comorbidities at core study baseline, most commonly hypertension (61.6%); physical manifestations of hypercortisolism were common (Table 1).

Figure 1
www.frontiersin.orgFigure 1 Patient disposition. *Patient was randomly allocated to osilodrostat but did not receive any study treatment because of a serious AE (grade 4 pituitary apoplexy that required hospitalization prior to receiving any study drug) that was not considered related to treatment.

Table 1
www.frontiersin.orgTable 1 Core study patient baseline characteristics.

Exposure to osilodrostat

From core baseline to study end, median (range) osilodrostat exposure was 87.1 (2.0–126.6) weeks; 29 (39.7%) patients were exposed to osilodrostat for more than 96 weeks. The median (25th–75th percentiles) average osilodrostat dose received during the overall study period was 4.6 (3.7–9.2) mg/day; during the core study, median (25th–75th percentiles) average dose was 5.0 (3.8–9.2) mg/day (13). The osilodrostat dose being taken for the longest duration was most frequently 4.0 mg/day (27.4%). Following titration, daily osilodrostat dose remained stable during long-term treatment (Figure 2).

Figure 2
www.frontiersin.orgFigure 2 (A) Mean and (B) median osilodrostat dose over time. Shaded areas indicate the randomized, double-blind period and the open-label period of the core phase. According to the study protocol, all patients restarted the open-label period on osilodrostat 2 mg bid unless they were on a lower dose at week 12. All patients on <2 mg bid osilodrostat (or matched placebo) at week 12 continued to receive the same dose, regardless of initial treatment allocation. n is the number of patients who contributed to the mean/median.

Long-term efficacy of osilodrostat treatment

Of patients who had received at least one dose of osilodrostat, 68.5% (n=50/73) had mUFC ≤ULN at the end of the core period, and 54.8% (n=40/73) had mUFC ≤ULN at week 72. Of patients who opted to enter the extension, 66.7% had mUFC ≤ULN (n=40/60) and 8.3% (n=5/60) had mUFC decreased by ≥50% from baseline and >ULN at week 72 (Figure 3A). Of patients with an assessment at their extension EOT visit, 72.4% (n=42/58) had mUFC ≤ULN and 8.6% (n=5/58) had mUFC decreased by ≥50% from baseline and >ULN.

Figure 3
www.frontiersin.orgFigure 3 (A) Proportion of patients with mUFC response over time, (B) mean mUFC over time, and (C) individual patient changes in mUFC. (A) Patients with missing mUFC at any visit, including those who had discontinued treatment, were counted as non-responders. Shaded area represents the 48-week core phase; excludes data in placebo arm collected during placebo-control period. *The proportion of patients with mUFC ≤ULN at week 48 was calculated using the full analysis set (patients who had discontinued treatment were classified as non-responders). Discontinued, n=12; missing because of the COVID-19 pandemic, n=4; mUFC not meeting response criteria, n=3; missing (any other reason), n=1. mUFC not meeting response criteria, n=8; missing because of the COVID-19 pandemic, n=2; missing (any other reason), n=1. (B) Shaded areas indicate the randomized, double-blind period and the open-label period of the core phase. n is the number of patients who contributed to the mean. Analysis includes scheduled visits only. (B, C) Dashed line is the ULN for UFC (138 nmol/24 h).

Mean mUFC excretion for the 48-week core period of the study has been reported previously (13); mUFC excretion normalized in patients who received osilodrostat, either during the 12-week randomized period (osilodrostat arm) or during the subsequent 36-week open-label period (all patients) (13). Mean mUFC excretion was maintained within the normal range in the extension period (week 72 (n=48), 90.5 [SD 122.6] nmol/24 h; 0.7 [0.9] x ULN; Figure 3B). Median (range) mUFC excretion is shown in Supplementary Figure 1A. Individual patient changes in mUFC from core study baseline to their last observed visit are shown in Figure 3C. There were no escape-from-response events during the extension phase following the primary analysis cut-off (February 25, 2020) (13).

During the core period, mean (SD) serum cortisol levels decreased from 538.1 (182.3) nmol/L (0.9 [0.3] x ULN) at baseline to 353.9 (124.9) nmol/L (0.6 [0.2] x ULN) at week 48. Serum cortisol levels then remained stable throughout the extension period (week 72: 319.1 [129.8] nmol/L, 0.6 [0.2] x ULN; Figure 4A). LNSC also decreased and then remained stable, although >ULN, throughout the study (baseline: 10.8 [23.5] nmol/L, 4.3 [9.4] x ULN; week 48: 3.7 [2.6] nmol/L, 1.5 [1.0] x ULN; week 72: 3.8 [3.0] nmol/L, 1.5 [1.2] x ULN; Figure 4B). Median serum cortisol and LNSC are shown in Supplementary Figures 1B, C. Of patients with baseline and last observed value (LOV) measurements, 25.0% had normal LNSC at baseline (n=6/24) and 47.8% had normal LNSC at their last visit (n=11/23). Interpretation of this result is limited by the high degree of missing data (baseline: 67.1%, n=49/73; LOV: 68.5%, n=50/73).

Figure 4
www.frontiersin.orgFigure 4 (A) Mean serum cortisol and (B) mean LNSC from baseline to the end of treatment. Shaded areas indicate the randomized, double-blind period and the open-label period of the core phase. n is the number of patients who contributed to the mean. Dashed line in (A) indicates reference serum cortisol range for males and females ≥18 years old (127–567 nmol/L). Dashed line in (B) indicates reference LNSC (22:00–23:00) range for males and females ≥18 years old (≤2.5 nmol/L).

Changes in cardiovascular and metabolic parameters, physical manifestations of Cushing’s disease and patient-reported outcomes

As previously reported, improvements from baseline occurred in most cardiovascular and metabolic-related parameters in the core period following osilodrostat treatment (9). This trend continued during the extension phase and included a reduction in FPG, HbA1c, cholesterol, systolic and diastolic blood pressure, waist circumference, and weight (Figure 5). Similarly, the improvements from baseline in physical features of hypercortisolism observed by week 48 were maintained for most parameters throughout the extension (Figure 6A), with either no change or improvement observed from baseline in ≥90% patients for all parameters at week 72. Facial rubor, supraclavicular fat pad, dorsal fat pad and central obesity had a favorable shift from baseline in ≥40% of patients at week 72. Few patients reported worsening from baseline of specific manifestations (Figure 6A).

Figure 5
www.frontiersin.orgFigure 5 Changes in cardiovascular-related metabolic parameters. Shaded area indicates the core phase. n is the number of patients who contributed to the mean. Error bars indicate standard deviation. DBP, diastolic blood pressure; HDL, high-density lipoprotein; LDL, low-density lipoprotein; SBP, systolic blood pressure.

Figure 6
www.frontiersin.orgFigure 6 Changes in (A) physical manifestations of Cushing’s disease and (B) patient-reported outcomes. Shaded area indicates the core phase. n is the number of patients who contributed to the mean.

Improvements were also observed in scores for patient quality of life (QoL). Both standardized CushingQoL and BDI-II scores improved steadily during the core phase. QoL scores continued to improve further during the extension. At week 72 and EOT, mean (SD) standardized CushingQoL score was 66.4 (19.6) and 69.0 (20.9), and mean (SD) BDI-II score was 6.5 (7.0) and 6.2 (7.1), representing a mean (SD) change from baseline of 15.2 (19.0) and 17.1 (17.1) and −4.1 (9.3) and −4.5 (7.9), respectively (Figure 6B).

Adverse events

AEs that occurred in >20% of patients, irrespective of study-drug relationship, during the entire study period (median [range] osilodrostat exposure for all patients: 87.1 [2.0–126.6] weeks; excluding data collected in the placebo arm during the placebo-controlled period) are shown in Table 2. The most common AEs were decreased appetite (46.6%), arthralgia (45.2%) and fatigue (39.7%). Most AEs were mild or moderate; 60.3% were reported as grade 1/2 (Table 2).

Table 2
www.frontiersin.orgTable 2 Summary of adverse events during LINC 4 core and extension periods.

Overall, 10 AEs (adrenal insufficiency, n=3; hyperbilirubinemia, hypokalemia, headache, arthralgia, pituitary tumor, benign pituitary tumor, and depression, n=1 each) in nine patients (12.3%; one patient experienced both arthralgia and headache) led to treatment discontinuation. For two patients (2.7%), those AEs were reported as grade 3 (hyperbilirubinemia and hypokalemia). One patient discontinued following the primary analysis cut-off date (February 25, 2020).

The most common AESIs in both the core and extension periods were those related to adrenal hormone precursors. However, the proportion of patients reporting these AESIs was lower in the extension than in the core period (Figure 7). AESIs related to hypocortisolism were most frequent during the core period but did occur throughout the remainder of the study, albeit at lower frequency (Figure 7). Hypocortisolism-related AEs were most frequently managed with temporary osilodrostat interruption (n=20) or dose adjustment (n=6), and with concomitant glucocorticoids (n=15). There were no new occurrences of AESIs related to arrhythmogenic potential and QT prolongation, or to pituitary tumor enlargement, in the extension (Figure 7). During the entire study period from core baseline to the end of the extension, AESIs led to osilodrostat discontinuation in six (8.2%) patients (n=1, related to accumulation of adrenal hormone precursors [hypokalemia]; n=3, related to hypocortisolism [all adrenal insufficiency]; n=2, related to pituitary tumor enlargement [pituitary tumor and pituitary tumor benign]).

Figure 7
www.frontiersin.orgFigure 7 Occurrence of AESIs by time interval. The denominator for each time period only included patients who had at least one scheduled visit, or at least one observed AE, during that period. From baseline to week 12, the denominator only included patients randomized to osilodrostat. A patient with multiple occurrences of an AE within the same period is counted only once in that period. However, if an AE ends and occurs again in a different period, it is then counted in both periods. Shaded areas indicate the randomized, double-blind period and the open-label period of the core phase. *Maximum duration of follow-up was 127 weeks.

Following an increase in 11-deoxycortisol and 11-deoxycorticosterone during the core study, levels tended to decrease during longer-term treatment (Figure 8). From baseline to LOV, the proportion of patients with elevated 11-deoxycorticosterone and 11-deoxycortisol levels increased from 10.0% (n=1/10) to 90.0% (n=9/10) and from 57.9% (n=33/57) to 86.7% (n=5 and 2/60), respectively. In female patients, mean (SD) testosterone levels increased from 1.1 (0.6) nmol/L at baseline to 2.5 (2.6) nmol/L at the end of the core phase, then decreased to within the normal range (0.7−2.6 nmol/L for females) by the extension phase end-of-treatment visit (1.9 [1.7] nmol/L; Figure 8). The proportion of females with an elevated testosterone level increased from 15.0% (n=9/61) at baseline to 63.2% (n=24/61) at week 72 and then reduced to 41.7% (n=25/61) at LOV. In males, testosterone levels increased and remained within the normal range throughout osilodrostat treatment (Figure 8). The proportion of male patients with testosterone levels below the lower limit of normal decreased from 58.3% (n=7/12) at baseline to 33.3% (n=4/12) at LOV. The proportion of patients experiencing AEs potentially related to increased testosterone (increased blood testosterone, acne and hirsutism) was lower during the extension than during the core study (Supplementary Figure 2). Mean serum potassium levels remained stable and within the normal range (3.5–5.3 mmol/L) throughout osilodrostat treatment (Figure 8). The proportion of patients with a normal potassium level was similar between baseline (98.6%, n=72/73) and LOV (94.4%, n=68/72).

Figure 8
www.frontiersin.orgFigure 8 Mean (± SD) levels up to the end-of-treatment visit in the extension phase for 11-deoxycortisol, 11-deoxycorticosterone, potassium and testosterone (in males and females). Shaded area indicates the core phase. n is the number of patients who contributed to the mean. Reference ranges: 11-deoxycortisol ULN, 3.92 nmol/L in males and 3.1 nmol/L in females, or lower depending on age; 11-deoxycorticosterone ULN, 455 pmol/L in males and 696 pmol/L in females (mid-cycle); potassium, 3.5–5.3 mmol/L; testosterone, 8.4–28.7 nmol/L in males and 0.7–2.6 nmol/L in females.

At baseline, median (range) tumor volume was 82.0 (12.0–2861.0) mm3; 28.8% (n=21/73) of patients had a macroadenoma (≥10 mm) and 68.5% (n=51/73) had a microadenoma (<10 mm). At week 72, median (range) tumor volume was 68.0 (10.0–3638.0) mm3 (Figure 9A). Of the 27 patients with measurements at both baseline and week 72, 29.6% (n=8/27) had a ≥20% decrease in tumor volume and 37.0% (n=10/27) had a ≥20% increase (Figure 9B). Notably, mean (SD) plasma ACTH increased steadily between baseline (17.1 [32.1] pmol/L, n=73) and week 72 (65.0 [96.9] pmol/L, n=45; Figure 9C); mean ACTH levels appeared to stabilize after week 72. All patients experienced an increase in ACTH levels from baseline to week 72 (n=45) and LOV (n=73); of these, 34/45 (75.6%) and 47/73 (64.4%) experienced an increase in ACTH of ≥2 × baseline levels to week 72 and to LOV, respectively. There was no correlation between change in tumor volume and change in ACTH from baseline to week 72 (r=0.1; calculated without two extreme outliers).

Figure 9
www.frontiersin.orgFigure 9 (A) Mean and median tumor volume over time, (B) number of patients with a change in tumor volume from baseline, and (C) mean ACTH over time. Shaded areas indicate the core phase. n is the number of patients who contributed to the mean. Dashed lines in (C) indicate reference morning (07:00–10:00) plasma ACTH ranges for males and females ≥18 years old (1.3–11.1 pmol/L).

Discussion

Following transsphenoidal surgery, approximately one-third of patients experience persistence or recurrence of disease and subsequently require further treatment to control excess cortisol secretion (4). It is therefore essential that clinical studies evaluating the long-term safety and efficacy of potential new treatments, such as osilodrostat, are performed. The data presented here from the LINC 4 extension reinforce previous reports demonstrating that osilodrostat is effective and well tolerated during long-term treatment of Cushing’s disease (781314).

The normalization of mUFC excretion, observed from as early as week 2 in some patients (13), was sustained to the end of the optional open-label extension phase. Overall, the response rate was durable and remained ≥60% throughout the study, with 72.4% of patients maintaining mUFC ≤ULN at their extension EOT visit. Considering the range in baseline mUFC values (21.4–2607.3 nmol/24 h), this indicates that patients can benefit from osilodrostat treatment regardless of their baseline mUFC level. This also suggests that baseline mUFC is not an indicator of whether a patient will respond to osilodrostat treatment. Notably, there were no escape events during the extension period. Additionally, the improvements in most cardiovascular and metabolic parameters, physical manifestations and QoL previously reported during the 48-week core phase were maintained or further improved with long-term treatment (13). Collectively, these results demonstrate the ability of osilodrostat to reduce the burden of disease and comorbidities frequently experienced by patients with Cushing’s disease.

mUFC excretion is commonly assessed in clinical trials and during routine clinical practice to evaluate response to treatment. It is also important to monitor the recovery of the circadian cortisol rhythm in response to treatment by measuring serum cortisol and LNSC (61517). Elevated LNSC levels have been linked to dysregulation in glucose tolerance, insulin sensitivity and insulin secretion (18). As such, one potential explanation for persistent comorbidities in some patients with normalized mUFC excretion is that LNSC, although reduced, remains just above the ULN. Assessment of LNSC during treatment with other medical therapies has been reported, although differences in treatment duration and patient population type and size limit meaningful comparisons between therapies (1517). In LINC 4, mean serum cortisol levels remained within the normal range. Mean LNSC improved considerably from baseline but remained above the ULN throughout the study; 47.8% (n=11/23) of patients achieved normalized LNSC at their LOV visit. A numerically large decrease in LNSC, but with mean levels remaining above the ULN, is consistent with previous reports during long-term osilodrostat treatment (8); the mechanism underlying this observation is currently unknown. In real-life clinical practice, the osilodrostat label allows flexible dosing (911), which may help achieve normalization of LNSC. Furthermore, the number of patients with available LNSC assessments was limited, particularly during the extension; therefore, the data should be interpreted with caution. Future studies should examine whether patients with normalization of both UFC and LNSC have better outcomes than patients with only normalized UFC.

Overall, the safety findings reported here for the extension period were consistent with those reported in the primary analysis (13) and previous clinical trials (7814). Osilodrostat was generally well tolerated throughout the study; most reported AEs were mild or moderate in severity and manageable. Only nine of 73 (12.3%) patients discontinued osilodrostat at any time because of an AE (3/73 [4.1%] prior to week 48; 6/60 [10.0%] after week 48). Given that osilodrostat is a potent inhibitor of 11β-hydroxylase, AEs related to hypocortisolism or increased levels of adrenal hormone precursors are expected. The frequency of these AEs was lower in the extension period than in the core period, although events did still occur, highlighting the importance of monitoring patients regularly throughout long-term osilodrostat use. AEs potentially related to arrhythmogenic potential and QT prolongation remained infrequent throughout the study. Furthermore, the clinical benefit and tolerability of osilodrostat is supported by the high proportion of patients who chose to continue into the extension period: 92.3% who completed the core phase continued into the optional extension phase, with 88.3% of those completing the extension.

Although dose adjustments were allowed in the open-label phase, the dose of osilodrostat remained stable over long-term treatment, with 4 mg/day adequate for most patients to achieve and sustain control of mUFC excretion. Most AEs related to hypocortisolism occurred during the dose-escalation periods of both LINC 4 (27%) and LINC 3 (51%) (19); the lower occurrence in LINC 4 than LINC 3 may have been related to the more gradual dose-escalation schedule of LINC 4 (every 3 weeks) relative to that of LINC 3 (every 2 weeks) (131419). As such, an increased dose-titration interval could be considered when there is a need to mitigate the potential for glucocorticoid withdrawal syndrome or hypocortisolism-related AEs following a rapid decrease in cortisol. Dose-increase decisions should be informed by regular cortisol assessments, the rate of decrease in cortisol, and the individual’s clinical response and tolerability to osilodrostat. Furthermore, as with all steroidogenesis inhibitors, patients should be educated on the expected effects of treatment and dose increases, with a particular focus on the symptoms of hypocortisolism and the advice to contact their physician if they occur.

As expected, levels of 11-deoxycortisol, 11-deoxycorticosterone and, in women, testosterone increased during osilodrostat treatment. These then decreased during long-term treatment; notably, testosterone levels in women returned to within the normal range and to near baseline levels. These observations are consistent with the findings of LINC 3, which also demonstrated that these increases were reversible following discontinuation of osilodrostat (14). Compared with the primary analysis, there were no new AEs of increased testosterone in the extension phase of LINC 4; these findings are consistent with both LINC 2 and LINC 3 long-term analyses (78).

In general, osilodrostat did not adversely affect pituitary tumor volume, with similar proportions of patients reporting either a ≥20% decrease, ≥20% increase or stable tumor volume throughout the study. Although ACTH levels increased during osilodrostat treatment, there was no apparent correlation between the change in ACTH and the change in tumor volume after 72 weeks of treatment; however, longer-term data are needed to evaluate this further. As ACTH-producing pituitary adenomas are the underlying drivers of hypercortisolism, in turn responsible for the high morbidity and poor QoL associated with the disease, tumor stability is of great clinical importance in patients with Cushing’s disease, especially those for whom surgery has failed or is not a viable option.

In addition to LINC 4, other studies have assessed the long-term efficacy and safety of other medical therapies (2024); however, there is a paucity of prospective, long-term data. For metyrapone, an oral steroidogenesis inhibitor that is given three or four times daily (25), prospective data are currently only available for 36 weeks of treatment in the Phase III/IV PROMPT study (2223). Normalization of mUFC excretion was observed in 48.6% (n=17/35) of patients at week 36 (23), and gastrointestinal, fatigue and adrenal insufficiency AEs were the most commonly reported during the first 12 weeks of treatment (22). Current data for levoketoconazole, an oral steroidogenesis inhibitor that is a ketoconazole stereoisomer taken twice daily, are available for 12 months (median duration of exposure 15 months, n=60) following the extended open-label extension of the Phase III SONICS study (26). Of patients with data, 40.9% (n=18/44) had normal mUFC excretion at month 12 (26). During the extension, no patient experienced alanine aminotransferase or aspartate aminotransferase >3 x ULN, suggesting that the potentially clinically important events relating to liver toxicity may be more likely to occur early during treatment, although periodic monitoring during long-term treatment is advisable (26). Pasireotide is a second-generation somatostatin receptor ligand that is administered subcutaneously twice daily (2728) or intramuscularly once a month (2931). In a 12-­month extension of a Phase III study evaluating the long-term efficacy of long-acting pasireotide, 53.1% of patients had normalized mUFC at study completion (median treatment duration 23.9 months), with the most common AEs being related to hyperglycemia (21). The differences in duration and design of these studies prevent a meaningful comparison of the long-term efficacy of medical treatments for Cushing’s disease.

The extension period of LINC 4 was initially planned to run to week 96; however, in agreement with the FDA, a protocol amendment was approved that resulted in approximately half of the patients completing the extension phase between weeks 72 and 96. We also acknowledge the potential for selection bias for patients who experienced the greatest clinical benefit during the 48-week core study; however, over 80% of patients chose to continue osilodrostat treatment after consenting to take part in the extension.

Conclusions

During the LINC 4 extension period, osilodrostat provided long-term control of cortisol excretion, accompanied by sustained improvements in clinical symptoms, physical manifestations of hypercortisolism and QoL. The safety profile was favorable. These data provide further evidence of the durable clinical benefit of long-term osilodrostat treatment in patients with persistent, recurrent or de novo Cushing’s disease.

Data availability statement

The datasets generated and analyzed during the current study are not publicly available but are available from the corresponding author on reasonable request. Recordati Rare Diseases will share the complete de-identified patient dataset, study protocol, statistical analysis plan, and informed consent form upon request, effective immediately following publication, with no end date.

Ethics statement

The studies involving human participants were reviewed and approved by an independent ethics committee/institutional review board at each study site. The patients/participants provided their written informed consent to participate in this study.

Author contributions

The study steering committee (PS, AH, RF, and RA), AP, and the funder designed the study. AH, MG, MB, PW, ZB, AT, and PS enrolled patients in the study. Data were collected by investigators of the LINC 4 Study Group using the funder’s data management systems. MP and the funder’s statistical team analyzed the data. A data-sharing and kick-off meeting was held with all authors and an outline prepared by a professional medical writer based on interpretation provided by the authors. Each new draft of the manuscript subsequently prepared by the medical writer was reviewed and revised in line with direction and feedback from all authors. All authors contributed to the article and approved the submitted version.

Funding

This study was funded by Novartis Pharma AG; however, on July 12, 2019, osilodrostat became an asset of Recordati. Financial support for medical editorial assistance was provided by Recordati.

Acknowledgments

We thank all the investigators, nurses, study coordinators and patients who participated in the trial. We thank Catherine Risebro, PhD of Mudskipper Business Ltd for medical editorial assistance with this manuscript.

Conflict of interest

Author MG has received speaker fees from Recordati, Ipsen, Crinetics Pharmaceuticals, and Novo Nordisk and attended advisory boards for Novo Nordisk, Recordati, Ipsen, and Crinetics Pharmaceuticals. Author PS reports consultancy for Teva Pharmaceuticals. Author PW reports receiving travel grants and speaker fees from Novartis, Ipsen, Recordati, Novo Nordisk, Strongbridge Biopharma now Xeris Pharmaceuticals, and Lilly. Author MB reports receiving travel grants from Novartis, Ipsen, and Pfizer and consultancy for Novartis. Author ZB has nothing to disclose. Author AT reports consultancy for CinCor and PhaseBio. Author RF reports consultancy for HRA Pharma and Recordati and a research grant from Corcept Therapeutics. Author AH reports speaker fees from Chiasma and Ipsen and has been an advisor to Strongbridge Biopharma now Xeris Pharmaceuticals, Novo Nordisk, and Lundbeck Pharma. Author MP is employed by the company Novartis Pharma AG. Author AP was employed by the company Recordati AG at the time of manuscript development. Author RA reports grants and personal fees from Xeris Pharmaceuticals, Spruce Biosciences, Neurocrine Biosciences, Corcept Therapeutics, Diurnal Ltd, Sparrow Pharmaceuticals, and Novartis and personal fees from Adrenas Therapeutics, Janssen Pharmaceuticals, Quest Diagnostics, Crinetics Pharmaceuticals, PhaseBio Pharmaceuticals, H Lundbeck A/S, Novo Nordisk, and Recordati Rare Diseases.

Publisher’s note

All claims expressed in this article are solely those of the authors and do not necessarily represent those of their affiliated organizations, or those of the publisher, the editors and the reviewers. Any product that may be evaluated in this article, or claim that may be made by its manufacturer, is not guaranteed or endorsed by the publisher.

Supplementary material

The Supplementary Material for this article can be found online at: https://www.frontiersin.org/articles/10.3389/fendo.2023.1236465/full#supplementary-material

References

1. Lacroix A, Feelders RA, Stratakis CA, Nieman LK. Cushing’s syndrome. Lancet (2015) 386:913–27. doi: 10.1016/S0140-6736(14)61375-1

PubMed Abstract | CrossRef Full Text | Google Scholar

2. Feelders RA, Pulgar SJ, Kempel A, Pereira AM. The burden of Cushing’s disease: clinical and health-related quality of life aspects. Eur J Endocrinol (2012) 167:311–26. doi: 10.1530/eje-11-1095

PubMed Abstract | CrossRef Full Text | Google Scholar

3. Coelho MC, Santos CV, Vieira Neto L, Gadelha MR. Adverse effects of glucocorticoids: coagulopathy. Eur J Endocrinol (2015) 173:M11–21. doi: 10.1530/EJE-15-0198

PubMed Abstract | CrossRef Full Text | Google Scholar

4. Pivonello R, De Leo M, Cozzolino A, Colao A. The treatment of Cushing’s disease. Endocr Rev (2015) 36:385–486. doi: 10.1210/er.2013-1048

PubMed Abstract | CrossRef Full Text | Google Scholar

5. Tritos NA, Biller BMK. Current management of Cushing’s disease. J Intern Med (2019) 286:526–41. doi: 10.1111/joim.12975

PubMed Abstract | CrossRef Full Text | Google Scholar

6. Fleseriu M, Auchus R, Bancos I, Ben-Shlomo A, Bertherat J, Biermasz NR, et al. Consensus on diagnosis and management of Cushing’s disease: a guideline update. Lancet Diabetes Endocrinol (2021) 9:847–75. doi: 10.1016/S2213-8587(21)00235-7

PubMed Abstract | CrossRef Full Text | Google Scholar

7. Fleseriu M, Biller BMK, Bertherat J, Young J, Hatipoglu B, Arnaldi G, et al. Long-term efficacy and safety of osilodrostat in Cushing’s disease: final results from a Phase II study with an optional extension phase (LINC 2). Pituitary (2022) 25:959–70. doi: 10.1007/s11102-022-01280-6

PubMed Abstract | CrossRef Full Text | Google Scholar

8. Fleseriu M, Newell-Price J, Pivonello R, Shimatsu A, Auchus RJ, Scaroni C, et al. Long-term outcomes of osilodrostat in Cushing’s disease: LINC 3 study extension. Eur J Endocrinol (2022) 187:531–41. doi: 10.1530/EJE-22-0317

PubMed Abstract | CrossRef Full Text | Google Scholar

9. Recordati Rare Diseases. Isturisa (osilodrostat) tablets, for oral use, prescribing information (2020). Available at: https://www.isturisa.com/pdf/isturisa-prescribing-information.pdf. (Accessed February 2021).

Google Scholar

10. Recordati Rare Diseases. Isturisa® Japan prescribing information (2021). Available at: https://www.pmda.go.jp/PmdaSearch/iyakuDetail/GeneralList/24990A5/. (Accessed August 2021).

Google Scholar

11. Recordati Rare Diseases. Osilodrostat summary of product characteristics (2020). Available at: https://www.ema.europa.eu/en/documents/product-information/isturisa-epar-product-information_en.pdf. (Accessed February 2021).

Google Scholar

12. Swissmedic. Isturisa®, Filmtabletten (Osilodrostatum) (2020). Available at: https://www.swissmedic.ch/swissmedic/en/home/humanarzneimittel/authorisations/new-medicines/isturisa_filmtablette_osilodrostatum.html. (Accessed October 2021).

Google Scholar

13. Gadelha M, Bex M, Feelders RA, Heaney AP, Auchus RJ, Gilis-Januszewska A, et al. Randomized trial of osilodrostat for the treatment of Cushing’s disease. J Clin Endocrinol Metab (2022) 107:e2882–95. doi: 10.1210/clinem/dgac178

PubMed Abstract | CrossRef Full Text | Google Scholar

14. Pivonello R, Fleseriu M, Newell-Price J, Bertagna X, Findling J, Shimatsu A, et al. Efficacy and safety of osilodrostat in patients with Cushing’s disease (LINC 3): a multicentre Phase III study with a double-blind, randomised withdrawal phase. Lancet Diabetes Endocrinol (2020) 8:748–61. doi: 10.1016/S2213-8587(20)30240-0

PubMed Abstract | CrossRef Full Text | Google Scholar

15. Fleseriu M, Pivonello R, Elenkova A, Salvatori R, Auchus RJ, Feelders RA, et al. Efficacy and safety of levoketoconazole in the treatment of endogenous Cushing’s syndrome (SONICS): a Phase 3, multicentre, open-label, single-arm trial. Lancet Diabetes Endocrinol (2019) 7:855–65. doi: 10.1016/S2213-8587(19)30313-4

PubMed Abstract | CrossRef Full Text | Google Scholar

16. Ceccato F, Zilio M, Barbot M, Albiger N, Antonelli G, Plebani M, et al. Metyrapone treatment in Cushing’s syndrome: a real-life study. Endocrine (2018) 62:701–11. doi: 10.1007/s12020-018-1675-4

PubMed Abstract | CrossRef Full Text | Google Scholar

17. Newell-Price J, Pivonello R, Tabarin A, Fleseriu M, Witek P, Gadelha MR, et al. Use of late-night salivary cortisol to monitor response to medical treatment in Cushing’s disease. Eur J Endocrinol (2020) 182:207–17. doi: 10.1530/EJE-19-0695

PubMed Abstract | CrossRef Full Text | Google Scholar

18. Plat L, Leproult R, L’Hermite-Baleriaux M, Fery F, Mockel J, Polonsky KS, et al. Metabolic effects of short-term elevations of plasma cortisol are more pronounced in the evening than in the morning. J Clin Endocrinol Metab (1999) 84:3082–92. doi: 10.1210/jcem.84.9.5978

PubMed Abstract | CrossRef Full Text | Google Scholar

19. Fleseriu M, Auchus RJ, Snyder PJ, Lacroix A, Heaney AP, Geer EB, et al. Effect of dosing and titration of osilodrostat on efficacy and safety in patients with Cushing’s disease (CD): results from two Phase III trials (LINC3 and LINC4). Endocrine Practice (2021) 27(6 Suppl):S112 (abst 999926). doi: 10.1016/j.eprac.2021.04.707

CrossRef Full Text | Google Scholar

20. Castinetti F, Guignat L, Giraud P, Muller M, Kamenicky P, Drui D, et al. Ketoconazole in Cushing’s disease: is it worth a try? J Clin Endocrinol Metab (2014) 99:1623–30. doi: 10.1210/jc.2013-3628

PubMed Abstract | CrossRef Full Text | Google Scholar

21. Fleseriu M, Petersenn S, Biller BMK, Kadioglu P, De Block C, T’Sjoen G, et al. Long-term efficacy and safety of once-monthly pasireotide in Cushing’s disease: a Phase III extension study. Clin Endocrinol (Oxf) (2019) 91:776–85. doi: 10.1111/cen.14081

PubMed Abstract | CrossRef Full Text | Google Scholar

22. Nieman LK, Boscaro M, Scaroni CM, Deutschbein T, Mezosi E, Driessens N, et al. Metyrapone treatment in endogenous Cushing’s syndrome: results at week 12 from PROMPT, a prospective international multicenter, open-label, Phase III/IV study. J Endocr Soc (2021) 5(Suppl 1):A515. doi: 10.1210/jendso/bvab048.1053

CrossRef Full Text | Google Scholar

23. Nieman L, Boscaro M, Carla S, Deutschbein T, Mezosi E, Driessens N, et al. Metyrapone treatment in endogenous Cushing’s syndrome. Long term efficacy and safety results of the extension of the phase III/IV study PROMPT. Endocrine Abstracts (2021) 73:OC3. doi: 10.1530/endoabs.73.OC3.3

CrossRef Full Text | Google Scholar

24. Gadelha MR, Wildemberg LE, Shimon I. Pituitary acting drugs: cabergoline and pasireotide. Pituitary (2022) 25:722–5. doi: 10.1007/s11102-022-01238-8

PubMed Abstract | CrossRef Full Text | Google Scholar

25. HRA Pharma Rare Diseases. Metopirone® capsules 250 mg summary of product characteristics (1998). Available at: https://www.medicines.org.uk/emc/medicine/26460. (Accessed February 2021).

Google Scholar

26. Fleseriu M, Auchus RJ, Greenman Y, Zacharieva S, Geer EB, Salvatori R, et al. Levoketoconazole treatment in endogenous Cushing’s syndrome: extended evaluation of clinical, biochemical, and radiologic outcomes. Eur J Endocrinol (2022) 187:859–71. doi: 10.1530/EJE-22-0506

PubMed Abstract | CrossRef Full Text | Google Scholar

27. Recordati Rare Diseases. Signifor® (pasireotide) injection for subcutaneous use prescribing information (2012). Available at: https://signifor.com/wp-content/themes/signifor/dist/pdf/signifor-pi.pdf. (Accessed October 2021).

Google Scholar

28. Recordati Rare Diseases. Signifor summary of product characteristics (2012). Available at: https://www.medicines.org.uk/emc/product/4200/smpc. (Accessed October 2021).

Google Scholar

29. Recordati Rare Diseases. Signifor LAR summary of product characteristics (2012). Available at: https://www.medicines.org.uk/emc/product/1932/smpc. (Accessed October 2021).

Google Scholar

30. Recordati Rare Diseases. Signifor® LAR (pasireotide) for injectable suspension, for intramuscular use (2012). Available at: https://www.signiforlar.com/wp-content/themes/signifor-lar-theme/dist/pdf/signifor-lar-pi.pdf. (Accessed October 2021).

Google Scholar

31. Lacroix A, Gu F, Gallardo W, Pivonello R, Yu Y, Witek P, et al. Efficacy and safety of once-monthly pasireotide in Cushing’s disease: a 12 month clinical trial. Lancet Diabetes Endocrinol (2018) 6:17–26. doi: 10.1016/S2213-8587(17)30326-1

PubMed Abstract | CrossRef Full Text | Google Scholar

Keywords: Cushing’s disease, osilodrostat, hypercortisolism, 11β-hydroxylase, long-term treatment

Citation: Gadelha M, Snyder PJ, Witek P, Bex M, Belaya Z, Turcu AF, Feelders RA, Heaney AP, Paul M, Pedroncelli AM and Auchus RJ (2023) Long-term efficacy and safety of osilodrostat in patients with Cushing’s disease: results from the LINC 4 study extension. Front. Endocrinol. 14:1236465. doi: 10.3389/fendo.2023.1236465

Received: 07 June 2023; Accepted: 28 July 2023;
Published: 23 August 2023.

Edited by:

Fabienne Langlois, Centre Hospitalier Universitaire de Sherbrooke, Canada

Reviewed by:

Filippo Ceccato, University of Padua, Italy
Kevin Choong Ji Yuen, Barrow Neurological Institute (BNI), United States

Copyright © 2023 Gadelha, Snyder, Witek, Bex, Belaya, Turcu, Feelders, Heaney, Paul, Pedroncelli and Auchus. This is an open-access article distributed under the terms of the Creative Commons Attribution License (CC BY). The use, distribution or reproduction in other forums is permitted, provided the original author(s) and the copyright owner(s) are credited and that the original publication in this journal is cited, in accordance with accepted academic practice. No use, distribution or reproduction is permitted which does not comply with these terms.

*Correspondence: Mônica Gadelha, mgadelha@hucff.ufrj.br

Present address: Alberto M. Pedroncelli, Camurus AB, Lund, Sweden

Disclaimer: All claims expressed in this article are solely those of the authors and do not necessarily represent those of their affiliated organizations, or those of the publisher, the editors and the reviewers. Any product that may be evaluated in this article or claim that may be made by its manufacturer is not guaranteed or endorsed by the publisher.

From https://www.frontiersin.org/articles/10.3389/fendo.2023.1236465/full

Adults with Cushing’s Syndrome Report High Burden Of Illness, Despite Ongoing Treatment

Key takeaways:

  • Cushing’s syndrome symptoms moderately impact quality of life for adults with the condition.
  • Weight gain, muscle fatigue and menstrual changes decline in severity from diagnosis to follow-up.

Adults with endogenous Cushing’s syndrome reported that the condition moderately affects their quality of life and causes them to have symptoms about 16 days in a given month, according to findings published in Pituitary.

“Our study aimed to evaluate the ongoing burden of Cushing’s syndrome in order to identify areas of unmet need,” Eliza B. Geer, MD, medical director of the Multidisciplinary Pituitary and Skull Base Tumor Center and associate attending of endocrinology and neurosurgery at Memorial Sloan Kettering Cancer Center, told Healio. “We found that patients with treated Cushing’s continue to experience ongoing symptoms more than half of the days in a given month, miss about 25 workdays per year and need twice the average number of outpatient visits per year, indicating a significant impact on daily function and work productivity. Some of these symptoms, like fatigue and pain, have not been well studied in Cushing’s patients, and need more attention.”

Geer and colleagues administered a cross-sectional survey to 55 adults aged 21 years and older who had been diagnosed with Cushing’s syndrome at least 6 months before the survey and were receiving at least one pharmacologic therapy for their disease (85% women; mean age, 43.4 years). The survey was conducted online from June to August 2021. Five patient-reported outcome scales were included. The CushingQoL was used to analyze quality of life, a visual analog scale was included to assess pain, the Brief Fatigue Inventory was used to measure fatigue, the Sleep Disturbance v1.0 scale assessed perceptions of sleep and the PROMIS Short Form Anxiety v1.0-8a scale was used to measure fear, anxious misery, hyperarousal and somatic symptoms related to arousal. Participants self-reported the impact of Cushing’s syndrome on daily life and their physician’s level of awareness of Cushing’s syndrome.

Some symptoms decline in severity over time

Of the study group, 81% had pituitary or adrenal tumors, and 20% had ectopic adrenocorticotropic hormone-producing tumors; 80% of participants underwent surgery to treat their Cushing’s syndrome.

The frequency of reported symptoms did not change from Cushing’s syndrome diagnosis to the time of the survey. The most frequently reported symptoms were weight gain, muscle fatigue and weakness and anxiety.

Participants reported a decline in symptom severity for weight gain, muscle fatigue and weakness and menstrual changes from diagnosis to the survey. Though symptom severity declined, none of the three symptoms were entirely eliminated. Adults did not report declines in severity for other symptoms. Hirsutism and anxiety were reported by few participants, but were consistently scored high in severity among those who reported it. There were no changes in patient satisfaction with medications from their first appointment to the time of the survey.

“It was surprising that anxiety and pain did not improve with treatment,” Geer said. “A quarter of patients at baseline reported anxiety and this percentage was exactly the same after treatment. Same for pain — nearly a quarter of patients reported pain despite treatment. While the presence of anxiety has been well-documented in Cushing’s patients, pain has not, and needs further study.”

Nearly half of primary care providers unable to diagnose Cushing’s syndrome

All participants reported having at least one challenge with being diagnosed with Cushing’s syndrome. Of the respondents, 49% said their primary care provider was unable to diagnose their Cushing’s syndrome and 33% initially received the wrong diagnosis. Physicians referred 49% of participants to a specialist, and 39% of adults said their doctor lacked knowledge or understanding of their condition.

The study group had a moderate level of quality of life impairment as assessed through the CushingQoL scale. The mean pain score was 3.6 of a possible 10, indicating low levels of pain. Moderate to severe levels of fatigue were reported by 69% of participants. Self-reported sleep and anxiety scores were similar to what is observed in the general population.

Participants said sexual activity, self-confidence and life satisfaction were most impacted by a Cushing’s syndrome diagnosis. Adults experienced symptoms a mean 16 days in a typical month and saw their outpatient physician an average of six times per year. Those who were employed said they miss 2 days of work per month, or about 25 days per year, due to Cushing’s syndrome.

“Longitudinal assessment of clinically relevant patient-reported outcomes based on validated measures and coupled with biochemical and treatment data is needed in a large cohort of Cushing’s patients,” Geer said. “This will allow us to identify clinically meaningful changes in symptom burden within each patient, as well as predictors of outcomes — which patients improve on which symptoms, and which patients do not feel better despite biochemical normalization. We need to improve our ability to help our patients feel better, not just achieve normal cortisol levels.”

For more information:

Eliza B. Geer, MD, can be reached at geere@mskcc.org.

From https://www.healio.com/news/endocrinology/20230830/adults-with-cushings-syndrome-report-high-burden-of-illness-despite-ongoing-treatment

Association of IGF-1 Level with Low Bone Mass in Young Patients with Cushing’s Disease

Abstract

Purpose. Few related factors of low bone mass in Cushing’s disease (CD) have been identified so far, and relevant sufficient powered studies in CD patients are rare. On account of the scarcity of data, we performed a well-powered study to identify related factors associated with low bone mass in young CD patients.

Methods. This retrospective study included 153 CD patients (33 males and 120 females, under the age of 50 for men and premenopausal women). Bone mineral density (BMD) of the left hip and lumbar spine was measured by dual energy X-ray absorptiometry (DEXA). In this study, low bone mass was defined when the Z score was −2.0 or lower. Results. Among those CD patients, low bone mass occurred in 74 patients (48.37%). Compared to patients with normal BMD, those patients with low bone mass had a higher level of serum cortisol at midnight (22.31 (17.95-29.62) vs. 17.80 (13.75-22.77), ), testosterone in women (2.10 (1.33–2.89) vs. 1.54 (0.97–2.05), ), higher portion of male (32.43% vs. 11.54%, ) as well as hypertension (76.12% vs. 51.67%, ), and lower IGF-1 index (0.59 (0.43–0.76) vs. 0.79 (0.60–1.02), ). The Z score was positively associated with the IGF-1 index in both the lumbar spine (r = 0.35153, ) and the femoral neck (r = 0.24418, ). The Z score in the femoral neck was negatively associated with osteocalcin (r = −0.22744, ). Compared to the lowest tertile of the IGF-1 index (<0.5563), the patients with the highest tertile of the IGF-1 index (≥0.7993) had a lower prevalence of low bone mass (95% CI 0.02 (0.001–0.50), ), even after adjusting for confounders such as age, gender, duration, BMI, hypertension, serum cortisol at midnight, PTH, and osteocalcin.

Conclusions. The higher IGF-1 index was independently associated with lower prevalence of low bone mass in young CD patients, and IGF-1 might play an important role in the pathogenesis of CD-caused low bone mass.

1. Introduction

Cushing’s disease (CD), caused by an adrenocorticotropic hormone (ACTH)-secreting pituitary tumor, is a rare disease with approximately 1.2 to 2.4 new cases per million people each year [1].

Osteoporosis has been recognized as a serious consequence of endogenous hypercortisolism since the first description in 1932 [2]. The prevalence of osteoporosis is around 38–50%, and the rate of atraumatic compression fractures is 15.8% in CD patients [3]. After cortisol normalization and appropriate treatment, recovery of the bone impairment occurs slowly (6–9 years) and partially [45]. Hypercortisolemia impairs bone quality through multiple mechanisms [6]. Growth hormone (GH) and insulin-like growth factor 1 (IGF-1) play a crucial role in bone growth and development [7]. IGF-1 is considered essential for the longitudinal growth of bone, skeletal maturity, and bone mass acquisition not only during growth but also in the maintenance of bone in adults [8]. Previous research studies revealed that low serum IGF-1 levels were associated with a 40% increased risk of fractures [910], and serum IGF-1 levels could be clinically useful for evaluating the risk of spinal fractures [11]. In Marl Hotta’s research, extremely low or no response of plasma GH to recombinant human growth hormone (hGRH) injection was noted in CD patients. This result suggested that the diminished hGRH-induced GH secretion in patients with Cushing’s syndrome might be caused by the prolonged period of hypercortisolemia [12]. Other surveys indicated that glucocorticoids, suppressing GH–IGF-1 and the hypothalamic-pituitary-gonadal axes, lead to decreased number and dysfunction of osteoblast [13].

However, the exact mechanism is still unclear, and few risk factors for osteoporosis in CD have been identified so far. Until now, relevant and sufficiently powered studies in CD patients have been rare [1415]. Early recognition of the changes in bone mass in CD patients contributes to early diagnosis of bone mass loss and prompt treatment, which could help minimize the incidence of adverse events such as fractures.

On account of the scarcity of data and pressing open questions concerning risk evaluation and management of osteoporosis, we performed a well-powered study to identify the related factors associated with low bone mass in young CD patients at the time of diagnosis.

2. Materials and Methods

2.1. Subjects

This retrospective study enrolled 153 CD patients (33 males and 120 females) from the Department of Endocrinology and Metabolism of Huashan Hospital between January 2010 and February 2021. All subjects were evaluated by the same group of endocrinologists for detailed clinical evaluation. This study, which was in complete adherence to the Declaration of Helsinki, was approved by the Human Investigation Ethics Committee at Huashan Hospital, Fudan University (No. 2017M011). We collected data on demographic characteristics, laboratory tests, and bone mineral density.

Inclusion criteria included the following: (1) willingness to participate in the study; (2) premenopausal women ≥18 years old, men ≥18 years old but younger than 50 years old, and young women (<50 years old) with menstrual abnormalities who were associated with CD after excluding menstrual abnormalities caused by other causes; (3) diagnosis of CD according to the updated diagnostic criteria [16]; and (4) pathological confirmation after transsphenoidal surgery (positive immunochemistry staining with ACTH). Exclusion criteria included Cushing’s syndrome other than pituitary origin.

2.2. Clinical and Biochemical Methods

IGF-1 was measured using the Immulite 2000 enzyme-labeled chemiluminescent assay (Siemens Healthcare Diagnostic, Surrey, UK). Other endocrine hormones, including cortisol (F), 24-hour urinary free cortisol (24hUFC), adrenocorticotropic hormone (ACTH), prolactin (PRL), luteinizing hormone (LH), follicle stimulating hormone (FSH), estrogen (E2), progesterone (P), testosterone (T), thyroid stimulating hormone (TSH), and free thyroxine (FT4), were carried out by the chemiluminescence assay (Advia Centaur CP). Intra-assay and interassay coefficients of variation were less than 8 and 10%, respectively, for the estimation of all hormones.

Bone metabolism markers included osteocalcin (OC), type I procollagen amino-terminal peptide (P1NP), parathyroid hormone (PTH), and 25-hydroxyvitamin D (25(OH)VD), measured in a Roche Cobas e411 analyzer using immunometric assays (Roche Diagnostics, Indianapolis, IN, USA).

The IGF-1 index was defined as the ratio of the measured value to the respective upper limit of the reference range for age and sex. Body mass index (BMI) was calculated using the following formula: weight (kg)/height2 (m2). The bone mineral density (BMD) measuring instrument was Discovery type W dual energy X-ray absorptiometry from the American HOLOGIC company. Quality control tests were conducted every working day. Before examination, the date of birth, height, weight, and menopause date of the examiner were accurately recorded, and then BMD (g/cm2) of the left hip and lumbar spine were measured by DEXA. Z value was used for premenopausal women and men younger than 50 years old, and Z-value = (measured value − mean bone mineral density of peers)/standard deviation of BMD of peers [1718]. In this study, low bone mass was defined as a Z-value of −2.0 or lower.

2.3. Statistical Analysis

The baseline characteristics were compared between CD patients with and without low bone mass by using the Student’s t-test for continuous variables and the χ2 test for category variables. Bone turnover markers, alanine aminotransferase (ALT), triglyceride (TG), IGF-1 index, thyroid stimulating hormone (TSH), free triiodothyronine (FT3), free thyroxine (FT4), testosterone (T), 24 hours of urine cortisol (24 h UFC), and serum cortisol at 8 a.m. (F8 am) and at midnight (F24 pm) were not in normal distribution, so variables mentioned above were Log10-transformed, which could be used as continuous variables during statistical analysis. Participants were categorized into three groups according to tertiles of the IGF-1 index: <0.5986, 0.5986–0.8380, and >0.8380. The linear trend across IGF-1 index tertiles was tested using linear regression analysis for continuous variables and the Cochran–Armitage test for categorical variables. We used a multivariate logistic regression model to identify related factors that are independently associated with the risk of low bone mass. Variables included in the multivariate logistic regression model were selected based on the Spearman rank correlation analysis and established traditional low bone mass risk factors as priors. The results were presented as odds ratios (OR) and the corresponding 95% confidence intervals (CI). Significance tests were two-tailed, with  value <0.05 considered statistically significant for all analyses. Statistical analysis was performed using SAS version 9.3 (SAS Institute Inc, Cary, NC, USA).

3. Results

3.1. The Prevalence of Low Bone Mass in Young Cushing’s Disease Patients

From the inpatient system of Huashan hospital, a total of 153 CD patients under the age of 50 for men and premenopausal women (some with menstrual abnormalities were associated with CD) were included, aged from 13 to 49 years, with an average age of 34.25 ± 8.39 years. There were 33 males (21.57%) and 120 females (78.43%). These CD patients included newly diagnosed CD, recurrences of CD, and CD without remission after treatment. There were no differences in the prevalence of different statuses of CD between the two groups (Table 1).

Table 1 
Clinical and biochemical preoperative characteristics of young Cushing’s disease patients according to status of bone mineral density at diagnosis.

Among these CD patients, low bone mass occurred in 74 patients (48.37%), including 24 men and 50 women. The prevalence of low bone mass was 41.67% and 72.73% in female and male CD patients, respectively, and 42 (56.76%) patients suffered from low bone mass in the lumbar spine only, while 10 (13.51%) patients had low bone mass in the femoral neck only, and 22 (29.73%) patients had low bone mass in both parts.

In female patients with low bone mass, 27 (54%) had low bone mass in the lumbar region only, 9 (18%) in the femoral neck only, and 14 (28%) had low bone mass in both parts. For male patients with low bone mass, 16 (66.67%) patients had low bone mass only in the lumbar region, and the rest (8, 33.33%) had low bone mass in both parts.

Ten patients had a history of fragility fractures (6 ribs, 3 vertebrae, 1 femoral neck, and ribs), and all of them achieved low bone mass in BMD.

3.2. Baseline Characteristics of Cushing’s Disease Patients with and without Low Bone Mass

These CD patients were divided into two groups with and without low bone mass (Table 1). Compared to patients without low bone mass, those low bone mass patients had a higher level of diastolic blood pressure (DBP) (97.07 ± 13.69 vs. 89.76 ± 13.43, ), serum creatinine (66.15 ± 24.33 vs. 55.90 ± 13.35, ), uric acid (0.36 ± 0.10 vs. 0.32 ± 0.10, ), cholesterol (5.57 ± 1.30 vs. 5.06 ± 1.47, ), testosterone in women (2.10 (1.33–2.89) vs. 1.54 (0.97–2.05), ), F24 pm (22.31 (17.95–29.62) vs. 17.80 (13.75–22.77), ), and higher portion of male (32.43% vs. 11.54%, ), as well as hypertension (76.12% vs. 51.67%, ). The low bone mass group had a lower IGF-1 index (0.59 (0.43–0.76) vs. 0.79 (0.60–1.02), ) and FT3 level (3.54 (3.16–4.04) vs. 3.98 (3.47–4.45), ) than those without low bone mass. CD patients without low bone mass were more likely to have serum IGF-1 above the upper limit of the normal reference range (ULN) with age-adjusted (18, 26.87% vs. 3, 4.84%, ). No differences of bone turnover makers were found between the two groups.

3.3. Association between Baseline Characteristics and BMD

Spearman’s rank correlation analysis was used to explore the related factors of low bone mass in young CD patients (Table 2). The results indicated that the Z score in the lumbar spine was positively associated with age at diagnosis (r = 0.18801, ), IGF-1 index (r = 0.35153, ), FT3 level (r = 0.24117, ), estradiol in women (r = 0.2361, ), and occurrence of normal menstruation in females (r = 0.2267, ). Meanwhile, SBP (r = −0.21575, ), DBP (r = −0.32538, ), ALT (r = −0.17477, ), serum creatinine (r = −0.36072, ), cholesterol (r = −0.20205, ), testosterone in women (r = −0.2700, ), F8 am (r = −0.18998, ), and serum cortisol at midnight (r = −0.27273, ) were negatively associated with the Z-score in the lumbar spine. The results also illustrated that the Z-score in the femoral neck was positively associated with BMI (r = 0.33926, ), IGF-1 index (r = 0.24418, ), FT3 level (r = 0.20487, ), and occurrence of normal menstruation in females (r = 0.2393, ). Serum creatinine (r = −0.1932, ), osteocalcin (r = −0.22744, ), and testosterone in women (r = −0.2363, ) were negatively associated with the Z-score in the femoral neck.

Table 2 
Spearman rank correlation of BMD and various variables in Cushing’s disease patients.
3.4. IGF-1 Index and Low Bone Mass

Participants were categorized into the following three groups according to tertiles of the preoperative IGF-1 index: <0.5986 (tertiles 1), 0.5986–0.8380 (tertiles 2), and >0.8380 (tertiles 3). With the IGF-1 index increasing, the level of PTH decreased (54.85 (38.35–66.2), 38.9 (26.6–66.9), 36 (25.5–47.05), and ), while other bone metabolism makers, including PINP, osteocalcin, and 25 (OH) VD, showed no differences among the three groups (Figures 1(a)1(d)). With the increase in the IGF-1 index level, the Z-score of both vertebra lumbalis (tertiles 1: −2.4 (−3.3∼−1.5); tertiles 2: −1.9 (−2.3∼−1.0); tertiles 3: −1.15 (−1.9∼−0.4), ) and the neck of femur (tertiles 1: −1.7 (−2.3∼−0.95); tertiles 2: −1.2 (−1.9∼−0.5); tertiles 3: −1.0 (−1.5∼−0.5), ) increased gradually (Figures 2(a) and 2(b)). Meanwhile, prevalence of low bone mass decreased (68.29%, 53.33%, 23.81%, ) (Figure 3(a)) both in the vertebra lumbalis (63.41%, 48.89%, 16.67%, ) and the neck of femur (32.5%, 11.11%, 11.19%, ), with the increasing of the IGF-1 index level (Figures 3(b) and 3(c)).

Figure 1 
Bone turnover makers in three groups according to tertiles of the preoperative IGF-1 index. Tertiles 1: <0.5986, tertiles 2: 0.5986–0.8380, and tertiles 3 >0.8380. a for PINP; b for osteocalcin; c for PTH; d for VD-OH25. (a) p for trend = 0.2601. (b) p for trend = 0.1310. (c) p for trend = 0.008. (d) p for trend = 0.7956.
Figure 2 
Z-score of both the neck of femur and the vertebra lumbalis in three tertiles of the IGF-1 index. a for the neck of femur; b for the vertebra lumbalis. Tertiles 1: <0.5986, tertiles 2: 0.5986–0.8380, and tertiles 3 >0.8380. (a) p for trend = 0.0148. (b) p for trend < 0.0001.
Figure 3 
Prevalence of low bone mass according to tertiles of the preoperative IGF-1 index. With increment of the IGF-1 index level, prevalence of low bone mass decreased, both in the vertebra lumbalis and neck of femur. Tertiles 1: <0.5986, tertiles 2: 0.5986–0.8380, and tertiles 3 >0.8380. (a) p for trend = 0.0002. (b) p for trend = 0.0169. (c) p for trend < 0.0001.

In the logistic regression analysis of the related factors of low bone mass, most of the potentially relevant factors were put into this model; only the IGF-1 index was still significantly negatively associated with the prevalence of low bone mass after adjusting for covariables. The results indicated that compared to the patients in the lowest tertile of the IGF-1 index (<0.5563), those with the highest tertile of the IGF-1 index (≥0.7993) had a lower prevalence of low bone mass (95% CI 0.16 (0.06–0.41), ). After adjusting for age, gender, and BMI, the patients in the highest tertile of the IGF-1 index still conferred a lower prevalence of low bone mass (95% CI 0.15 (0.06–0.42), ). The association between the IGF-1 index and low bone mass still existed (95% CI 0.02 (0.001–0.5), ) even after adjusting for age, gender, CD duration, BMI, hypertension, dyslipidemia, diabetes, ALT, Scr, FT3, F24 pm, PTH, and osteocalcin (Table 3). In comparison to the reference population, the participants in the middle tertile of the IGF-1 index (0.5563–0.7993) had no different risk of low bone mass.

Table 3 
Association between the preoperative IGF-1 index and the risk of low bone mass.

4. Discussion

Our results revealed that low bone mass occurred in around half of young CD patients, affecting more males than females, and mostly in the lumbar spine. The CD patients in our study had a high prevalence (48.37%) of low bone mass at the baseline. This was in accordance with the findings of previous research, and the reported prevalence of osteoporosis due to excess endogenous cortisol ranges from 22% to 59% [1925]. In this study, CD patients’ lumbar vertebrae were more severely affected than the neck of the femur. It is reported that lumbar vertebrae, containing more trabecular bone than femur neck, were more vulnerable to endogenous cortisol [26].

Our results also indicated that men were more prone to low bone mass than women in CD, which was in accordance with several other studies [232728]; possibly, the deleterious effect of cortisol excess on BMD might overrule the protective effects of sex hormones, and men were more often hypogonadal compared with women in CD patients. In our study, patients with low bone mass had a significantly higher level of F24 pm. Both cortisol levels in the morning and at midnight, were negatively associated with the Z-score of BMD in the lumbar spine at diagnosis. But these results were not seen in the femoral neck at diagnosis. This further indicated that lumbar vertebrae were more vulnerable to endogenous cortisol. BMI was considered to be associated with bone mass [29]. In our study, higher BMI was associated with higher BMD at diagnosis in the femur neck but not in the lumbar vertebrae, consistent with other studies [30].

Interestingly, besides the above known related factors, we also found that a higher level of the IGF-1 index was strongly associated with a lower prevalence of low bone mass, both in the vertebra lumbalis and the neck of the femur, independently of age, gender, duration, BMI, hypertension, dyslipidemia, diabetes, level of ALT, creatinine, FT3, and F24 pm. The IGF-1 index was also positively associated with the BMD Z-score, both in the lumbar spine and the femoral neck. So far, there have been few studies concerning the association between IGF-1 and low bone mass in Cushing’s disease patients. As we know, GH [3132] and IGF-1 [33] have been demonstrated to increase both bone formation (e.g., collagen synthesis) and bone resorption. However, in CD patients, glucocorticoids resulted in decreased number and dysfunction of osteoblasts by inhibiting GH-IGF-1 axes [3435]. In vitro studies suggested that at high concentrations of glucocorticoids, a decreased release of GHRH had been reported [3638]; therefore, GH-IGF-1 axes were inhibited. IGF-1 possessed anabolic mitogenic actions in osteoblasts while reducing the anabolic actions of TGF-β [39]. The decrease in IGF-1 might be a risk factor for low bone mass in CD patients. In vitro studies had also indicated that the suppressive effects of glucocorticoids on osteoblast function can be partially reversed by GH or IGF treatment [8]. In recent years, some studies have also shown that patients with untreated Cushing’s disease may have elevated IGF-1, and mildly elevated IGF-1 in Cushing’s disease does not imply pathological growth hormone excess. Higher IGF-1 levels could predict better outcomes in CD [4041]. Possible mechanisms were not clear, which might involve changes in IGF binding proteins (IGFBPs), interference in IGFBP fragments, IGF-1 synthesis or clearance, and/or the effects of hyperinsulinism induced by excess glucocorticoids. In our study, the results also showed that IGF-1 was an independent protective factor for low bone mass in CD patients.

Our study was one of the few well-powered research studies on the association of IGF-1 levels with low bone mass in young CD patients. These represented important strengths of our study, especially given the rarity of CD. The main limitation of this study was its retrospective nature. This could not prove causality. A prospective study should be conducted to explore the causality between IGF-1 and osteoporosis in CD patients. In addition, this study lacked morphometric data for spinal fractures in all patients, which may underestimate the incidence of fractures and osteoporosis. However, our study indicated that a lower IGF-1 index level was significantly associated with low bone mass in young CD patients, which might provide a new aspect to understand the possible risk factors and mechanism of osteoporosis in CD patients.

In conclusion, our study found that a higher IGF-1 index was independently and significantly associated with decreased prevalence of low bone mass in young CD patients, drawing attention to the role of IGF-1 in the pathogenesis of CD-caused low bone mass and may support the exploration of this pathway in therapeutic agent development in antiosteoporosis in CD.

Data Availability

The data used to support the findings of the study are available on request from the authors.

Additional Points

Through a retrospective study of a large sample of Cushing’s disease (CD) patients from a single center, we found that a higher IGF-1 index was independently associated with a lower prevalence of low bone mass in young CD patients and IGF-1 might play an important role in the pathogenesis of CD-caused low bone mass.

Disclosure

Wanwan Sun and Quanya Sun were the co-first authors.

Conflicts of Interest

The authors declare that they have no conflicts of interest.

Authors’ Contributions

Wanwan Sun analyzed the data and wrote the manuscript. Quanya Sun collected the data. Hongying Ye and Shuo Zhang conducted the study design and quality control. All authors read and approved the final manuscript. Wanwan Sun and Quanya Sun contributed equally to this work.

Acknowledgments

The present study was supported by grants from the initial funding of the Huashan Hospital (2021QD023). The study was also supported by grants from Multidisciplinary Diagnosis and Treatment (MDT) demonstration project in research hospitals (Shanghai Medical College, Fudan University, no: DGF501053-2/014).

References

  1. H. Nishioka and S. Yamada, “Cushing’s disease,” Journal of Clinical Medicine, vol. 8, no. 11, p. 1951, 2019.

    View at: Publisher Site | Google Scholar

  2. H. Cushing, “The basophil adenomas of the pituitary body and their clinical manifestations (pituitary basophilism),” Obesity Research, vol. 2, no. 5, pp. 486–508, 1994.

    View at: Publisher Site | Google Scholar

  3. R. A. Feelders, S. J. Pulgar, A. Kempel, and A. M. Pereira, “Management of endocrine disease: the burden of Cushing’s disease: clinical and health-related quality of life aspects,” European Journal of Endocrinology, vol. 167, no. 3, pp. 311–326, 2012.

    View at: Publisher Site | Google Scholar

  4. R. Pivonello, M. De Leo, A. Cozzolino, and A. Colao, “The treatment of Cushing’s disease,” Endocrine Reviews, vol. 36, no. 4, pp. 385–486, 2015.

    View at: Publisher Site | Google Scholar

  5. R. Pivonello, M. C. De Martino, M. De Leo, C. Simeoli, and A. Colao, “Cushing’s disease: the burden of illness,” Endocrine, vol. 56, no. 1, pp. 10–18, 2017.

    View at: Publisher Site | Google Scholar

  6. R. S. Hardy, H. Zhou, M. J. Seibel, and M. S. Cooper, “Glucocorticoids and bone: consequences of endogenous and exogenous excess and replacement therapy,” Endocrine Reviews, vol. 39, no. 5, pp. 519–548, 2018.

    View at: Publisher Site | Google Scholar

  7. R. Bouillon and A. Prodonova, “Growth hormone deficiency and peak bone mass: laboratory for experimental medicine and Endocrinology, catholic university of leuven, gasthuisberg, leuven, Belgium,” Journal of Pediatric Endocrinology and Metabolism, vol. 13, no. s2, pp. 1327–1342, 2000.

    View at: Publisher Site | Google Scholar

  8. A. Giustina, G. Mazziotti, and E. Canalis, “Growth hormone, insulin-like growth factors, and the skeleton,” Endocrine Reviews, vol. 29, no. 5, pp. 535–559, 2008.

    View at: Publisher Site | Google Scholar

  9. T. Sugimoto, K. Nishiyama, F. Kuribayashi, and K. Chihara, “Serum levels of insulin-like growth factor (IGF) I, IGF-binding protein (IGFBP)-2, and IGFBP-3 in osteoporotic patients with and without spinal fractures,” Journal of Bone and Mineral Research, vol. 12, no. 8, pp. 1272–1279, 1997.

    View at: Publisher Site | Google Scholar

  10. P. Garnero, E. Sornay-Rendu, and P. D. Delmas, “Low serum IGF-1 and occurrence of osteoporotic fractures in postmenopausal women,” The Lancet, vol. 355, no. 9207, pp. 898-899, 2000.

    View at: Publisher Site | Google Scholar

  11. C. Ohlsson, D. Mellström, D. Carlzon et al., “Older men with low serum IGF-1 have an increased risk of incident fractures: the MrOS Sweden study,” Journal of Bone and Mineral Research, vol. 26, no. 4, pp. 865–872, 2011.

    View at: Publisher Site | Google Scholar

  12. M. Hotta, T. Shibasaki, A. Masuda et al., “Effect of human growth hormone-releasing hormone on GH secretion in Cushing’s syndrome and non-endocrine disease patients treated with glucocorticoids,” Life Sciences, vol. 42, no. 9, pp. 979–984, 1988.

    View at: Publisher Site | Google Scholar

  13. L. T. Braun and M. Reincke, “The effect of biochemical remission on bone metabolism in Cushing’s syndrome: a 2-year follow-up study,” Journal of Bone and Mineral Research, vol. 36, no. 11, pp. 2281-2282, 2021.

    View at: Publisher Site | Google Scholar

  14. I. Kanazawa, T. Yamaguchi, M. Yamamoto, M. Yamauchi, S. Yano, and T. Sugimoto, “Serum insulin-like growth factor-I level is associated with the presence of vertebral fractures in postmenopausal women with type 2 diabetes mellitus,” Osteoporosis International, vol. 18, no. 12, pp. 1675–1681, 2007.

    View at: Publisher Site | Google Scholar

  15. A. Scillitani, G. Mazziotti, C. Di Somma et al., “Treatment of skeletal impairment in patients with endogenous hypercortisolism: when and how?” Osteoporosis International, vol. 25, no. 2, pp. 441–446, 2014.

    View at: Publisher Site | Google Scholar

  16. M. Fleseriu, R. Auchus, I. Bancos et al., “Consensus on diagnosis and management of Cushing’s disease: a guideline update,” Lancet Diabetes and Endocrinology, vol. 9, no. 12, pp. 847–875, 2021.

    View at: Publisher Site | Google Scholar

  17. J. M. Liu, D. L. Zhu, Y. M. Mu, and W. B. Xia, “Chinese Society of Osteoporosis and Bone Mineral Research, the Chinese Society of Endocrinology, Chinese Diabetes Society, Chinese Medical Association; Chinese Endocrinologist Association, Chinese Medical Doctor Association,” Management of fracture risk in patients with diabetes-Chinese Expert Consensus Journal of Diabetes, vol. 11, pp. 906–919, 2019.

    View at: Google Scholar

  18. P. M. Camacho, S. M. Petak, N. Binkley et al., “American association of clinical endocrinologists and American college of endocrinology clinical practice guidelines for the diagnosis and treatment of postmenopausal OSTEOPOROSIS-2020 update,” Endocrine Practice, vol. 26, no. 1, pp. 1–46, 2020.

    View at: Publisher Site | Google Scholar

  19. C. V. dos Santos, L. Vieira Neto, M. Madeira et al., “Bone density and microarchitecture in endogenous hypercortisolism,” Clinical Endocrinology, vol. 83, no. 4, pp. 468–474, 2015.

    View at: Publisher Site | Google Scholar

  20. N. Ohmori, K. Nomura, K. Ohmori, Y. Kato, T. Itoh, and K. Takano, “Osteoporosis is more prevalent in adrenal than in pituitary Cushing’s syndrome,” Endocrine Journal, vol. 50, no. 1, pp. 1–7, 2003.

    View at: Publisher Site | Google Scholar

  21. M. E. Randazzo, E. Grossrubatscher, P. Dalino Ciaramella, A. Vanzulli, and P. Loli, “Spontaneous recovery of bone mass after cure of endogenous hypercortisolism,” Pituitary, vol. 15, no. 2, pp. 193–201, 2012.

    View at: Publisher Site | Google Scholar

  22. L. Tauchmanovà, R. Pivonello, C. Di Somma et al., “Bone demineralization and vertebral fractures in endogenous cortisol excess: role of disease etiology and gonadal status,” Journal of Clinical Endocrinology and Metabolism, vol. 91, no. 5, pp. 1779–1784, 2006.

    View at: Publisher Site | Google Scholar

  23. E. Valassi, A. Santos, M. Yaneva et al., “The European Registry on Cushing’s syndrome: 2-year experience. Baseline demographic and clinical characteristics,” European Journal of Endocrinology, vol. 165, no. 3, pp. 383–392, 2011.

    View at: Publisher Site | Google Scholar

  24. L. Trementino, G. Appolloni, L. Ceccoli et al., “Bone complications in patients with Cushing’s syndrome: looking for clinical, biochemical, and genetic determinants,” Osteoporosis International, vol. 25, no. 3, pp. 913–921, 2014.

    View at: Publisher Site | Google Scholar

  25. A. W. van der Eerden, M. den Heijer, W. J. Oyen, and A. R. Hermus, “Cushing’s syndrome and bone mineral density: lowest Z scores in young patients,” The Netherlands Journal of Medicine, vol. 65, no. 4, pp. 137–141, 2007.

    View at: Google Scholar

  26. P. G. Lacativa and M. L. F. Farias, “Office practice of osteoporosis evaluation,” Arquivos Brasileiros de Endocrinologia and Metabologia, vol. 50, no. 4, pp. 674–684, 2006.

    View at: Publisher Site | Google Scholar

  27. L. H. A. Broersen, F. M. van Haalen, T. Kienitz et al., “Sex differences in presentation but not in outcome for ACTH-dependent Cushing’s syndrome,” Frontiers in Endocrinology, vol. 10, p. 580, 2019.

    View at: Publisher Site | Google Scholar

  28. F. P. Giraldi, M. Moro, and F. Cavagnini, “Gender-related differences in the presentation and course of Cushing’s disease,” Journal of Clinical Endocrinology and Metabolism, vol. 88, no. 4, pp. 1554–1558, 2003.

    View at: Publisher Site | Google Scholar

  29. S. Morin, J. F. Tsang, and W. D. Leslie, “Weight and body mass index predict bone mineral density and fractures in women aged 40 to 59 years,” Osteoporosis International, vol. 20, no. 3, pp. 363–370, 2009.

    View at: Publisher Site | Google Scholar

  30. M. Zilio, M. Barbot, F. Ceccato et al., “Diagnosis and complications of Cushing’s disease: gender-related differences,” Clinical Endocrinology, vol. 80, no. 3, pp. 403–410, 2014.

    View at: Publisher Site | Google Scholar

  31. G. Amato, C. Carella, S. Fazio, G. La Montagna, A. Cittadini, and D. Sabatini, “Body composition, bone metabolism, and heart structure and function in growth hormone (GH)-deficient adults before and after GH replacement therapy at low doses,” Journal of Clinical Endocrinology and Metabolism, vol. 77, no. 6, pp. 1671–1676, 1993.

    View at: Publisher Site | Google Scholar

  32. S. A. Beshyah, E. Thomas, P. Kyd, P. Sharp, A. Fairney, and D. G. Johnston, “The effect of growth hormone replacement therapy in hypopituitary adults on calcium and bone metabolism,” Clinical Endocrinology, vol. 40, no. 3, pp. 383–391, 2010.

    View at: Publisher Site | Google Scholar

  33. P. R. Ebeling, J. D. Jones, W. M. O’Fallon, C. H. Janes, and B. L. Riggs, “Short-term effects of recombinant human insulin-like growth factor I on bone turnover in normal women,” Journal of Clinical Endocrinology and Metabolism, vol. 77, no. 5, pp. 1384–1387, 1993.

    View at: Publisher Site | Google Scholar

  34. G. Mazziotti and A. Giustina, “Glucocorticoids and the regulation of growth hormone secretion,” Nature Reviews Endocrinology, vol. 9, no. 5, pp. 265–276, 2013.

    View at: Publisher Site | Google Scholar

  35. N. A. Tritos, “Growth hormone deficiency in adults with Cushing’s disease,” Best Practice and Research Clinical Endocrinology and Metabolism, vol. 35, no. 2, Article ID 101474, 2021.

    View at: Publisher Site | Google Scholar

  36. K. Nakagawa, T. Ishizuka, T. Obara, M. Matsubara, and K. Akikawa, “Dichotomic action of glucocorticoids on growth hormone secretion,” Acta Endocrinologica, vol. 116, no. 2, pp. 165–171, 1987.

    View at: Publisher Site | Google Scholar

  37. G. Fernández-Vázquez, L. Cacicedo, M. J. Lorenzo, R. Tolón, J. López, and F. Sánchez-Franco, “Corticosterone modulates growth hormone-releasing factor and somatostatin in fetal rat hypothalamic cultures,” Neuroendocrinology, vol. 61, no. 1, pp. 31–35, 1995.

    View at: Publisher Site | Google Scholar

  38. S. K. Fife, R. S. Brogan, A. Giustina, and W. B. Wehrenberg, “Immunocytochemical and molecular analysis of the effects of glucocorticoid treatment on the hypothalamic-somatotropic axis in the rat,” Neuroendocrinology, vol. 64, no. 2, pp. 131–138, 1996.

    View at: Publisher Site | Google Scholar

  39. T. L. McCarthy, M. Centrella, and E. Canalis, “Cortisol inhibits the synthesis of insulin-like growth factor-I in skeletal cells,” Endocrinology, vol. 126, no. 3, pp. 1569–1575, 1990.

    View at: Publisher Site | Google Scholar

  40. K. English, V. Chikani, G. Dimeski, and W. J. Inder, “Elevated insulin‐like growth factor‐1 in Cushing’s disease,” Clinical Endocrinology, vol. 91, no. 1, pp. 141–147, 2019.

    View at: Publisher Site | Google Scholar

  41. E. Gezer, B. Çetinarslan, A. Selek et al., “The association between insulin-like growth factor 1 levels within reference range and early postoperative remission rate in patients with Cushing’s disease,” Endocrine Research, vol. 46, no. 3, pp. 92–98, 2021.

    View at: Publisher Site | Google Scholar

Copyright © 2023 Wanwan Sun et al. This is an open access article distributed under the Creative Commons Attribution License, which permits unrestricted use, distribution, and reproduction in any medium, provided the original work is properly cited.

High-resolution Contrast-enhanced MRI With Three-Dimensional Fast Spin Echo Improved the Diagnostic Performance for Identifying Pituitary Microadenomas In Cushing’s Syndrome

Abstract

Objectives

To assess the diagnostic performance of high-resolution contrast-enhanced MRI (hrMRI) with three-dimensional (3D) fast spin echo (FSE) sequence by comparison with conventional contrast-enhanced MRI (cMRI) and dynamic contrast-enhanced MRI (dMRI) with 2D FSE sequence for identifying pituitary microadenomas.

Methods

This single-institutional retrospective study included 69 consecutive patients with Cushing’s syndrome who underwent preoperative pituitary MRI, including cMRI, dMRI, and hrMRI, between January 2016 to December 2020. Reference standards were established by using all available imaging, clinical, surgical, and pathological resources. The diagnostic performance of cMRI, dMRI, and hrMRI for identifying pituitary microadenomas was independently evaluated by two experienced neuroradiologists. The area under the receiver operating characteristics curves (AUCs) were compared between protocols for each reader by using the DeLong test to assess the diagnostic performance for identifying pituitary microadenomas. The inter-observer agreement was assessed by using the κ analysis.

Results

The diagnostic performance of hrMRI (AUC, 0.95–0.97) was higher than cMRI (AUC, 0.74–0.75; p ≤ .002) and dMRI (AUC, 0.59–0.68; p ≤ .001) for identifying pituitary microadenomas. The sensitivity and specificity of hrMRI were 90–93% and 100%, respectively. There were 78% (18/23) to 82% (14/17) of the patients, who were misdiagnosed on cMRI and dMRI and correctly diagnosed on hrMRI. The inter-observer agreement for identifying pituitary microadenomas was moderate on cMRI (κ = 0.50), moderate on dMRI (κ = 0.57), and almost perfect on hrMRI (κ = 0.91), respectively.

Conclusions

The hrMRI showed higher diagnostic performance than cMRI and dMRI for identifying pituitary microadenomas in patients with Cushing’s syndrome.

Key Points

• The diagnostic performance of hrMRI was higher than cMRI and dMRI for identifying pituitary microadenomas in Cushing’s syndrome.

• About 80% of patients, who were misdiagnosed on cMRI and dMRI, were correctly diagnosed on hrMRI.

• The inter-observer agreement for identifying pituitary microadenomas was almost perfect on hrMRI.

Introduction

Cushing’s syndrome, caused by excessive exposure to glucocorticoids, is associated with considerable morbidity and increased mortality [1]. Cushing’s syndrome has diverse manifestations, including central obesity, moon facies, purple striae, and hypertension [2]. Cushing’s disease, due to adrenocorticotropic hormone (ACTH) hypersecretion from pituitary adenomas, is the most common etiology of ACTH-dependent Cushing’s syndrome [12]. According to the Endocrine Society Clinical Practice Guideline, transsphenoidal surgery is the first-line treatment for Cushing’s disease [3]. The identification of pituitary adenomas on preoperative MRI can significantly increase the postoperative remission rate from 50 to 98% [4]. Therefore, it is critical to identify pituitary adenomas on MRI before surgery.

However, there are considerable challenges in identifying ACTH-secreting pituitary adenomas. This is because about 90% of the tumors are microadenomas (less than 10 mm in size) and the median diameter at surgery is about 5 mm [56]. Conventional contrast-enhanced MRI (cMRI) using a two-dimensional (2D) fast spin echo (FSE) sequence has been routinely used to acquire images with 2- to 3-mm slice thickness, but some microadenomas are difficult to be identified on cMRI, resulting in false negatives reported in up to 50% of patients with Cushing’s disease [7]. Dynamic contrast-enhanced MRI (dMRI) increases the sensitivity of identifying pituitary adenomas to 66% [8], but it also increases false positives at the same time [910]. The 3D spoiled gradient recalled (SPGR) sequence has been introduced in high-resolution contrast-enhanced MRI (hrMRI) to acquire images with 1- to 1.2-mm slice thickness. It is reported that the 3D SPGR sequence is superior to the 2D FSE sequence in the identification of pituitary adenomas with a sensitivity of up to 80% [11,12,13], but it cannot satisfy the clinical needs that about 20% of the lesions are still missed. Therefore, techniques are needed that can help better identify pituitary adenomas, particularly microadenomas. Previously, the 3D FSE sequence was recommended in patients with hyperprolactinemia [14]. Recently, the 3D FSE sequence has developed rapidly and can provide superior image quality with diminished artifacts [15]. Sartoretti et al demonstrated in a very effective fashion that the 3D FSE sequence is a reliable alternative for pituitary imaging in terms of image quality [16]. However, to our knowledge, few studies have investigated the diagnostic performance of 3D FSE sequences for identifying ACTH-secreting pituitary adenomas, particularly microadenomas.

The aim of our study was to assess the diagnostic performance of hrMRI with 3D FSE sequence by comparison with cMRI and dMRI with 2D FSE sequence for identifying ACTH-secreting pituitary microadenomas in patients with Cushing’s syndrome.

Materials and methods

This single-institutional retrospective study was approved by the Institutional Review Board of our hospital. The study was conducted in accordance with the Helsinki Declaration. The informed consent was waived due to the retrospective nature of the study.

Study participants

We retrospectively reviewed the medical records and imaging studies of 186 consecutive patients with ACTH-dependent Cushing’s syndrome, who underwent a combined protocol of cMRI, dMRI, and hrMRI from January 2016 to December 2020. Postoperative patients with Cushing’s disease (n = 97), patients with ectopic ACTH syndrome who underwent pituitary exploration (n = 2), and patients with macroadenomas (n = 5) or lack of pathology (n = 13) were excluded from the study. Finally, 69 patients with ACTH-dependent Cushing’s syndrome were included in the current study (Fig. 1) and the patients included were all surgically confirmed.

Fig. 1
figure 1

Flowchart of patient inclusion/exclusion process and image analysis. ACTH adrenocorticotropic hormone, CD Cushing’s disease, EAS ectopic ACTH syndrome, T1WI T1-weighted imaging, T2WI T2-weighted imaging

MRI protocol

All the patients were imaged on a 3.0 Tesla MR scanner (Discovery MR750w, GE Healthcare) using an 8-channel head coil. The MRI protocol included coronal T2-weighted imaging, coronal T1-weighted imaging, and sagittal T1-weighted imaging before contrast injection. After contrast injection of gadopentetate dimeglumine (Gd-DTPA) at 0.05 mmol/kg (0.1 mL/kg) with a flow rate of 2 mL/s followed by a 10-mL saline solution flush, dMRI and cMRI with 2D FSE sequence were obtained first, and hrMRI with 3D FSE sequence using variable flip angle technique was performed immediately afterward. Detailed acquisition parameters are presented in Table S1.

Image analysis: diagnostic performance

Image interpretation was independently conducted by two experienced neuroradiologists (F.F. and H.Y. with 25 and 16 years of experience in neuroradiology, respectively), who were blinded to patient information. The evaluation order of cMRI, dMRI, and hrMRI sequences was randomized. The identification of pituitary microadenomas on images was scored based on a three-point scale (0 = poor; 1 = fair; 2 = excellent). Scores of 1 or 2 represented the identification of the lesion. Reference standards were established by using all available imaging, clinical, surgical, and pathological resources, with a multidisciplinary team approach.

Image analysis: image quality

Two readers (Z.L. and B.H. with 4 years of experience in radiology, respectively) were asked to assess the image quality of cMRI, dMRI, and hrMRI. Before exposure to images used in the current study, these readers underwent a training session to make sure that they were comparable to the experienced neuroradiologists in terms of image quality assessment. Images were presented in a random order. Image quality was assessed by using a 5-point Likert scale [17], including overall image quality (1 = non-diagnostic; 2 = poor; 3 = fair; 4 = good; 5 = excellent), sharpness (1 = non-diagnostic; 2 = not sharp; 3 = a little sharp; 4 = moderately sharp; 5 = satisfyingly sharp), and structural conspicuity (1 = non-diagnostic; 2 = poor; 3 = fair; 4 = good; 5 = excellent). An example of image quality assessment is shown in Table S2. Final decision was made through a consensus agreement.

The mean signal intensity of pituitary microadenomas, pituitary gland, and noise on cMRI, dMRI, and hrMRI was measured using an operator-defined region of interest. For noise, a 10-mm2 region of interest was placed in the background, and noise was defined as the standard deviation of the signal intensity of the background [17]. For pituitary microadenomas and pituitary gland, the region of interest should include a representative portion of the structure. The mean signal intensity of the pituitary microadenoma was replaced with that of the pituitary gland when no microadenoma was identified. A signal-to-noise ratio (SNR) was defined as the mean signal intensity of the pituitary microadenoma divided by noise. A contrast-to-noise ratio (CNR) was defined as the absolute difference of the mean signal intensity between the normal pituitary gland and pituitary microadenomas divided by noise [17]. Supplementary Fig. 1 shows how to measure the SNR and CNR with the region of interest in a contrast-enhanced pituitary MRI. Supplementary Fig. 2 shows the selection of images for the SNR and CNR calculation.

Statistical analysis

The κ analysis was conducted to assess the inter-observer agreement for identifying pituitary microadenomas. The κ value was interpreted as follows: below 0.20, slight agreement; 0.21–0.40, fair agreement; 0.41–0.60, moderate agreement; 0.61–0.80, substantial agreement; greater than 0.80, almost perfect agreement.

To assess the diagnostic performance of cMRI, dMRI, and hrMRI for identifying pituitary microadenomas, the receiver operating characteristic curves were plotted and the area under curves (AUCs) were compared between MR protocols for each reader by using the DeLong test. Sensitivity, specificity, positive predictive value, and negative predictive value were calculated. The Mann–Whitney U test was used to evaluate the difference in image quality scores and the Wilcoxon signed-rank test was used to evaluate SNR and CNR measurements between MR protocols. A p value of less than 0.05 was considered statistically significant. Statistical analysis was performed using MedCalc Statistical Software (version 20.0.15; MedCalc Software) and SPSS Statistics (version 22.0; IBM).

Results

Clinical characteristics

A total of 69 patients (median age, 39 years; interquartile range [IQR], 29–54 years; 38 women [55%]) with ACTH-dependent Cushing’s syndrome were included in the study and their clinical characteristics are shown in Table 1. Among the 69 patients, 60 (87%) patients were diagnosed with Cushing’s disease and 9 (13%) were ectopic ACTH syndrome. The median disease course was 36 months (IQR, 12–78 months). The median serum cortisol, ACTH, and 24-h urine free cortisol level before surgery were 33.0 μg/dL (IQR, 25.1–40.1 μg/dL; normal range 4.0–22.3 μg/dL), 77.2 ng/L (IQR, 55.0–124.0 ng/L; normal range 0–46 ng/L), and 422.0 μg (IQR, 325.8–984.6 μg; normal range 12.3–103.5 μg), respectively. The median serum cortisol and 24-h urine free cortisol level after surgery were 3.0 μg/dL (IQR, 1.8–18.4 μg/dL) and 195.6 μg (IQR, 63.5–1240.3 μg), respectively. The median diameter of pituitary microadenomas was 5 mm (IQR, 4–5 mm), ranging from 3 to 9 mm.

Table 1 Clinical characteristics of the patients

Diagnostic performance of cMRI, dMRI, and hrMRI for identifying pituitary microadenomas

The inter-observer agreement for identifying pituitary microadenomas by κ statistic between two readers was moderate on cMRI (κ = 0.50), moderate on dMRI (κ = 0.57), and almost perfect on hrMRI (κ = 0.91), respectively.

The diagnostic performance for identifying pituitary microadenomas on cMRI, dMRI, hrMRI, and combined cMRI and dMRI is summarized in Table 2. For reader 1, the diagnostic performance of hrMRI (AUC, 0.95; 95%CI: 0.87, 0.99) was higher than that of cMRI (AUC, 0.75; 95%CI: 0.63, 0.85; p = 0.002), dMRI (AUC, 0.59; 95%CI: 0.47, 0.71; p < 0.001), and combined cMRI and dMRI (AUC, 0.65; 95%CI: 0.53, 0.76; p = 0.001). For reader 2, the diagnostic performance of hrMRI (AUC, 0.97; 95%CI: 0.89, 1.00) was higher than that of cMRI (AUC, 0.74; 95%CI: 0.63, 0.84; p = 0.001), dMRI (AUC, 0.68; 95%CI: 0.56, 0.79; p = 0.001), and combined cMRI and dMRI (AUC, 0.70; 95%CI: 0.58, 0.80; p = 0.003).

Table 2 Diagnostic performance of cMRI, dMRI, and hrMRI for identifying pituitary microadenomas

For reader 1, 23 of the 69 patients (33%) were misdiagnosed on both cMRI and dMRI, but 18 of the 23 misdiagnosed patients (78%) were correctly diagnosed on hrMRI. For reader 2, 17 of the 69 patients (25%) were misdiagnosed on both cMRI and dMRI, but 14 of the 17 misdiagnosed patients (82%) were correctly diagnosed on hrMRI.

Figure 2 shows that a 5-mm pituitary microadenoma was identified on preoperative pituitary MRI. The margin of the lesion was fully delineated on hrMRI, but not on cMRI and dMRI. Figure 3 shows that a 3-mm pituitary microadenoma was missed on cMRI, but identified on dMRI and hrMRI. Figure 4 shows that a 5-mm pituitary microadenoma was correctly diagnosed on hrMRI, but missed on cMRI or dMRI. Figure 5 shows that a 4-mm pituitary microadenoma was evident on coronal images as well as reconstructed axial and reconstructed sagittal images on hrMRI.

Fig. 2

figure 2

Images in a 56-year-old man with Cushing’s disease. The 5-mm pituitary microadenoma (arrow) can be identified on (a) coronal contrast-enhanced T1-weighted image and (b) coronal dynamic contrast-enhanced T1-weighted image obtained with two-dimensional (2D) fast spin echo (FSE) sequence, but the margin is not fully delineated. The lesion (arrow) is well delineated on (c) coronal contrast-enhanced T1-weighted image on high-resolution MRI obtained with 3D FSE sequence. d Intraoperative endoscopic photograph during transsphenoidal surgery after exposure of the sellar floor shows a round pituitary microadenoma (arrow)

Fig. 3

figure 3

Images in a 34-year-old woman with Cushing’s disease. No tumor is identified on (a) coronal contrast-enhanced T1-weighted image obtained with two-dimensional (2D) fast spin echo (FSE) sequence. The 3-mm pituitary microadenoma (arrow) with delayed enhancement is identified on the left side of the pituitary gland on (b) coronal dynamic contrast-enhanced T1-weighted image obtained with 2D FSE sequence and (c) coronal contrast-enhanced T1-weighted image on high-resolution MRI obtained with 3D FSE sequence. d Intraoperative endoscopic photograph during transsphenoidal surgery shows a 3-mm pituitary microadenoma (arrow)

Fig. 4

figure 4

Images in a 43-year-old man with Cushing’s disease. The lesion is missed on (a) coronal contrast-enhanced T1-weighted image and (b) coronal dynamic contrast-enhanced T1-weighted image obtained with two-dimensional (2D) fast spin echo (FSE) sequence. c Coronal contrast-enhanced T1-weighted image on high-resolution MRI obtained with 3D FSE sequence shows a round pituitary microadenoma (arrow) measuring approximately 5 mm with delayed enhancement on the left side of the pituitary gland. d Intraoperative endoscopic photograph for microsurgical resection of the 5-mm pituitary microadenoma (arrow)

Fig. 5

figure 5

Images in a 48-year-old woman with Cushing’s disease. Preoperative high-resolution contrast-enhanced MRI using three-dimensional fast spin echo sequence shows a 4-mm pituitary microadenoma (arrow) with delayed enhancement is well delineated on the left side of the pituitary gland on (a) coronal, (b) reconstructed axial, and (c) reconstructed sagittal contrast-enhanced T1-weighted images. d Intraoperative endoscopic photograph during transsphenoidal surgery after exposure of the sellar floor shows a round pituitary microadenoma (arrow)

Image quality of cMRI, dMRI, and hrMRI

Image quality scores of cMRI, dMRI, and hrMRI are presented in Table 3. Scores for overall image quality, sharpness, and structural conspicuity on hrMRI (overall image quality, 5.0 [IQR, 5.0–5.0]; sharpness, 5.0 [IQR, 4.5–5.0]; structural conspicuity, 5.0 [IQR, 5.0–5.0]) were higher than those on cMRI (overall image quality, 4.0 [IQR, 3.5–4.0]; sharpness, 4.0 [IQR, 3.0–4.0]; structural conspicuity, 4.0 [IQR, 4.0–4.0]; p < 0.001 for all) and dMRI (overall image quality, 4.0 [IQR, 4.0–4.0]; sharpness, 4.0 [IQR, 4.0–4.0]; structural conspicuity, 4.0 [IQR, 4.0–4.5]; p < 0.001 for all).

Table 3 Image quality scores on cMRI, dMRI, and hrMRI

The SNR and CNR measurements are shown in Table 4. The SNR of the pituitary microadenomas on hrMRI (67.5 [IQR, 51.2–92.1]) was lower than that on cMRI (82.3 [IQR, 61.8–127.2], p < 0.001), but higher than that on dMRI (53.9 [IQR, 35.2–72.6], p = 0.001). The CNR on hrMRI (26.2 [IQR, 15.1–41.0]) was higher than that on cMRI (10.6 [IQR, 0–42.6], p = 0.023) and dMRI (11.2 [IQR, 0–29.8], p < 0.001).

Table 4 SNR and CNR on cMRI, dMRI, and hrMRI

Discussion

The identification of pituitary microadenomas is considerably challenging but critical in patients with ACTH-dependent Cushing’s syndrome. Our study demonstrated that hrMRI with 3D FSE sequence had higher diagnostic performance (AUC, 0.95–0.97) than cMRI (AUC, 0.74–0.75; p ≤ 0.002) and dMRI (AUC, 0.59–0.68; p ≤ 0.001) for identifying pituitary microadenomas. To our knowledge, there are no previous studies specifically evaluating the identification of pituitary microadenomas on hrMRI with 3D FSE sequence by comparison with cMRI and dMRI in patients with ACTH-dependent Cushing’s syndrome, and this is the largest study conducted in ACTH-secreting microadenomas with a sensitivity of more than 90%.

Recently, techniques for pituitary evaluation have developed rapidly. Because of false negatives and false positives on cMRI and dMRI using 2D FSE sequence [7910], a 3D SPGR sequence was introduced for identifying pituitary adenomas. Previous studies demonstrated that the 3D SPGR sequence performed better than the 2D FSE sequence in the identification of pituitary adenomas with a sensitivity of up to 80% [11,12,13]. In patients with hyperprolactinemia, the 3D FSE sequence was recommended [14] and the 3D FSE sequence has rapidly developed recently with superior image quality [1516], suggesting that the 3D FSE sequence may be a reliable alternative for identifying pituitary adenomas. However, to our knowledge, few studies have investigated the diagnostic performance of the 3D FSE sequence for identifying ACTH-secreting pituitary adenomas. To fill the gaps, we conducted the current study and revealed that images obtained with the 3D FSE sequence had higher sensitivity (90–93%) in identifying pituitary microadenomas, than that in previous studies using the 3D SPGR sequence [811,12,13].

There is a trade-off between spatial resolution and image noise. The reduced slice thickness can overcome the partial volume averaging effect, but it is associated with increased image noise [17]. Strikingly, our study showed that hrMRI had higher image quality scores than cMRI and dMRI, in terms of overall image quality, sharpness, and structural conspicuity. The SNR of the pituitary microadenomas on cMRI was slightly higher than that on hrMRI in our study. This is because the SNR was calculated as the mean signal intensity of the pituitary gland (instead of the pituitary microadenoma) divided by noise when no microadenoma was identified, and the mean signal intensity of the pituitary gland is higher than that of the pituitary microadenoma. About 40% of pituitary microadenomas were missed on cMRI, whereas less than 10% of pituitary microadenomas were missed on hrMRI. Given the situation mentioned above, the SNR on hrMRI was lower than that on cMRI. However, the CNR on hrMRI was significantly higher than that on cMRI and dMRI. Therefore, hrMRI in our study can dramatically improve the spatial resolution with high CNR, enabling the better identification of pituitary microadenomas.

The identification of pituitary adenomas on preoperative MRI in patients with ACTH-dependent Cushing’s syndrome could help the differential diagnosis of Cushing’s syndrome and aids surgical resection of lesions. It should be noted that most of the pituitary adenomas in patients with Cushing’s disease are microadenomas [56]. In our study, all the tumors are microadenomas with a median diameter of 5 mm (IQR, 4–5 mm), making the diagnosis more challenging. The sensitivity of identifying pituitary adenomas decreased from 80 to 72% after excluding macroadenomas in a previous study [12], whereas the sensitivity of identifying pituitary microadenomas in our study was 90–93% on hrMRI. In the current study, hrMRI performed better than cMRI, dMRI, and combined cMRI and dMRI, with high AUC (0.95–0.97), high sensitivity (90–93%), and high specificity (100%), superior to previous studies [811,12,13]. The high sensitivity of hrMRI for identifying pituitary adenomas will help surgeons improve the postoperative remission rate [4]. The high specificity of hrMRI will assist clinicians to consider ectopic ACTH syndrome, and then perform imaging to identify ectopic tumors. Besides, the inter-observer agreement for identifying pituitary microadenomas was almost perfect on hrMRI (κ = 0.91), which was moderate on cMRI (κ = 0.50) and dMRI (κ = 0.57). Therefore, hrMRI using the 3D FSE sequence is a potential alternative that can significantly improve the identification of pituitary microadenomas.

Limitations of the study included its retrospective nature and the relatively small sample size in patients with ectopic ACTH syndrome as negative controls. The bias may be introduced in the patient inclusion process. Only those patients who underwent all the cMRI, dMRI, and hrMRI scans were included. In fact, some patients will bypass hrMRI when obvious pituitary adenomas were detected on cMRI and dMRI. These patients were not included in the current study because of lack of hrMRI findings. Given the situation, the sensitivity of identifying pituitary adenomas will be higher with the enrollment of these patients. Besides, the timing of the sequence acquisition after contrast injection is essential [16] and bias may be introduced due to the postcontrast enhancement curve of both the pituitary gland and the microadenoma [14]. In the future, a prospective study with different sequence acquisition orders is needed to minimize possible interference caused by the postcontrast enhancement curve. Moreover, a larger sample size is also needed to verify the diagnostic performance of hrMRI using 3D FSE sequence for identifying pituitary microadenomas and to determine whether it can replace 2D FSE or 3D SPGR sequences for routinely evaluating the pituitary gland.

In conclusion, hrMRI with 3D FSE sequence showed higher diagnostic performance than cMRI and dMRI for identifying pituitary microadenomas in patients with Cushing’s syndrome.

Abbreviations

ACTH:
Adrenocorticotropic hormone
AUC:
Area under the receiver operating characteristics curve
cMRI:
Conventional contrast-enhanced MRI
CNR:
Contrast-to-noise ratio
dMRI:
Dynamic contrast-enhanced MRI
FSE:
Fast spin echo
hrMRI:
High-resolution contrast-enhanced MRI
IQR:
Interquartile range
SNR:
Signal-to-noise ratio
SPGR:
Spoiled gradient re

called

References

  1. Lacroix A, Feelders RA, Stratakis CA, Nieman LK (2015) Cushing’s syndrome. Lancet 386:913–927

    Article CAS PubMed Google Scholar

  2. Loriaux DL (2017) Diagnosis and differential diagnosis of Cushing’s syndrome. N Engl J Med 376:1451–1459

    Article CAS PubMed Google Scholar

  3. Nieman LK, Biller BM, Findling JW et al (2015) Treatment of Cushing’s syndrome: an Endocrine Society clinical practice guideline. J Clin Endocrinol Metab 100:2807–2831

    Article CAS PubMed PubMed Central Google Scholar

  4. Yamada S, Fukuhara N, Nishioka H et al (2012) Surgical management and outcomes in patients with Cushing disease with negative pituitary magnetic resonance imaging. World Neurosurg 77:525–532

    Article PubMed Google Scholar

  5. Vitale G, Tortora F, Baldelli R et al (2017) Pituitary magnetic resonance imaging in Cushing’s disease. Endocrine 55:691–696

    Article CAS PubMed Google Scholar

  6. Jagannathan J, Smith R, DeVroom HL et al (2009) Outcome of using the histological pseudocapsule as a surgical capsule in Cushing disease. J Neurosurg 111:531–539

    Article PubMed PubMed Central Google Scholar

  7. Boscaro M, Arnaldi G (2009) Approach to the patient with possible Cushing’s syndrome. J Clin Endocrinol Metab 94:3121–3131

    Article CAS PubMed Google Scholar

  8. Kasaliwal R, Sankhe SS, Lila AR et al (2013) Volume interpolated 3D-spoiled gradient echo sequence is better than dynamic contrast spin echo sequence for MRI detection of corticotropin secreting pituitary microadenomas. Clin Endocrinol (Oxf) 78:825–830

    Article CAS PubMed Google Scholar

  9. Lonser RR, Nieman L, Oldfield EH (2017) Cushing’s disease: pathobiology, diagnosis, and management. J Neurosurg 126:404–417

    Article PubMed Google Scholar

  10. Potts MB, Shah JK, Molinaro AM et al (2014) Cavernous and inferior petrosal sinus sampling and dynamic magnetic resonance imaging in the preoperative evaluation of Cushing’s disease. J Neurooncol 116:593–600

    Article PubMed Google Scholar

  11. Grober Y, Grober H, Wintermark M, Jane JA, Oldfield EH (2018) Comparison of MRI techniques for detecting microadenomas in Cushing’s disease. J Neurosurg 128:1051–1057

    Article PubMed Google Scholar

  12. Fukuhara N, Inoshita N, Yamaguchi-Okada M et al (2019) Outcomes of three-Tesla magnetic resonance imaging for the identification of pituitary adenoma in patients with Cushing’s disease. Endocr J 66:259–264

    Article PubMed Google Scholar

  13. Patronas N, Bulakbasi N, Stratakis CA et al (2003) Spoiled gradient recalled acquisition in the steady state technique is superior to conventional postcontrast spin echo technique for magnetic resonance imaging detection of adrenocorticotropin-secreting pituitary tumors. J Clin Endocrinol Metab 88:1565–1569

    Article CAS PubMed Google Scholar

  14. Magnaldi S, Frezza F, Longo R, Ukmar M, Razavi IS, Pozzi-Mucelli RS (1997) Assessment of pituitary microadenomas: comparison between 2D and 3D MR sequences. Magn Reson Imaging 15:21–27

    Article CAS PubMed Google Scholar

  15. Lien RJ, Corcuera-Solano I, Pawha PS, Naidich TP, Tanenbaum LN (2015) Three-Tesla imaging of the pituitary and parasellar region: T1-weighted 3-dimensional fast spin echo cube outperforms conventional 2-dimensional magnetic resonance imaging. J Comput Assist Tomogr 39:329–333

    PubMed Google Scholar

  16. Sartoretti T, Sartoretti E, Wyss M et al (2019) Compressed SENSE accelerated 3D T1w black blood turbo spin echo versus 2D T1w turbo spin echo sequence in pituitary magnetic resonance imaging. Eur J Radiol 120:108667

    Article PubMed Google Scholar

  17. Kim M, Kim HS, Kim HJ et al (2021) Thin-slice pituitary MRI with deep learning-based reconstruction: diagnostic performance in a postoperative setting. Radiology 298:114–122

    Article PubMed Google Scholar

Download references

Acknowledgements

We thank Dr. Kai Sun, Medical Research Center, Peking Union Medical College Hospital, for his guidance on the statistical analysis in this study.

Funding

This study has received funding from the National Natural Science Foundation of China (grant 82071899), the National Key Research and Development Program of China (grants 2016YFC1305901, 2020YFA0804500), the Chinese Academy of Medical Sciences Innovation Fund for Medical Sciences (grants 2017-I2M-3–008, 2021-I2M-1–025), the Beijing Natural Science Foundation (grant L182067) and National High Level Hospital Clinical Research Funding (2022-PUMCH-B-067, 2022-PUMCH-B-114).

Author information

Author notes

  1. Zeyu Liu and Bo Hou contributed equally to this work and share first authorship
  2. Hui You and Feng Feng contributed equally to this work and share corresponding authorship

Authors and Affiliations

  1. Department of Radiology, Peking Union Medical College Hospital, Chinese Academy of Medical Sciences and Peking Union Medical College, No. 1 Shuaifuyuan Wangfujing Dongcheng Distinct, Beijing, 100730, China

    Zeyu Liu, Bo Hou, Hui You, Mingli Li & Feng Feng

  2. Department of Endocrinology, Peking Union Medical College Hospital, Chinese Academy of Medical Sciences and Peking Union Medical College, No. 1 Shuaifuyuan Wangfujing Dongcheng Distinct, Beijing, 100730, China

    Lin Lu, Lian Duan & Huijuan Zhu

  3. Department of Neurosurgery, Peking Union Medical College Hospital, Chinese Academy of Medical Sciences and Peking Union Medical College, No. 1 Shuaifuyuan Wangfujing Dongcheng Distinct, Beijing, 100730, China

    Kan Deng & Yong Yao

  4. State Key Laboratory of Complex Severe and Rare Disease, Peking Union Medical College Hospital, Chinese Academy of Medical Sciences and Peking Union Medical College, No. 1 Shuaifuyuan Wangfujing Dongcheng Distinct, Beijing, 100730, China

    Yong Yao, Huijuan Zhu & Feng Feng

Corresponding authors

Correspondence to Hui You or Feng Feng.

Ethics declarations

Guarantor

The scientific guarantor of this publication is Feng Feng.

Conflict of interest

The authors of this manuscript declare no conflict of interest.

Statistics and biometry

No complex statistical methods were necessary for this paper.

Informed consent

Written informed consent was waived by the Institutional Review Board.

Ethical approval

Institutional Review Board approval was obtained.

Methodology

• retrospective

• diagnostic or prognostic study

• performed at one institution

Additional information

Publisher’s note

Springer Nature remains neutral with regard to jurisdictional claims in published maps and institutional affiliations.

Supplementary Information

Below is the link to the electronic supplementary material.