Intermittent Blurry Vision: An Unexpected Presentation of Cushing’s Syndrome Due to Primary Bilateral Macronodular Adrenal Hyperplasia (PBMAH)

Published: May 15, 2022 (see history)

DOI: 10.7759/cureus.25017

Cite this article as: Fernandez C, Bhatia S, Rucker A, et al. (May 15, 2022) Intermittent Blurry Vision: An Unexpected Presentation of Cushing’s Syndrome Due to Primary Bilateral Macronodular Adrenal Hyperplasia (PBMAH). Cureus 14(5): e25017. doi:10.7759/cureus.25017


Abstract

Cushing’s syndrome (CS) is an uncommon endocrine disorder resulting from prolonged exposure to elevated glucocorticoids, with 10-15 million annual cases per the American Association of Neurological Surgeons. Exogenous and endogenous causes can further be divided into adrenocorticotropic hormone (ACTH) dependent (i.e Cushing’s Disease) or ACTH independent. ACTH-independent CS can be caused by primary bilateral macronodular adrenal hyperplasia (PBMAH) representing less than 1% cases of CS. We report a case of a woman presenting with chronic resistant hypertension, episodic blurry vision, weight gain and wasting of extremities. She was diagnosed with Cushing’s syndrome due to PBMAH.

Our patient’s presentation was unusual as she presented at 40 years old, 10 years earlier than expected for PBMAH; and primarily with complaints of episodic blurry vision. Her symptoms also progressed rapidly as signs and symptoms largely presented over the course of 12 months, however responded well to surgical resection.

Introduction

Cushing’s syndrome (CS) is an uncommon endocrine disorder caused by prolonged exposure to elevated glucocorticoids [1]. There are exogenous or endogenous causes. The National Institute of Health’s (NIH) Genetic and Rare Diseases Information Center (GARD) estimated the prevalence of endogenous CS to be 1 in 26,000 [2]. According to a large study, the annual incidence of CS in individuals less than 65 years old was nearly 49 cases per million [3]. Cushing’s disease (CD), which is defined as Cushing’s syndrome caused by an adrenocorticotropic hormone (ACTH)-secreting pituitary tumor, accounts for approximately 80% of patients with CS; whereas ACTH-independent CS accounts for the remaining 20% [4]. Among the causes of pituitary ACTH-independent CS is bilateral macronodular adrenal hyperplasia which is rare, comprising less than 1% of patients with CS [5]. Herein is a case of rapid onset Cushing’s syndrome due to PBMAH initially presenting as episodes of bilateral blurry vision.

Case Presentation

The patient is a 40-year-old female with a past medical history of resistant hypertension (on four agents), and recently diagnosed type 2 diabetes mellitus (started on insulin regimen). Patient was recently seen by her primary care provider, with complaints of intermittent episodes of blurry vision going on for months.

As part of evaluation in December 2020, the patient underwent a renal ultrasound as part of evaluation by the primary physician for uncontrolled hypertension. The doppler incidentally showed an indeterminate hypoechoic mass on the right kidney and presumably located within the right adrenal gland, measuring 3.4 x 5.4 cm, without sonographic evidence of renal artery stenosis. The left kidney appeared normal. She was recommended to have further evaluation with contrast enhanced MR or CT with adrenal protocol.

In January 2021, the patient was sent from her PCP’s office to the ED as the patient was having blurred vision. She had a plain CT scan of the brain that was unremarkable. The patient’s systolic blood pressure was in the 160s-170s mm Hg upon arrival to ED compliance with home medications of 5mg of amlodipine daily, 25mg of metoprolol succinate daily, 100mg of losartan daily, and 25mg of hydrochlorothiazide daily. Physical exam reported obesity without evidence of abdominal striae. Blood work in the ED showed elevated blood glucose level over 600 (mg/dL) despite being on a regimen of lantus 60 units, metformin 1000mg twice a day, and semaglutide SQ weekly. Hemoglobin A1c was greater than 15.5%, and vitamin D was low (15.6 ng/mL). The morning ACTH was low (<5pg/mL) (nAM levels: 7.2 – 63.3 pg/mL), AM cortisol was high at 26.1 ug/ml (normal: 5.0 – 23.0 ug/mL), plasma aldosterone was normal at 4.2 ng/dL with a normal plasma renin at 1.96 (0.25 – 5.82 ng/mL/h). 24-hour urine free cortisol (UFC) was high at 1299.5 (4.0-50.0 mcg/24h). CT of the abdomen/pelvis with and without contrast showed low-attenuation masses (less than 5 Hounsfield units) present in both adrenal glands measuring 6.9 x 5.3 cm on the right and 4.5 x 3.9 cm on the left, and did not demonstrate significant arterial enhancement (Figure 1). MR imaging of the abdomen without and with contrast was also obtained and showed the same masses of the bilateral adrenal glands, with largest on the left measured 3.6 cm and largest on the right measured 3.7 cm, as well as mild fatty infiltration of the liver. General surgery and hematology/oncology were consulted and recommendations were made for outpatient follow-up with PCP and endocrinology.

CT-of-the-abdomen/pelvis-with-contrast-showing-low-attenuation-masses-present-in-both-adrenal-glands-measuring-6.9-x-5.3-cm-on-the-right-(dark-gray-arrow)-and-4.5-x-3.9-cm-on-the-left-(light-gray-arrow)
Figure 1: CT of the abdomen/pelvis with contrast showing low-attenuation masses present in both adrenal glands measuring 6.9 x 5.3 cm on the right (dark gray arrow) and 4.5 x 3.9 cm on the left (light gray arrow)

In early February 2021, the patient again presented to the ED complaining of recurrent episodes of bilateral blurry vision. Examination was unremarkable, including an ophthalmological exam with slit lamp exam. Blurred vision was suspected to be due to osmotic swelling in the setting of severe hyperglycemia as the patient had persistently uncontrolled blood sugars. Recommendations were for tighter control of blood glucose, and follow-up with primary care and ophthalmology.

Patient followed up with the endocrinologist in mid-February to which the patient reported first noticing a difference in her energy and changes to her weight around one year prior. She communicated a weight gain of 30 to 40 lbs over the past year. Patient had a reported history of gestational hypertension diagnosed five years ago when she gave birth to her daughter, which was steadily worsening over the past year. She reported intermittent myalgias and easy bruising. Patient had no family history or any apparent features to suggest multiple endocrine neoplasia (MEN) syndrome. Blood work revealed ACTH less than 1.5 pg/mL, AM cortisol was high at 24.5 mcg/dL, and normal aldosterone at 3.6 ng/dL, with normal renin and metanephrine levels. Physical examination revealed truncal obesity as well as a round face, cushingoid in appearance, and relatively thin extremities and abdominal striae.

She was then referred to a surgical specialist, and it was decided that she would undergo laparoscopic bilateral adrenalectomy due to severe Cushing’s syndrome. The surgical pathology report revealed macro-nodular cortical hyperplasia of both left and right adrenal gland masses with random endocrine atypia. The largest nodule on the left measured 4.5 cm and the largest nodule on the right measured 6.6 cm. Post-operatively she was started on hydrocortisone 20 mg every morning and 10 mg every evening, and fludrocortisone 0.1 mg twice a day as part of her steroid replacement regimen. Eventually she changed to hydrocortisone 10 mg three times a day and fludrocortisone 0.1 mg once a day. For her diabetes, her insulin glargine decreased from 60 units to 20 units. Amlodipine and hydrochlorothiazide were discontinued from her antihypertensive medications; she continued losartan and metoprolol. Follow up blood work showed stable electrolytes with potassium 4.2 mmol/L (3.5-5.2 mmol/L), sodium 137 mmol/L (134-144mmol/L), chloride 100 mmol/L (96-106 mmol/L), and carbon dioxide 23 mmol/L (20-29mmol/L).

Discussion

ACTH-independent Cushing’s syndrome due to bilateral cortisol-secreting nodules is rare, accounting for 2% of CS cases. The majority of causes include primary bilateral macronodular adrenal hyperplasia (PBMAH), primary pigmented nodular adrenocortical disease (PPNAD), and bilateral adrenocortical adenomas (BAA). In PBMAH, typically patients are diagnosed within the fifth or sixth decade of life [4]. The usual age of onset for PPNAD is within the first to third decade of life, with median age in the pediatric population at age 15 years [6]. BAA is such a rare entity that there exists little epidemiological data with less than 40 reported cases until 2019 [7]. A small subset of patients present with overt clinical symptoms of CS, as hypercortisolism often follows an insidious course that can delay diagnosis from years to decades, with one series reporting a diagnostic delay of approximately eight years [8]. Serum and urine hormone screening in the right clinical setting can provide clues to these endocrine disorders, however diagnosis of ACTH-independent CS often occurs incidentally wherein a radiographic study was done for reasons other than to identify adrenal disease [9]. CT or MRI alone are not able to differentiate these disease entities, requiring pathological examination for final determination [7]. Adrenal venous sampling (AVS) and I-6B-iodomethyl-19-norcholesterol (I-NP-59) can aid in identifying hormone-secreting status of each adrenal lesion, however usefulness is debated among experts [10-12].

In all cases the end goal is to normalize adrenocortical hormones, and PBMAH primarily involves surgical resection with exogenous hormone replacement. Bilateral adrenalectomy is generally the treatment of choice with overt Cushing syndrome regardless of cortisol level. These patients require lifelong steroid administration [9,13]. Another approach is unilateral adrenalectomy of the larger or more metabolically active gland, which can be identified after AVS or I-NP-59 testing. This has been proposed in order to preserve some autonomous hormonal production and prevent adrenal crisis, however remission rates of Cushing syndrome as high as 84% have been reported with eventual need for bilateral adrenalectomy [7,8,14]. Steroid enzyme inhibition to control cortisol secretion has been used as an adjunct before surgery. In some patients with identified aberrant adrenal hormone receptors, targeted pharmacological inhibition remains an alternative medical approach [8]. Despite these alternatives to surgery, surgical resection remains the optimal approach [1].

Conclusions

ACTH-independent Cushing’s syndrome due to PBMAH usually presents as an indolent course, with typical diagnosis in the fifth to sixth decade. As the use of imaging for other non-endocrine related investigations becomes more utilized, PBMAH being less of a rare entity. Clinical presentation usually dictates the timing of and type of surgical intervention. Although there are some reports of unilateral resection resulting in a cure, many of these cases eventually proceed to staged bilateral resection. Our patient’s presentation as her primary complaint was recurrent episodes of blurry vision that were suspected to be due to osmotic swelling because of her uncontrolled hyperglycemia. Her case was also unusual as she presented at 40 years old, an average of 10 years earlier than is typically diagnosed for PBMAH. Her symptoms also progressed rapidly over the course of 12 months with development of resistant hypertension and insulin-dependent diabetes requiring high basal insulin. Following surgical resection, her antihypertensive regimen was de-escalated and had significant reduction in insulin requirements, and was maintained on adrenocorticoid therapy.


References

  1. Nieman LK: Recent updates on the diagnosis and management of Cushing’s syndrome. Endocrinol Metab (Seoul). 2018, 33:139-46. 10.3803/EnM.2018.33.2.139
  2. Rare Disease Database: Cushing Syndrome. (2021). Accessed: 12/17/2021: https://rarediseases.org/rare-diseases/cushing-syndrome/.
  3. Broder MS, Neary MP, Chang E, Cherepanov D, Ludlam WH: Incidence of Cushing’s syndrome and Cushing’s disease in commercially-insured patients <65 years old in the United States. Pituitary. 2015, 18:283-9. 10.1007/s11102-014-0569-6
  4. Lacroix A, Feelders RA, Stratakis CA, Nieman LK: Cushing’s syndrome. Lancet. 2015, 386:913-27. 10.1016/S0140-6736(14)61375-1
  5. Tokumoto M, Onoda N, Tauchi Y, et al.: A case of adrenocoricotrophic hormone -independent bilateral adrenocortical macronodular hyperplasia concomitant with primary aldosteronism. BMC Surg. 2017, 17:97. 10.1186/s12893-017-0293-z
  6. Stratakis CA: Cushing syndrome caused by adrenocortical tumors and hyperplasias (corticotropin- independent Cushing syndrome). Endocr Dev. 2008, 13:117-32. 10.1159/000134829
  7. Gu YL, Gu WJ, Dou JT, et al.: Bilateral adrenocortical adenomas causing adrenocorticotropic hormone-independent Cushing’s syndrome: a case report and review of the literature. World J Clin Cases. 2019, 7:961-71. 10.12998/wjcc.v7.i8.961
  8. Lacroix A: ACTH-independent macronodular adrenal hyperplasia. Best Pract Res Clin Endocrinol Metab. 2009, 23:245-59. 10.1016/j.beem.2008.10.011
  9. Sweeney AT, Srivoleti P, Blake MA: Management of the patient with incidental bilateral adrenal nodules. J Clin Transl Endocrinol Case Rep. 2021, 20:100082. 10.1016/j.jecr.2021.100082
  10. Lumachi F, Zucchetta P, Marzola MC, Bui F, Casarrubea G, Angelini F, Favia G: Usefulness of CT scan, MRI and radiocholesterol scintigraphy for adrenal imaging in Cushing’s syndrome. Nucl Med Commun. 2002, 23:469-73. 10.1097/00006231-200205000-00007
  11. Builes-Montaño CE, Villa-Franco CA, Román-Gonzalez A, Velez-Hoyos A, Echeverri-Isaza S: Adrenal venous sampling in a patient with adrenal Cushing syndrome. Colomb Med (Cali). 2015, 46:84-7.
  12. Guo YW, Hwu CM, Won JG, Chu CH, Lin LY: A case of adrenal Cushing’s syndrome with bilateral adrenal masses. Endocrinol Diabetes Metab Case Rep. 2016, 2016:150118. 10.1530/EDM-15-0118
  13. Wei J, Li S, Liu Q, et al.: ACTH-independent Cushing’s syndrome with bilateral cortisol-secreting adrenal adenomas: a case report and review of literatures. BMC Endocr Disord. 2018, 18:22. 10.1186/s12902-018-0250-6
  14. Osswald A, Quinkler M, Di Dalmazi G, et al.: Long-term outcome of primary bilateral macronodular adrenocortical hyperplasia after unilateral adrenalectomy. J Clin Endocrinol Metab. 2019, 104:2985-93. 10.1210/jc.2018-02204

From https://www.cureus.com/articles/90069-intermittent-blurry-vision-an-unexpected-presentation-of-cushings-syndrome-due-to-primary-bilateral-macronodular-adrenal-hyperplasia-pbmah

Sparsely Granulated Corticotroph Pituitary Macroadenoma Presenting with Pituitary Apoplexy Resulting in Remission of Hypercortisolism

https://doi.org/10.1016/j.aace.2022.04.003Get rights and content
Under a Creative Commons license
Open access

Highlights

• We describe a rare case of a patient with a sparsely granulated corticotroph pituitary macroadenoma with pituitary apoplexy who underwent transsphenoidal resection resulting in remission of hypercortisolism.
• Corticotroph adenomas are divided into densely granulated, sparsely granulated and Crooke’s cell tumors.
• macroadenomas account for 7-23% of patients with pituitary corticotroph adenomas
• Sparsely granulated corticotroph tumors are associated with longer duration of Cushing disease prior to diagnosis, larger tumor size at diagnosis, decreased immediate remission rate, increased proliferative marker Ki-67 and increased recovery time of hypothalamic-pituitary-adrenal axis after surgery.
• Granulation pattern is an important clinicopathological distinction impacting the behavior and treatment outcomes of pituitary corticotroph adenomas

Abstract

Background

/Objective: Pituitary corticotroph macroadenomas, which account for 7% to 23% of corticotroph adenomas, rarely present with apoplexy. The objective of this report is to describe a patient with a sparsely granulated corticotroph tumor (SGCT) presenting with apoplexy and remission of hypercortisolism.

Case Report

A 33-year-old male presented via ambulance with sudden onset of severe headache and nausea/vomiting. Physical exam revealed bitemporal hemianopsia, diplopia from right-sided third cranial nerve palsy, abdominal striae, facial plethora, dorsal and supraclavicular fat pad. Magnetic resonance imaging (MRI) demonstrated a 3.2 cm mass arising from the sella turcica with hemorrhage compressing the optic chiasm, extension into the sphenoid sinus and cavernous sinus. Initial investigations revealed plasma cortisol of 64.08 mcg/dL (Reference Range (RR), 2.36 – 17.05). He underwent emergent transsphenoidal surgery. Pathology was diagnostic of SGCT. Post-operatively, cortisol was <1.8ug/dL (RR, 2.4 – 17), adrenocorticotropic hormone (ACTH) 36 pg/mL (RR, 0 – 81), thyroid stimulating hormone (TSH) 0.07 uIU/mL (RR, 0.36 – 3.74), free thyroxine 1 ng/dL (RR, 0.8 – 1.5), luteinizing hormone (LH) <1 mIU/mL (RR, 1 – 12), follicle stimulating hormone (FSH) 1 mIU/mL (RR, 1 – 12) and testosterone 28.8 ng/dL (RR, 219.2 – 905.6) with ongoing requirement for hydrocortisone, levothyroxine, testosterone replacement and continued follow-up.

Discussion

Corticotroph adenomas are divided into densely granulated, sparsely granulated and Crooke’s cell tumors. Sparsely granulated pattern is associated with larger tumor size and decreased remission rate after surgery.

Conclusion

This report illustrates a rare case of hypercortisolism remission due to apoplexy of a SGCT with subsequent central adrenal insufficiency, hypothyroidism and hypogonadism.

Keywords

pituitary apoplexy
pituitary macroadenoma
pituitary tumor
sparsely granulated corticotroph tumor
Cushing disease

Introduction

The incidence of Cushing Disease (CD) is estimated to be between 0.12 to 0.24 cases per 100,00 persons per year1,2. Of these, 7-23% are macroadenomas (>1 cm)345. Pituitary apoplexy is a potentially life-threatening endocrine and neurosurgical emergency which occurs due to infarction or hemorrhage in the pituitary gland. Apoplexy occurs most commonly in non-functioning macroadenomas with an estimated prevalence of 6.2 cases per 100,000 persons and incidence of 0.17 cases per 100,00 persons per year6. Corticotroph macroadenoma presenting with apoplexy is uncommon with only a handful of reports in the literature7. We present a case of a sparsely granulated corticotroph (SGCT) which presented with apoplexy leading to remission of hypercortisolism and subsequent central adrenal insufficiency.

Case Presentation

A 33-year-old male who was otherwise healthy and not on any medications presented to a community hospital with sudden and severe headache accompanied by hypotension, nausea, vomiting, bitemporal hemianopsia and diplopia. Computed Tomography (CT) scan of the brain demonstrated a hyperattenuating 2.0 cm x 2.8 cm x 1.5 cm mass at the sella turcica with extension into the right cavernous sinus and encasement of the right internal carotid arteries (Figure 1A). He was transferred to a tertiary care center for neurosurgical management with endocrinology consultation post-operatively.

  1. Download : Download high-res image (404KB)
  2. Download : Download full-size image

Figure 1. hyperattenuating 2.0 cm x 2.8 cm x 1.5 cm mass at the sella turcica on unenhanced CT (A); MRI demonstrated a 1.9 cm x 3.2 cm x 2.4 cm heterogeneous mass on T1 (B) and T2-weighted imaging (C) showing small hyperintense areas in solid part of the sella mass with flattening of the optic chiasm, remodeling/dehiscence of the floor of the sella and extending into the right cavernous sinus with at least partial encasement of the ICA

In retrospect, he reported a 3-year history of ongoing symptoms of hypercortisolism including increased central obesity, dorsal and supraclavicular fat pad, facial plethora, abdominal purple striae, easy bruising, fatigue, decreased libido and erectile dysfunction. Notably, at the time of presentation he did not have a history of diabetes, hypertension, osteoporosis, fragility fractures or proximal muscle weakness. He fathered 2 children previously. His physical examination was significant for Cushingoid facies, facial plethora, dorsal and supraclavicular fat pads and central obesity with significant axillary and abdominal wide purple striae (Figure 2). Neurological examination revealed bitemporal hemianopsia, right third cranial nerve palsy with ptosis and impaired extraocular movement. The fourth and sixth cranial nerves were intact as was the rest of his neurological exam. These findings were corroborated by Ophthalmology.

  1. Download : Download high-res image (477KB)
  2. Download : Download full-size image

Figure 2. Representative images illustrating facial plethora (A); abdominal striae (B, C); supraclavicular fat pad (D); dorsal fat pad (E)

Initial laboratory data at time of presentation to the hospital included elevated plasma cortisol of 64.08ug/dL (RR, 2.36 – 17.05), ACTH was not drawn at the time of presentation, normal TSH 0.89 mIU/L (RR, 0.36 – 3.74), free thyroxine 0.91ng/dL (RR, 0.76 – 1.46), evidence of central hypogonadism with low total testosterone 28.8 ng/dL (RR, 219.2 – 905.6) and inappropriately normal luteinizing hormone (LH) 1mIU/mL (RR, 1 – 12) and follicle stimulating hormone (FSH) 3mIU/mL (RR, 1 – 12), low prolactin <1 ng/mL (RR, 3 – 20), and normal insulin growth factor – 1 (IGF–1) 179ng/mL (RR, 82 – 242).

A pituitary gland dedicated MRI was performed to further characterize the mass, which re-demonstrated a 1.9 cm x 3.2 cm x 2.4 cm heterogenous mass at the sella turcica extending superiorly and flattening the optic chiasm, remodeling of the floor of the sella and bulging into the sphenoid sinus and extending laterally into the cavernous sinus with encasement of the right internal carotid artery (ICA). As per the radiologist’s diagnostic impression, this appearance was most in keeping with a pituitary macroadenoma with apoplexy (Figure 1B – C).

The patient underwent urgent TSS and decompression with no acute complications. Pathological examination of the pituitary adenoma showed features characteristic of sparsely granulated corticotroph pituitary neuroendocrine tumor (adenoma)8, with regional hemorrhage and tumor necrosis (apoplexy). The viable tumor exhibited a solid growth pattern (Figure 3A), t-box transcription factor (T-pit) nuclear immunolabeling (Figure 3B), diffuse cytoplasmic CAM5.2 (low molecular weight cytokeratin) immunolabeling (Figure 3C), and regional weak to moderate intense granular cytoplasmic ACTH immuno-staining (Figure 3D). The tumor was immuno-negative for: pituitary-specific positive transcription factor 1 (Pit-1) and steroidogenic factor 1 (SF-1) transcription factors, growth hormone, prolactin, TSH, FSH, LH, estrogen receptor-alpha, and alpha-subunit. Crooke hyalinization was not identified in an adjacent compressed fragment of non-adenomatous anterior pituitary tissue. Ki-67 immunolabeling showed a 1.5% proliferative index (11 of 726 nuclei).

  1. Download : Download high-res image (2MB)
  2. Download : Download full-size image

Figure 3. Hematoxylin phloxine saffron staining showing adenoma with solid growth pattern (A); immunohistochemical staining showing T-pit reactivity of tumor nuclei (B); diffuse cytoplasmic staining for cytokeratin CAM5.2 (C); and regional moderately intense granular cytoplasmic staining for ACTH (D). Scale bar = 20 μm

Post-operatively, he developed transient central diabetes insipidus requiring desmopressin but resolved on discharge. His postoperative cortisol was undetectable, ACTH 36 pg/mL (RR, 0 – 81), TSH 0.07 mIU/mL (RR, 0.36 – 3.74), free thyroxine 1 ng/dL (RR, 0.8 – 1.5), LH <1mIU/mL (RR, 1 – 12), FSH 1 mIU/mL (RR, 1 – 12) and testosterone 28.8 ng/dL (RR, 219.2 – 905.6) (Table 1 and Figure 4). One month later, he reported 15 pounds of weight loss and a 5-inch decrease in waist circumference. He also noted a reduction in the dorsal and supraclavicular fat pads, facial plethora, and Cushingoid facies as well as fading of the abdominal stretch marks. His visual field defects and right third cranial nerve palsy resolved on follow up with ophthalmology post-operatively. Repeat MRI six months post-operatively showed minor residual soft tissue along the floor of the sella. He is being followed by Neurosurgery, Ophthalmology, and Endocrinology for monitoring of disease recurrence, visual defects, and management of hypopituitarism.

Table 1. Pre- and post-operative hormonal panel

POD -1 POD 0 POD1 POD2 POD3 POD16 6 -9 months Comments
Cortisol(2.4 – 17 ug/dL) 64↓ 32↓ 11↓ <1.8↓ <1.8↓ 1.8↓ HC started POD3 post bloodwork
ACTH(0 – 81 pg/mL) 41↓ 36↓ 28↓ 13↓
TSH(0.36 – 3.74 uIU/mL) 0.89 0.43 0.12↓ 0.07↓ 0.05↓ 0.73
Thyroxine, free(0.8 – 1.5 ng/dL) 0.9 0.9 1.1 1 2.1↑ 1 Levothyroxine started POD4
LH(1 – 12 miU/mL) 1↓ <1↓ 1↓ 3
FSH(1 – 12 mIU/mL) 3↓ 1↓ 1↓ 3
Testosterone(219.2 – 905.6 ng/dL) 28.8↓ <20↓ 175.9↓ Testosterone replacement started as outpatient
Testosterone, free(160 – 699 pmol/L) <5.8↓ 137↓
IGF-1(82 – 242 ng/mL) 179 79
GH(fasting < 6 mIU/L) 4.5 <0.3
Prolactin(3 – 20 ng/mL) <1↓ <1↓

POD, postoperative day; HC, hydrocortisone; ACTH, adrenocorticotropic hormone; TSH, thyroid stimulating hormone; LH, luteinizing Hormone; FSH, follicle stimulating hormone; IGF-1, insulin like growth factor – 1; GH, growth hormone

  1. Download : Download high-res image (259KB)
  2. Download : Download full-size image

Figure 4. Trend of select pituitary hormonal panel with key clinical events denoted by black arrows.

Discussion

Microadenomas account for the majority of corticotroph tumors, but 7% – 23% of patients are diagnosed with a macroadenoma345. It is even rarer for a corticotroph macroadenoma to present with apoplexy with only a handful of case reports or series in the literature7. Due to its rarity, appropriate biochemical workup on presentation, such as including an ACTH with the blood work, may be omitted especially if the patient is going for emergent surgery. In this case, the undetectable prolactin can reflect loss of anterior pituitary function and also suggest a functioning corticotroph adenoma due to the inhibitory effect of long term serum glucocorticoids on prolactin secretion9. After undergoing TSS, the patient developed central adrenal insufficiency, hypothyroidism and hypogonadism requiring hormone replacement. Presumably, the development of adrenal insufficiency demonstrated the remission of hypercortisolism as a result of apoplexy and/or TSS. The ACTH remains detectable likely representing residual tumor that was not obliterated by apoplexy nor excised by TSS given it location near the carotid artery and cavernous sinus. The presence of adrenal insufficiency in the setting of detectable ACTH is not contradictory as the physiological hypothalamic-pituitary-adrenal axis has been suppressed by the long-term pathological production of ACTH. IGF-1 and prolactin also failed to recover post-operatively. In CD where the production of IGF-1 and prolactin are attenuated by elevated cortisol, it would then be expected that IGF-1 and prolactin recover after hypercortisolism remission. However, the absence of this observation in our case is likely a sequalae of the apoplexy and extensive surgery leading to pituitary hypofunction.

We also want to highlight features of the pre-operative radiographical findings which can provide valuable insight into the subsequent histology. Previous literature has shown that, on T2-weight MRI, silent corticotroph adenomas are strongly correlated with characteristic a multimicrocystic appearance while nonfunctional gonadotroph macroadenomas are not correlated with this MRI finding10. The multimicrocystic appearance is described as small hyperintense areas with hyperintense striae in the solid part of the tumor (Figure 1C)10. This is an useful predictive tool for silent corticotroph adenomas with a sensitivity of 76%, specificity of 95% and a likelihood ratio of 15.310.

The ability to distinguish between silent corticotroph macroadenoma and other macroadenomas is important for assessing rate of remission and recurrence risk. In 2017, the WHO published updated classification for pituitary tumors. In this new classification, corticotroph adenomas are further divided into densely granulated, sparsely granulated and Crooke’s cell tumors11. DGCT are intensely Periodic Acid Schiff (PAS) stain positive and exhibit strong diffuse pattern of ACTH immunoreactivity, whereas SGCT exhibit faintly positive PAS alongside weak focal ACTH immunoreactivity4,12. Crooke’s cell tumors are characterized by Crooke’s hyaline changes in more than 50% of the tumor cells4. In the literature, SGCT account for an estimated 19-29% of corticotroph adenomas131415. The clinicopathological relevance of granulation pattern in corticotroph tumors was unclear until recently.

In multiple studies examining granulation pattern and tumor size, SGCT were statistically larger13,15,16. Hence, we suspect that many of the previously labelled silent corticotroph macroadenomas in the literature were SGCT. The traditional teaching of CD has been “small tumor, big Cushing and big tumor, small Cushing” which reflects the inverse relationship between tumor size and symptomatology17. This observation appears to hold true as Doğanşen et al. found a trend towards longer duration of CD in SGCT of 34 months compared to 26 months in DGCT based on patient history13,17. It has been postulated that the underlying mechanism of the inverse relationship between tumor size and symptomatology is impaired processing of proopiomelanocortin resulting in less effective secretion of ACTH in corticotroph macroadenomas3. Doğanşen et al. also found that the recurrence rate was doubled for SGCT, while Witek et al. showed that SGCT were less likely to achieve remission postoperatively13,16.

Similar to other cases of SGCT, the diagnosis was only arrived retrospective after pathological confirmation10. Interestingly, the characteristic Crooke’s hyaline change of surrounding non-adenomatous pituitary tissue was not observed as one would expect in a state of prolonged glucocorticoid excess in this case. Although classically described, the absence of this finding does not rule out CD. As evident in a recent retrospective study where 10 out of 144 patients with CD did not have Crooke’s hyaline change18. In patients without Crooke’s hyaline change, the authors found a lower remission rate of 44.4% compared to 73.5% in patients with Crooke’s hyaline change. Together with the detectable post-operative ACTH, sparsely granulated pattern and absence of Crooke’s hyaline change in surrounding pituitary tissue, the risk of recurrence is increased. These risk factors emphasize the importance of close monitoring to ensure early detection of recurrence.

Declaration of Interests

☒ The authors declare that they have no known competing financial interests or personal relationships that could have appeared to influence the work reported in this paper.

☐The authors declare the following financial interests/personal relationships which may be considered as potential competing interests:

Conclusion

We present a case of a sparsely granulated corticotroph macroadenoma presenting with apoplexy leading to remission of hypercortisolism and development of central adrenal insufficiency, hypothyroidism and hypogonadism requiring hormone replacement.

References

A Promising In Vitro Model to Study Cushing’s Syndrome

Background: In Cushing’s syndrome (CS), chronic glucocorticoid excess (GC) and disrupted circadian rhythm lead to insulin resistance (IR), diabetes mellitus, dyslipidaemia and cardiovascular comorbidities. As undifferentiated, self-renewing progenitors of adipocytes, mesenchymal stem cells (MSCs) may display the detrimental effects of excess GC, thus revealing a promising model to study the molecular mechanisms underlying the metabolic complications of CS.

Methods: MSCs isolated from the abdominal skin of healthy subjects were treated thrice daily with GCs according to two different regimens: lower, circadian-decreasing (Lower, Decreasing Exposure, LDE) versus persistently higher doses (Higher, Constant Exposure, HCE), aimed at mimicking either the physiological condition or CS, respectively. Subsequently, MSCs were stimulated with insulin and glucose thrice daily, resembling food uptake and both glucose uptake/GLUT-4 translocation and the expression of LIPEATGLIL-6 and TNF-α genes were analyzed at predefined timepoints over three days.

Results: LDE to GCs did not impair glucose uptake by MSCs, whereas HCE significantly decreased glucose uptake by MSCs only when prolonged. Persistent signs of IR occurred after 30 hours of HCE to GCs. Compared to LDE, MSCs experiencing HCE to GCs showed a downregulation of lipolysis-related genes in the acute period, followed by overexpression once IR was established.

Conclusions: Preserving circadian GC rhythmicity is crucial to prevent the occurrence of metabolic alterations. Similar to mature adipocytes, MSCs suffer from IR and impaired lipolysis due to chronic GC excess: MSCs could represent a reliable model to track the mechanisms involved in GC-induced IR throughout cellular differentiation.

Introduction

Glucocorticoids (GCs) regulate a variety of physiological processes, such as metabolism, immune response, cardiovascular activity and brain function (12). Chronic excess and dysregulation of GCs induces Cushing’s syndrome (CS), a complex clinical condition characterized by multisystem morbidities such as central obesity, hypertension, type 2 diabetes mellitus, insulin resistance (IR), dyslipidaemia, fatty liver, hypercoagulability, myopathy and osteoporosis (35). In patients with CS, GC secretion does not follow the circadian rhythm and consistently high serum GC levels are observed throughout the day (67).

IR, defined as the reduced ability of insulin to control the breakdown of glucose in target organs, represents the common thread among obesity, metabolic syndrome and type 2 diabetes mellitus (8). GCs induce IR, but the mechanisms are complex and not completely understood. Under physiological conditions, the binding of insulin to its receptor on the cell surface induces the autophosphorylation of tyrosine in the insulin receptor substrate (IRS)-1 subunit with a consequent complex cascade of intracellular signals that leads to the inhibition of glycogen synthase kinase 3, the inhibition of apoptosis and the translocation of glucose transporter 4 (GLUT4) to the cell membrane with consequent glucose uptake (910). Several studies have shown how chronic exposure to high levels of GCs reduces IRS-1 phosphorylation and protein expression, resulting in a lack of GLUT4 translocation and a reduction in glucose uptake in adipose tissue (11). In addition, the chronic excess of GCs increases lipoprotein activity and expression with subsequent release of circulating fatty acids, which, in turn, induce the phosphorylation of serine in IRS-1, thus compromising the mechanisms that lead to glucose transport into the cell (12).

In recent years, the involvement of mesenchymal stem cells (MSCs) in the onset of different pathologies has been addressed, and for some of them, MSCs have been identified as the real target for lasting therapeutic approaches (1314). MSCs are undifferentiated cells inside many tissues that are able to self-renew and differentiate into adipocytes, osteocytes and chondrocytes (15).

Adipose tissue, muscle tissue and bone are compromised in CS, so the involvement of MSCs in CS complications has been hypothesized; this was confirmed by our previous work reporting that MSCs isolated from the skin of patients affected by CS showed an altered wound healing process that is recognized as a clinical manifestation of CS (16).

In this scenario, it is tempting to speculate that the detrimental effects of excess GC could also affect MSCs, which may represent a promising cellular model to study the mechanisms leading to IR. The choice to use MSCs as a model is particularly interesting, since MSCs are the progenitors of mature adipocytes that may inherit and spread dysregulated mechanisms already present in MSCs.

Here, MSCs isolated from the abdominal skin of healthy subjects were treated in vitro with two different GC regimens, mimicking circadian cortisol rhythm and chronic hypercortisolism. Subsequently, cells were stimulated with insulin and glucose three times/day, resembling the normal uptake of food, and both glucose uptake and the expression of selected genes were analyzed to clarify the mechanisms underlying the development of IR and the occurrence of altered carbohydrate and lipid metabolism under chronic exposure to high levels of GCs.

Materials and Methods

Sample Collection

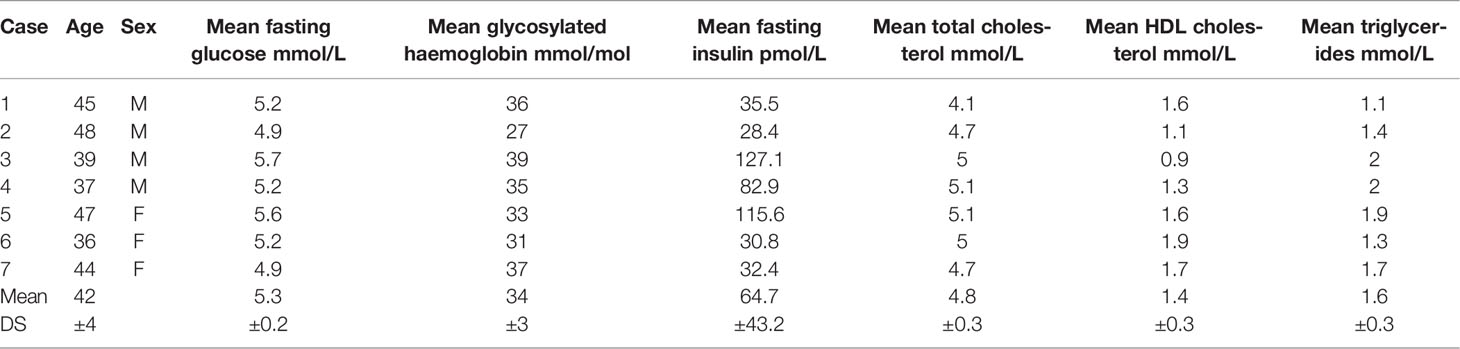
Seven abdominal skin samples were collected from healthy subjects (four males and three females age matched 42.3 ± 3.4) undergoing abdominoplasty at the Clinic of Plastic and Reconstructive Surgery, Università Politecnica delle Marche. Patients gave their informed consent; the study was approved by the Università Politecnica delle Marche Ethical Committee and conducted in accordance with the Declaration of Helsinki. The main demographical and clinical characteristics of enrolled patients are summarized in Table 1.

TABLE 1

www.frontiersin.orgTable 1 Demographical and functional characteristics of enrolled patients.

Isolation and Characterization of MSCs

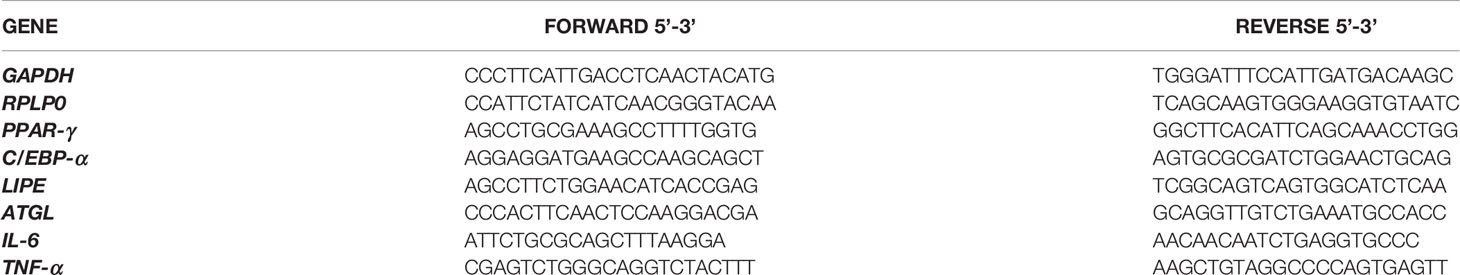
Cells were isolated from abdominal skin and then cultured with a Mesenchymal Stem Cell Growth Medium bullet kit (MSCGM, Lonza Group® Ltd) as previously described (16) and characterized according to the criteria by Dominici (15). Plastic adherence, immunophenotype and multipotency were tested as already described (1719). After the Oil Red staining, a semiquantitative analysis was carried out by dissolving the staining with 100% isopropanol and the absorbance was measured at 510nm in a microplate reader (Thermo Scientific Multiskan GO Microplate Spectrophotometer, Milano, Italy). In addition, the expression of PPAR-γ (peroxisome proliferator-activated receptor gamma) and C/EBP-α (CCAAT/enhancer-binding protein alpha) was tested by Real time PCR to confirm the adipocytes differentiation. Undifferentiated MSCs were used as control (C-MSCs). Briefly, after 21 days of culture in adipocytes differentiation medium, 2.5×10⁵ cells from the 7 patients were collected; cDNA synthesis and qRT–PCR were carried out as previously described (20). The primer sequences are summarized in Table 2. mRNA expression was calculated by the 2−ΔΔCt method (21), where ΔCt=Ct (gene of interest)—Ct (control gene) and Δ (ΔCt)=ΔCt (differentiated MSCs)—ΔCt (undifferentiated MSCs). Genes were amplified in triplicate with the housekeeping genes RPLP0 (Ribosomal Protein Lateral Stalk Subunit P0) and GAPDH (Glyceraldehyde-3-Phosphate Dehydrogenase) for data normalization. Of the two, GAPDH was the most stable and was used for subsequent normalization. The values of the relative expression of the genes are mean ± SD of three independent experiments.

TABLE 2

www.frontiersin.orgTable 2 Primer sequences.

Experimental Design: In Vitro Reproduction of Both Circadian Rhythm and Chronic Excess GCs and Food Uptake

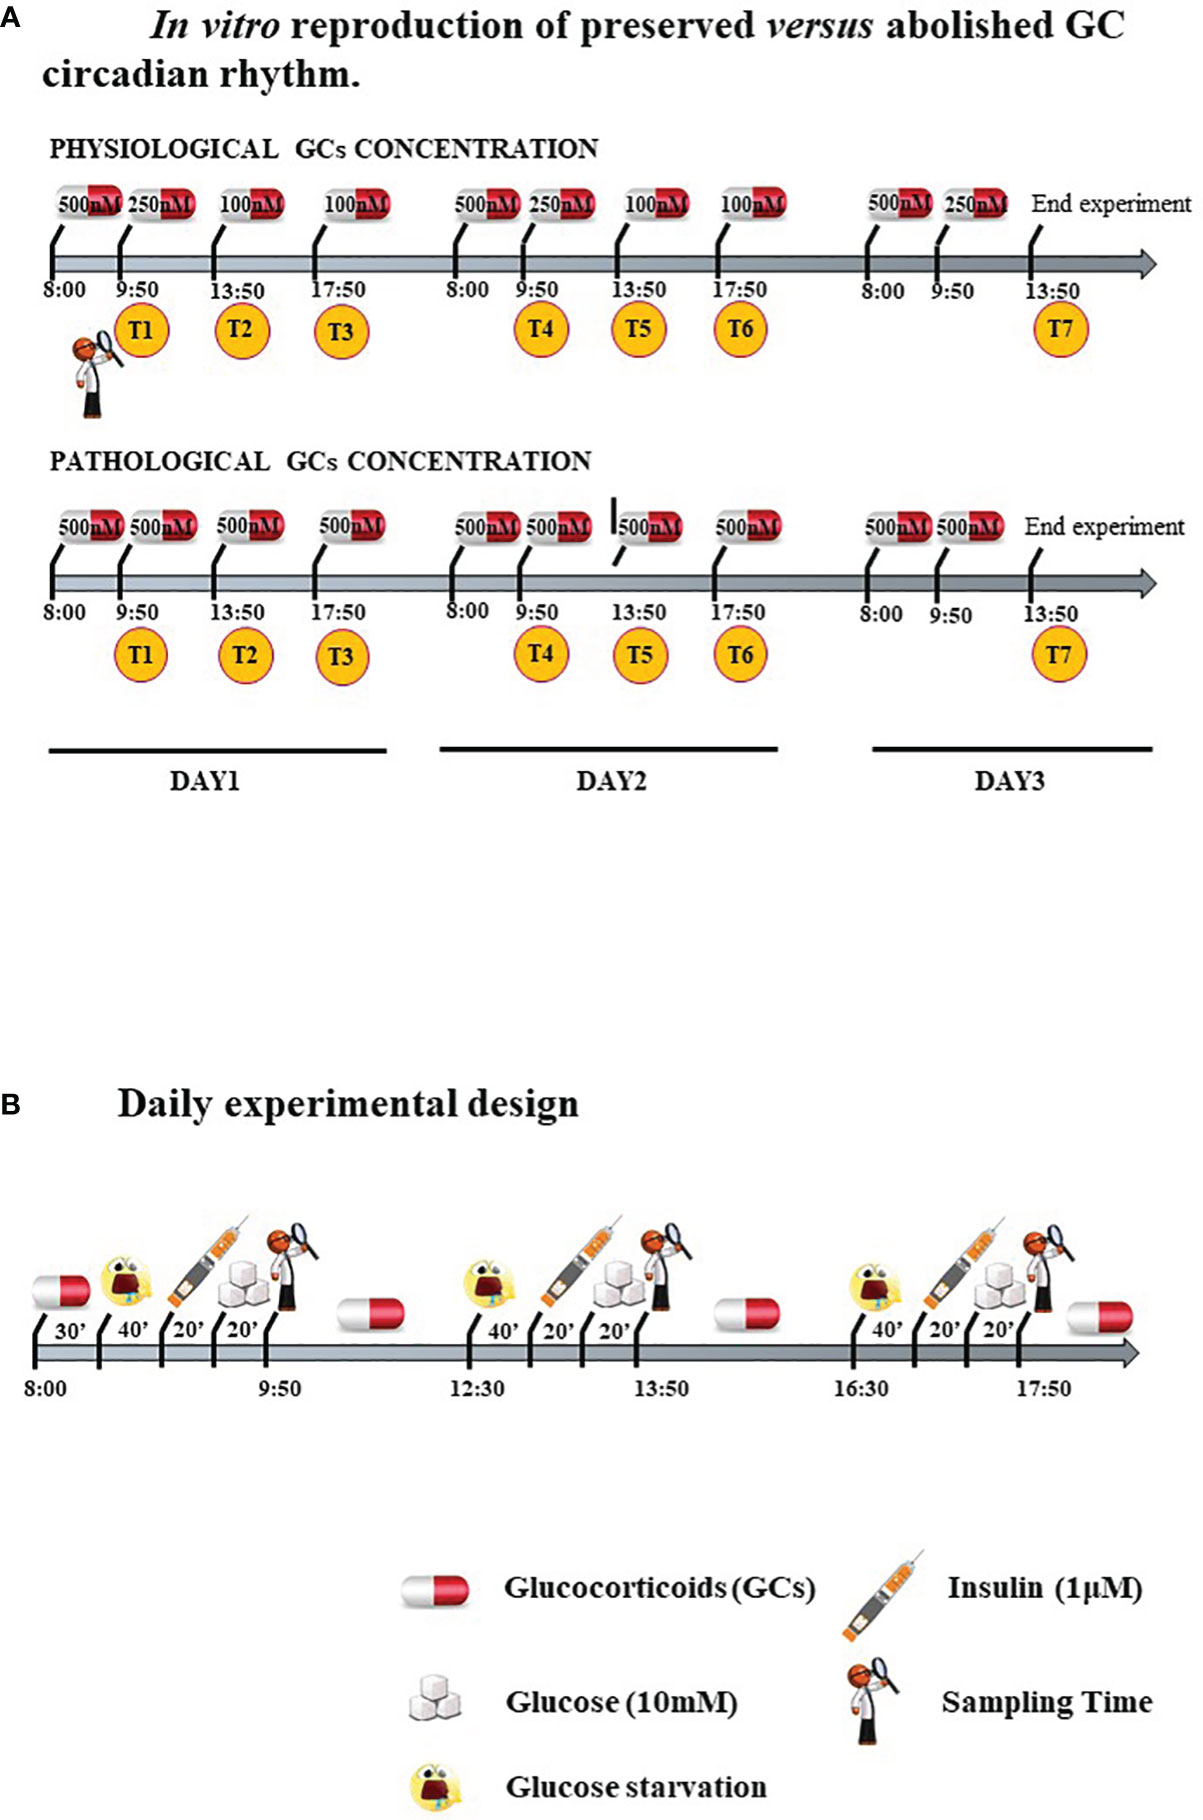
Cells were treated with two different GC regimens: some were given lower, circadian-decreasing GC doses (Lower and Decreasing Exposure, LDE), some were exposed to persistently higher GC doses (Higher and Constant Exposure, HCE), to mimic in vitro either the preserved circadian rhythm or its pathologic abolishment in CS, as shown in Figure 1A and described in detail below. LDE cells were first exposed (8:00 a.m.-9:50 a.m.) to 500 nM hydrocortisone (MedChemExpress, MCE, Monmouth Junction, NJ, USA) and then to decreasing concentrations by replacing the medium with a fresh medium containing 250 nM hydrocortisone (9:50 a.m.-01:50 p.m.) and 100 nM (01:50 p.m.-05:50 p.m. and 05:50 p.m.-08:00 a.m.) of hydrocortisone (22). To mimic CS, HCE cells were exposed to 500 nM hydrocortisone for 24/24 hours. The 500 nM hydrocortisone medium was replaced with fresh medium at the same time as the physiological condition medium was changed.

FIGURE 1

www.frontiersin.orgFigure 1 (A) In vitro reproduction of preserved versus abolished GC circadian rhythm. (B). Daily experimental design.

Cells were starved and exposed three times/day to 10 mM glucose with or without prestimulation with 1 μM insulin (Sigma–Aldrich, Milano, Italy) to resemble daily food uptake.

Protocol is resumed in Figure 1B.

Cells derived from each single patient were divided into six experimental groups (Exp):

1) Exp 1, GLU: Cells exposed to glucose;

2) Exp 2, INS+GLU: Cells stimulated with insulin before glucose exposure;

3) Exp 3, LDE+GLU: LDE cells treated with glucose;

4) Exp 4, HCE+GLU: HCE cells treated with glucose;

5) Exp 5, LDE+INS+GLU: LDE cells stimulated with insulin before glucose exposure;

6) Exp 6, HCE+INS+GLU: HCE cells stimulated with insulin before glucose exposure.

In detail, cells were seeded in DMEM/F-12+10% FBS (Corning, NY, USA). After 24 hours, the medium was changed, and the cells were starved overnight with Advanced DMEM/F-12 w/o glucose (Lonza) with 0.5% FBS. At 8:00 a.m., starvation medium was replaced with a new medium containing hydrocortisone 500 nM for 30 minutes in groups exposed to GCs. After washing, the cells were glucose starved with KRPH buffer (20 mM HEPES, 5 mM KH2PO4, 1 mM MgSO4, 1 mM CaCl2, 136 mM NaCl and 4.7 mM KCl, pH 7.4) containing 2% BSA (Sigma–Aldrich) and hydrocortisone for 40 minutes. Cells from Exp 2, 5 and 6 were then stimulated with 1 μM insulin (Sigma–Aldrich) for 20 minutes. Finally, 10 mM glucose was added, and the time sampling was after 20 minutes.

The same protocol starting with starvation for 2 hours in DMEM/F-12 w/o glucose was repeated two times during the day, and the hydrocortisone concentration in the medium of LDE and HCE cells varied accordingly.

To evaluate the long-term impact on metabolism and IR, the experiment was performed for three days with repeated sampling times after glucose administration: T1, T2 and T3 at 9:50 a.m., 1:50 p.m., 5:50 p.m. of the first day; T4, T5 and T6 at 9:50 a.m., 1:50 p.m., 5:50 p.m. of the second day; T7 at 1:50 p.m. of the third day (Figure 1A).

The entire experiment (Exp 1-6, from T1 to T7) was repeated thrice, and data are reported as mean± standard deviation (SD) over the three independent experiments.

XTT Assay

To evaluate whether repeated starvation steps and treatments would affect cell viability and consequently influence the measurement of glucose uptake, an XTT assay (Sigma–Aldrich) was initially performed. A total of 3×10³ cells/well belonging to Exp 1, 2, 4 and 6 derived from the 7 patients were plated in a 96-well plate and treated as previously described. Another experimental group was included as a control, consisting of cells continuously cultured in starvation medium (STARVED CTRL). The XTT assay was performed at the end of each day (T3, T6 and T7 sampling times) following the manufacturer’s instructions. The experiment was repeated thrice, and data are reported as mean ± SD over the three independent experiments.

MSCs Responsiveness to Insulin

To evaluate whether MSCs were responsive to insulin, glucose uptake and the cellular localization of GLUT4 were first evaluated in MSCs not treated with GCs (Exp 1 and 2) from T1 to T6.

For the glucose uptake assay, 3×10³ cells/well were plated in a 96-well plate and treated according to the above protocol; after insulin stimulation, 10 mM of 2-deoxyglucose (2-DG) was added for 20 minutes, and a colorimetric assay was performed following the manufacturer’s instructions. The readings were at 420 nm in a microplate reader (Thermo Scientific Multiskan GO Microplate Spectrophotometer, Milano, Italy).

For the cellular distribution of GLUT4, 1.5×10⁴ cells (Exp 1 and 2 derived from the 7 patients) were seeded in triplicate on coverslips and treated as indicated before until T5 sampling time. Cells were then washed, fixed with 4% PFA and permeabilized for 30 min. Subsequently, cells were incubated with anti-GLUT4 antibody (Santa Cruz Biotechnology, USA) followed by treatment for 30 min with a goat anti-mouse FITC-conjugated antibody (23). Finally, coverslips were mounted on glass slides in Vectashield (Vectorlabs, CA, USA), and confocal imaging was performed using a Zeiss LSM510/Axiovert 200 M microscope with an objective lens at 20× magnification (24). Line scans were acquired excluding nuclear regions, and GLUT4 immunofluorescence was analyzed as described elsewhere.

Effects of Different GC Regimens on Glucose Uptake and GLUT4 Translocation

After having proven that MSCs could function as a cellular model, since they were responsive to insulin, the potential effects of both GC regimens on glucose uptake were evaluated.

Glucose uptake was measured in the experimental groups treated with GCs (Exp 3, 4, 5 and 6 derived from the 7 patients), and GLUT4 translocation was evaluated in cells from Exp 4 and 6 as described above.

Expression of Genes Involved in the Development of IR

The expression of selected genes, such as LIPEATGLIL-6 and TNF-α (coding for hormone-sensitive Lipase E, Adipose TriGlyceride Lipase, InterLeukin-6 and Tumour Necrosis Factor-α, respectively), was evaluated to clarify the mechanisms involved in the development of IR in MSCs (2528). A total of 2.5×10⁵ cells/well belonging to Exp 5 and 6 from the 7 patients were seeded in triplicates in a 6-well plate and treated following the experimental design. Pellets were collected at T2 and T7, which were chosen as sampling times representing acute and chronic exposure to GCs. RNA extraction, cDNA synthesis and qRT–PCR were carried out as previously described (20). The primer sequences are summarized in Table 2. mRNA expression was calculated by the 2−ΔΔCt method (21), where ΔCt=Ct (gene of interest)—Ct (control gene) and Δ (ΔCt)=ΔCt (HCE+INS+GLU)—ΔCt (LDE+INS+GLU). All selected genes were amplified in triplicate with the housekeeping genes RPLP0 and GAPDH for data normalization. Of the two, GAPDH was the most stable and was used for subsequent normalization. The values of the relative expression of the genes are mean ± SD of three independent experiments.

Statistical Analysis

For statistical analysis, GraphPad Prism 6 Software was used. All data are expressed as the mean ± standard deviation (SD). For parametric analysis all groups were first tested for normal distribution by the Shapiro–Wilk test (29) and comparison between 2 groups were performed by unpaired Student’s t test. For two-sample comparisons, significance was calculated by unpaired t-Student’s test while the ordinary one-way ANOVA test was used for multiple comparison (Tukey’s multiple comparisons test). Significance was set at p value < 0.05.

Results

MSCs Isolation and Characterization From Abdominal Skin

MSCs isolated from abdominal skin appeared homogeneous with a fibroblastoid morphology and showed adherence to plastic. According to Dominici’s criteria (17), cells were positive for CD73, CD90 and CD105, and negative for HLA-DR, CD14, CD19, CD34 and CD45.

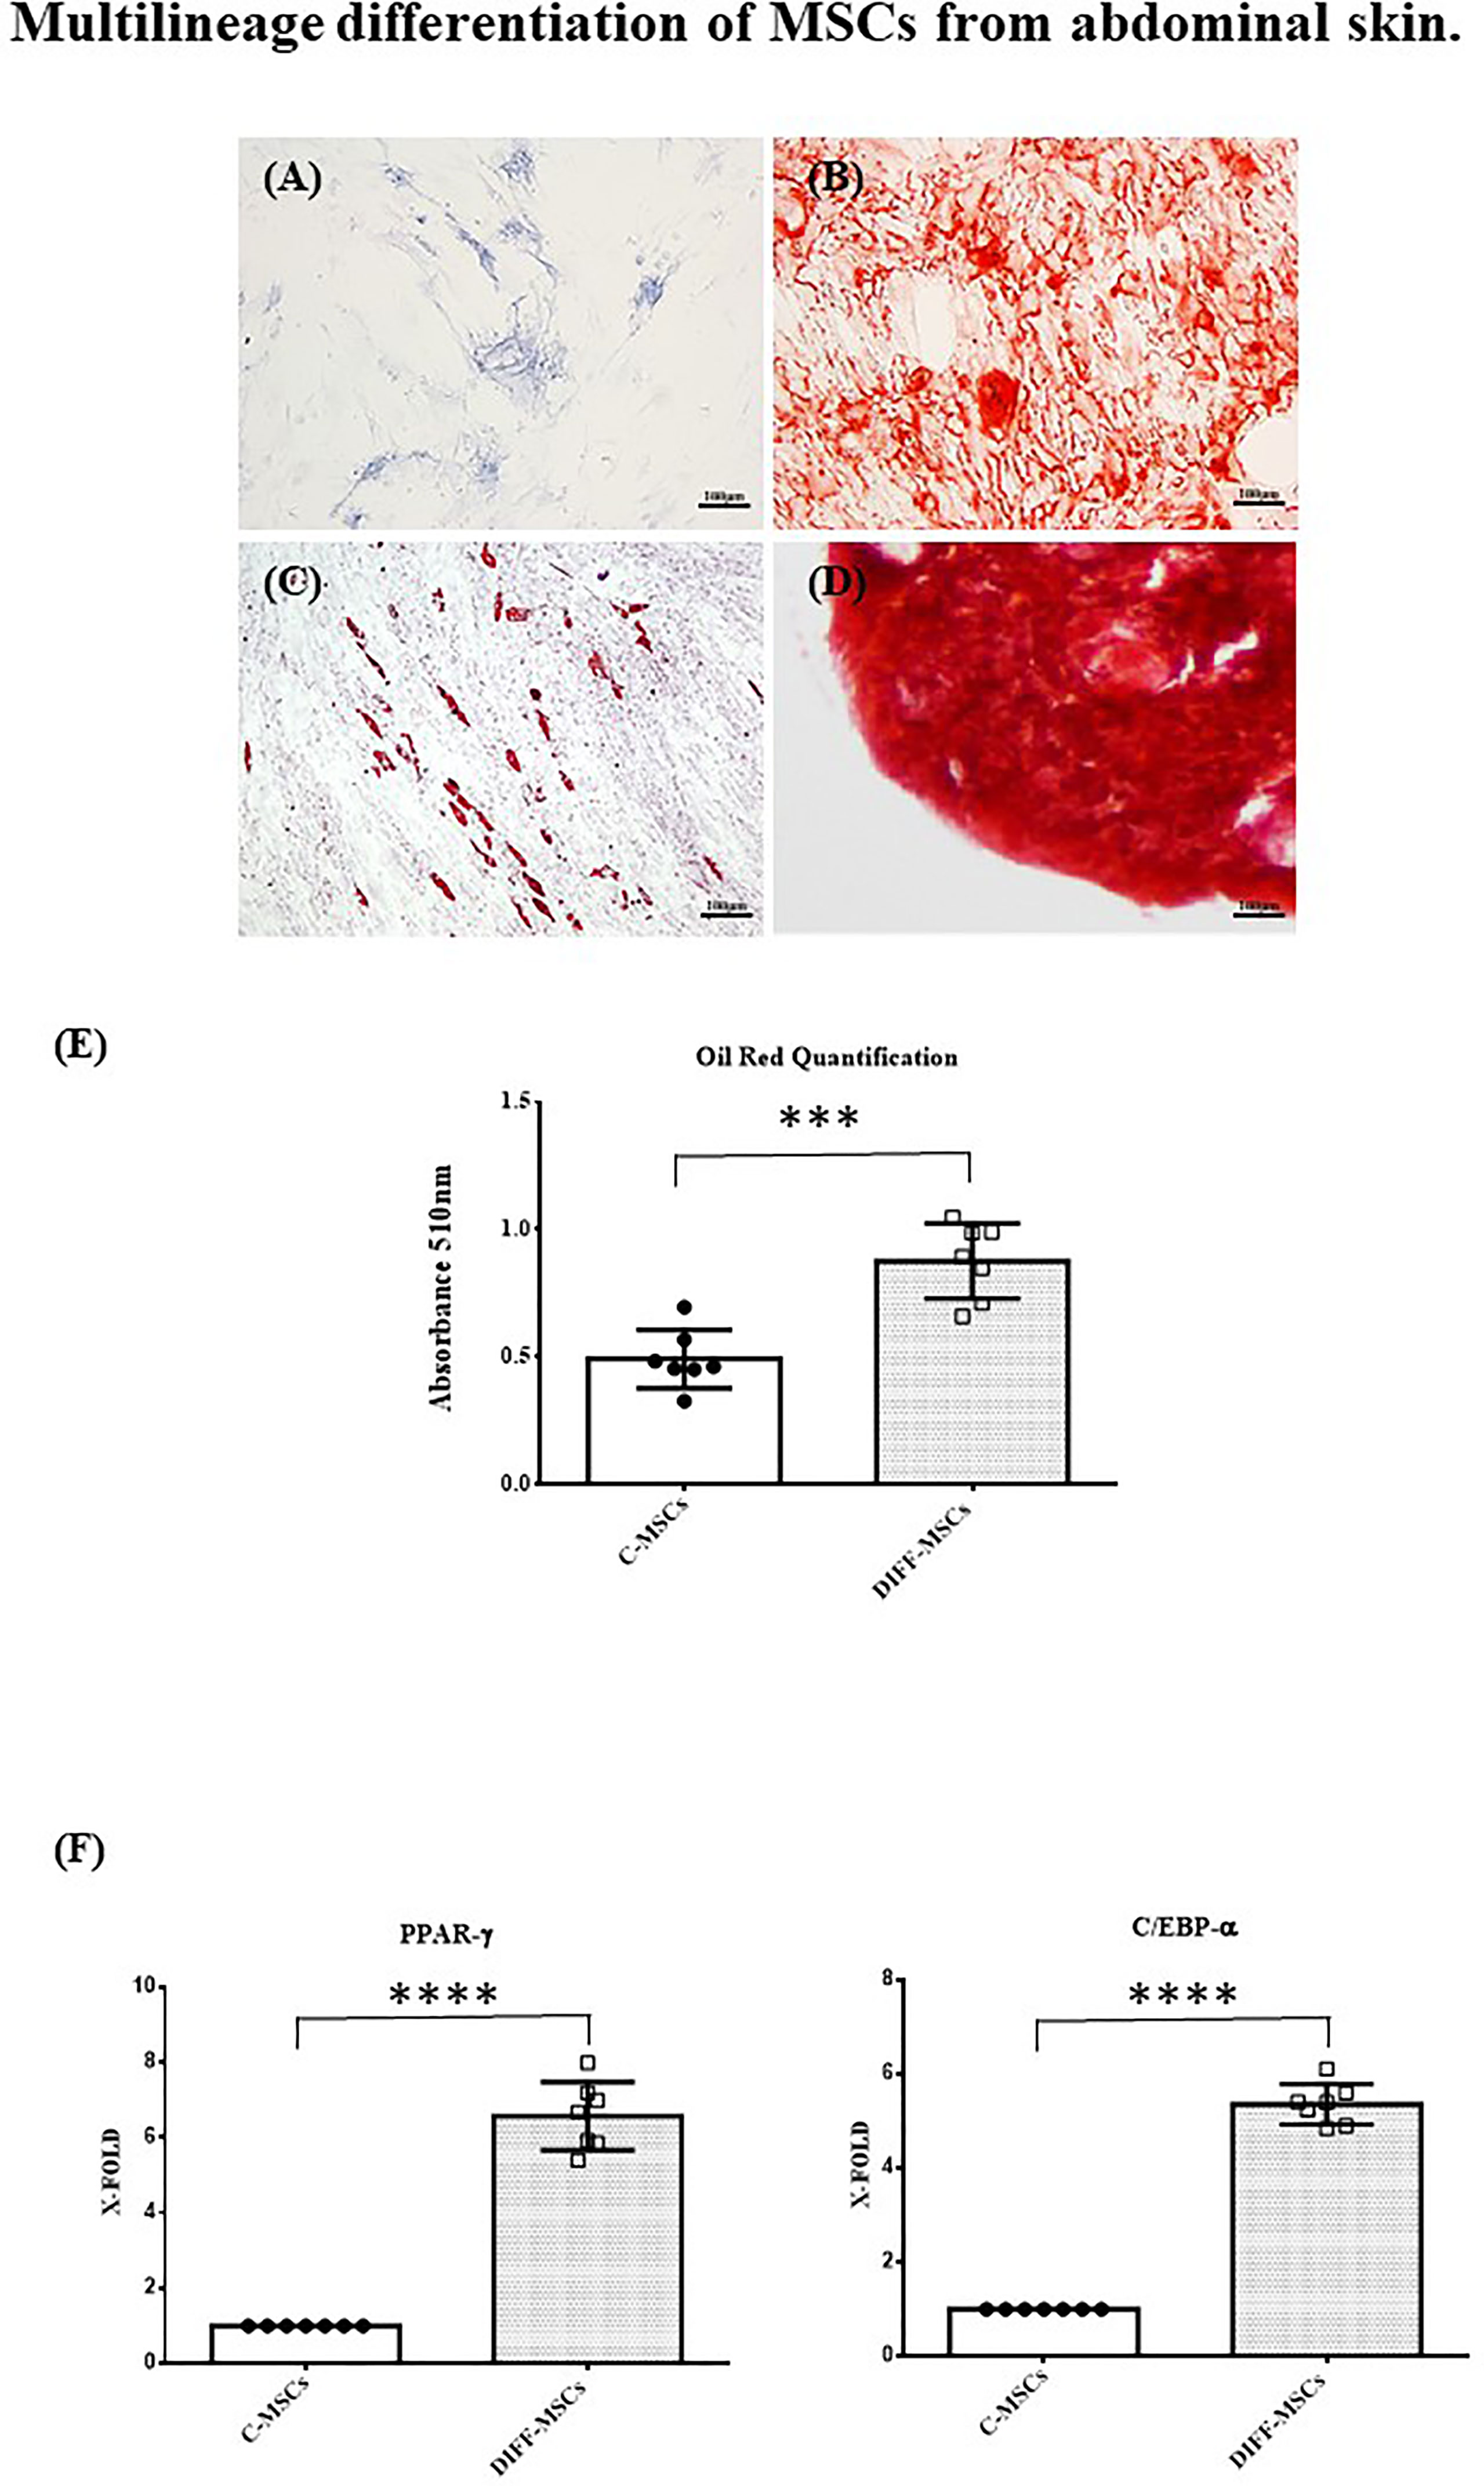
Cells were also able to differentiate towards osteogenic, chondrogenic and adipogenic lineages. After 7 days of osteogenic differentiation, cells showed alkaline phosphatase activity (Figure 2A), and after 14 days, cells were strongly positive for alizarin red staining (Figure 2B). Chondrogenic differentiation was achieved after 30 days, as shown by safranin-O staining (Figure 2C). MSCs differentiation into adipocytes occurred after 21 days, as evidenced by the presence of lipid vacuoles after oil red staining (Figure 2D). Its quantification confirmed as the amount of lipid vacuoles was higher in differentiated cells than in control cells (C-MSCs; Figure 2E). The expression of PPAR-γ and C/EBP-α was tested after 21 days of culture in differentiating medium and it was higher in differentiated than in undifferentiated MSCs (Figures 2F, G).

FIGURE 2

www.frontiersin.orgFigure 2 Multilineage differentiation of MSCs from abdominal skin. Representative images of MSCs derived from the seven patients and differentiated towards osteogenic lineage as assessed by ALP reaction (A, Scale bar 100μm) and Alizarin red staining (B, Scale bar 100μm); chondrogenic lineage as indicated by Safranin-O staining (C, Scale bar 100 μm); adipocyte lineage as confirmed by Oil red staining (D, Scale bar 100μm); (E) Oil Red staining quantification. Data are expressed as mean ± SD of the absorbance read for undifferentiated and differentiated cells (C-MSCs and DIFF-MSCs respectively). (F, G) Expression of PPAR-γ and C/EBP-α by RT-PCR in differentiated vs undifferentiated MSCs towards adipogenic lineage. Data are expressed as mean ± SD (over three independent experiments) of the X-fold (2−ΔΔCt method) of differentiated MSCs compared to undifferentiated MSCs, arbitrarily expressed as 1, where ΔCt=Ct (gene of interest)—Ct (control gene) and Δ (ΔCt)=ΔCt (DIFF-MSCs)—ΔCt (C-MSCs). Unpaired t-Student’s test; ***p<0.001, ****p<0.0001.

Cell Viability by XTT Assay

Figure 3 shows that the viability of the STARVED CTRL (cells continuously cultured in starvation medium) was significantly increased compared to that of the HCE cells at T3 but not thereafter. Although repeated interventions caused a proliferation block earlier than starvation alone, the different treatments did not interfere with vitality, and further analyses on glucose uptake were unaffected by different cell mortality during the experiment.

FIGURE 3

www.frontiersin.orgFigure 3 XTT test. The bars indicate cells’ viability at T3, T6 and T7 sampling times. One-way ANOVA; **p < 0.01 vs STARVED CTRL inside each time sampling. STARVED CTRL: cells continuously cultured in starvation medium; GLU: Cells exposed to glucose; INS+GLU: Cells stimulated with insulin before glucose exposure; HCE+GLU: HCE (Higher and Constant Exposure) cells treated with glucose; HCE+INS+GLU: HCE cells stimulated with insulin before glucose exposure. Data are expressed as mean ± SD of the absorbance read for MSCs derived from each single patient over three independent experiments.

MSCs Responsiveness to Insulin

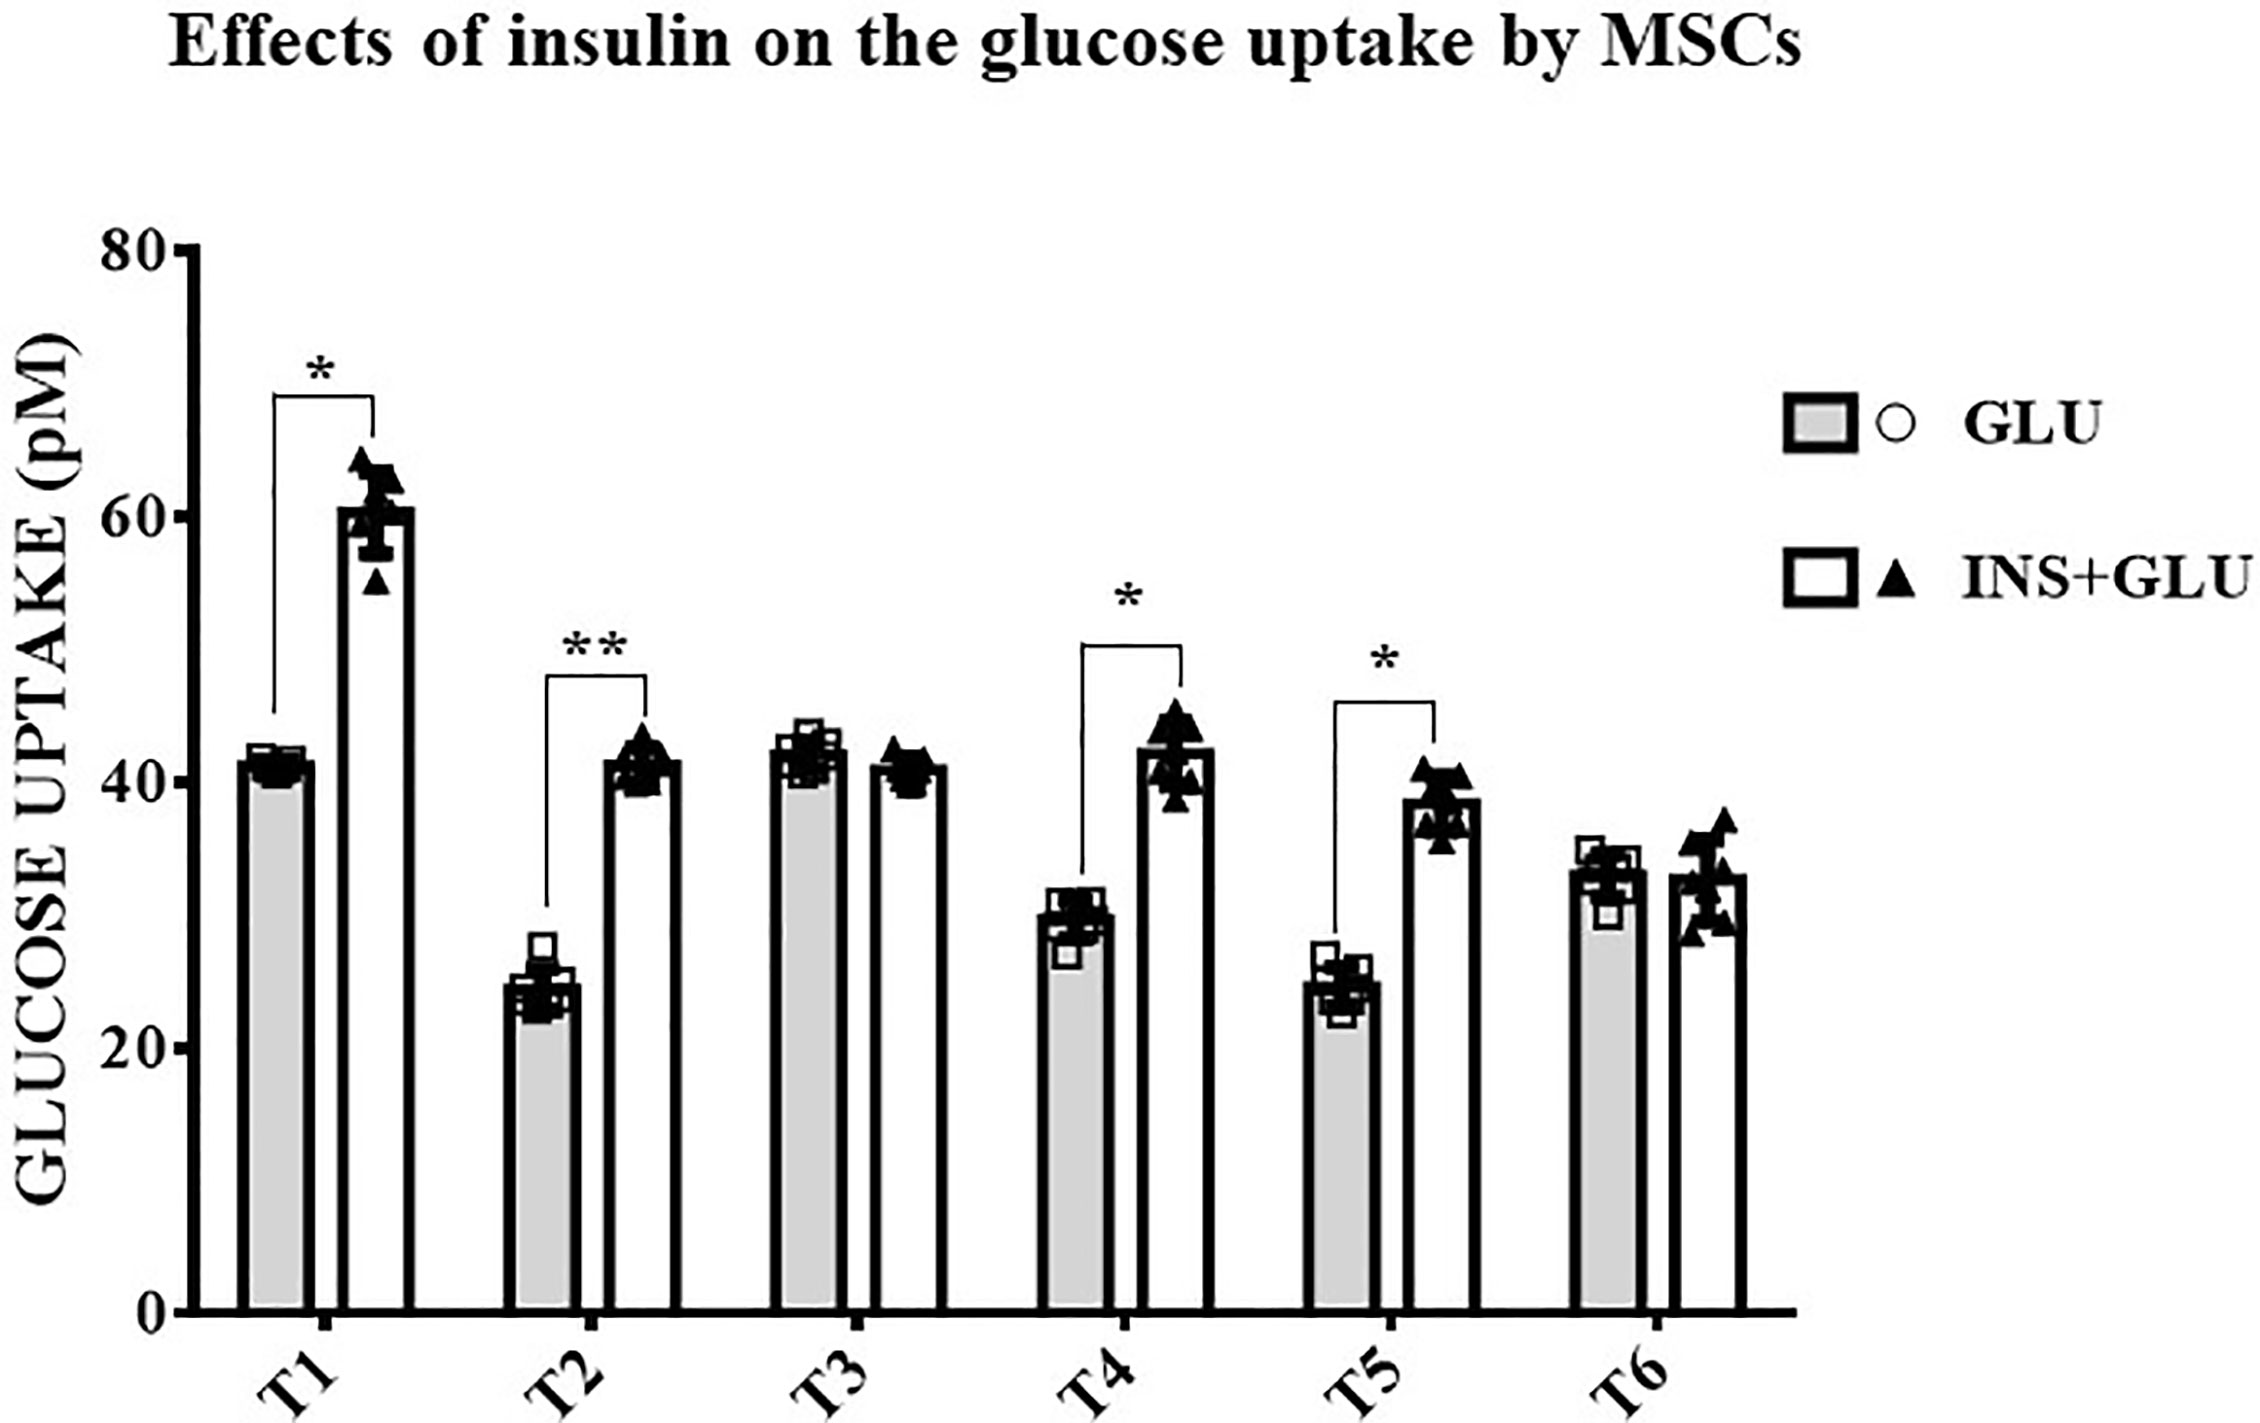
As shown in Figure 4, stimulation with insulin significantly increased glucose uptake at T1, T2, T4 and T5, whereas at T3 and T6, the level of glucose uptake did not differ significantly between insulin-treated (Exp2, INS+GLU) and nontreated (Exp1, GLU) cells.

FIGURE 4

www.frontiersin.orgFigure 4 Responsiveness of MSCs to insulin. The bars show the glucose uptake expressed in pM at T1, T2, T3, T4, T5 and T6 in insulin-stimulated or non-stimulated MSCs. Unpaired t-Student’s test; *p < 0.05, **p < 0.01. GLU: Cells exposed to glucose; INS+GLU: Cells stimulated with insulin before glucose exposure. Data are expressed as mean ± SD of the readings for MSCs derived from each single patient over three independent experiments.

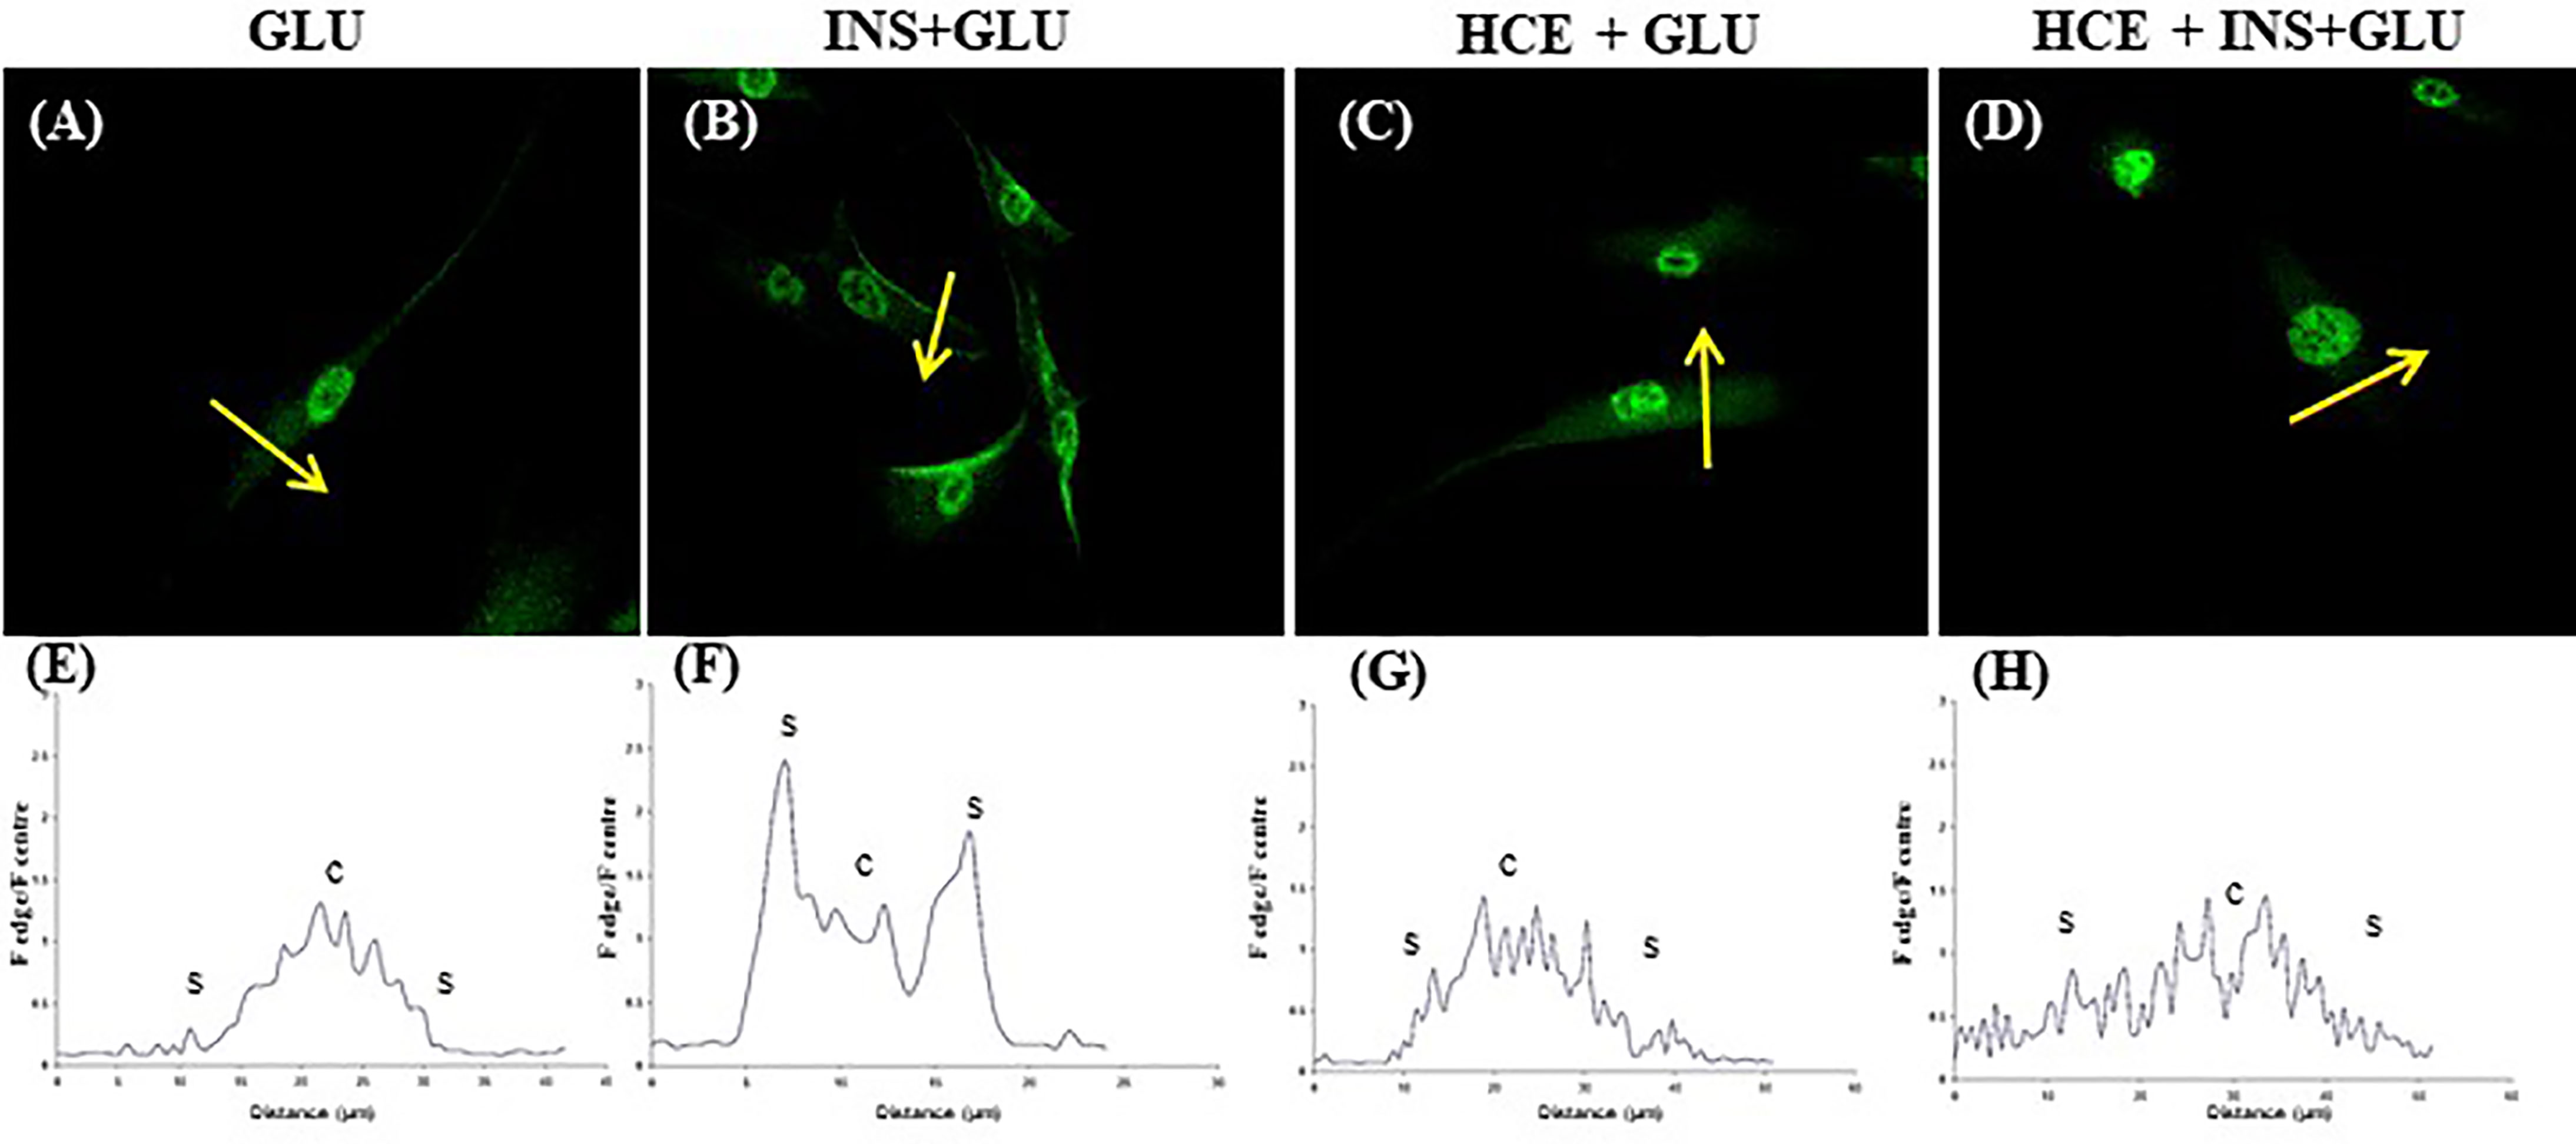
Notably, in the absence of insulin, GLUT4 was more localized in the perinuclear area of the cells (Figures 5A, E). Insulin stimulation enhanced GLUT4 translocation towards the plasma membrane (Figures 5B, F).

FIGURE 5

www.frontiersin.orgFigure 5 GLUT4 translocation. Representative confocal images of GLUT4 in MSCs derived from the seven patients and stimulated (B, D) or not (A, C) with insulin and exposed to 500nM of GCs (C, D). The graphs (E–H) show the fluorescence ratio between the edge and the centre of the cell; yellow arrows indicate the portion of cell subjected to analysis. GLU: Cells exposed to glucose; INS+GLU: Cells stimulated with insulin before glucose exposure; HCE+GLU: HCE (Higher and Constant Exposure) cells treated with glucose; HCE+INS+GLU: HCE cells stimulated with insulin before glucose exposure.

Effects of LDE and HCE on GCs on Glucose Uptake and GLUT4 Translocation

In LDE cells, insulin induced a significant increase in glucose uptake at all sampling times (Figure 6). Conversely, GC administration did not interfere with glucose uptake by HCE cells in the acute period (T1, T2) but led to a significant decrease in glucose uptake when prolonged (T3, T5, T6, T7). Accordingly, GLUT4 translocation was inhibited irrespective of insulin stimulation (Figures 5C, G and D, H) in HCE cells.

FIGURE 6

www.frontiersin.orgFigure 6 Glucose uptake in MSCs undergoing a LDE or a HCE to GCs. The bars represent the glucose uptake expressed in pM at T1 (9:50 a.m. first day, A), T2 (1:50 p.m. first day, B), T3 (5:50 p.m. first day, C), T4 (9:50 a.m. second day, D), T5 (1:50 p.m. second day, E), T6 (5:50 p.m. second day, F) and T7(1:50 p.m. third day, G) in MSCs undergoing a LDE or a HCE to GCs and stimulated or not with insulin. One-way ANOVA; *p < 0.05,**p < 0,01,***p < 0,001. LDE+GLU: LDE (Lower and Decreasing Exposure) cells treated with glucose; HCE+GLU: HCE (higher and Constant Exposure) cells treated with glucose; LDE+INS+GLU: LDE cells stimulated with insulin before glucose exposure; HCE+INS+GLU: HCE cells stimulated with insulin before glucose exposure. Data are expressed as mean ± SD of the readings for MSCs derived from each single patient over three independent experiments.

Effect on Lipolysis and Development of IR: Gene Expression

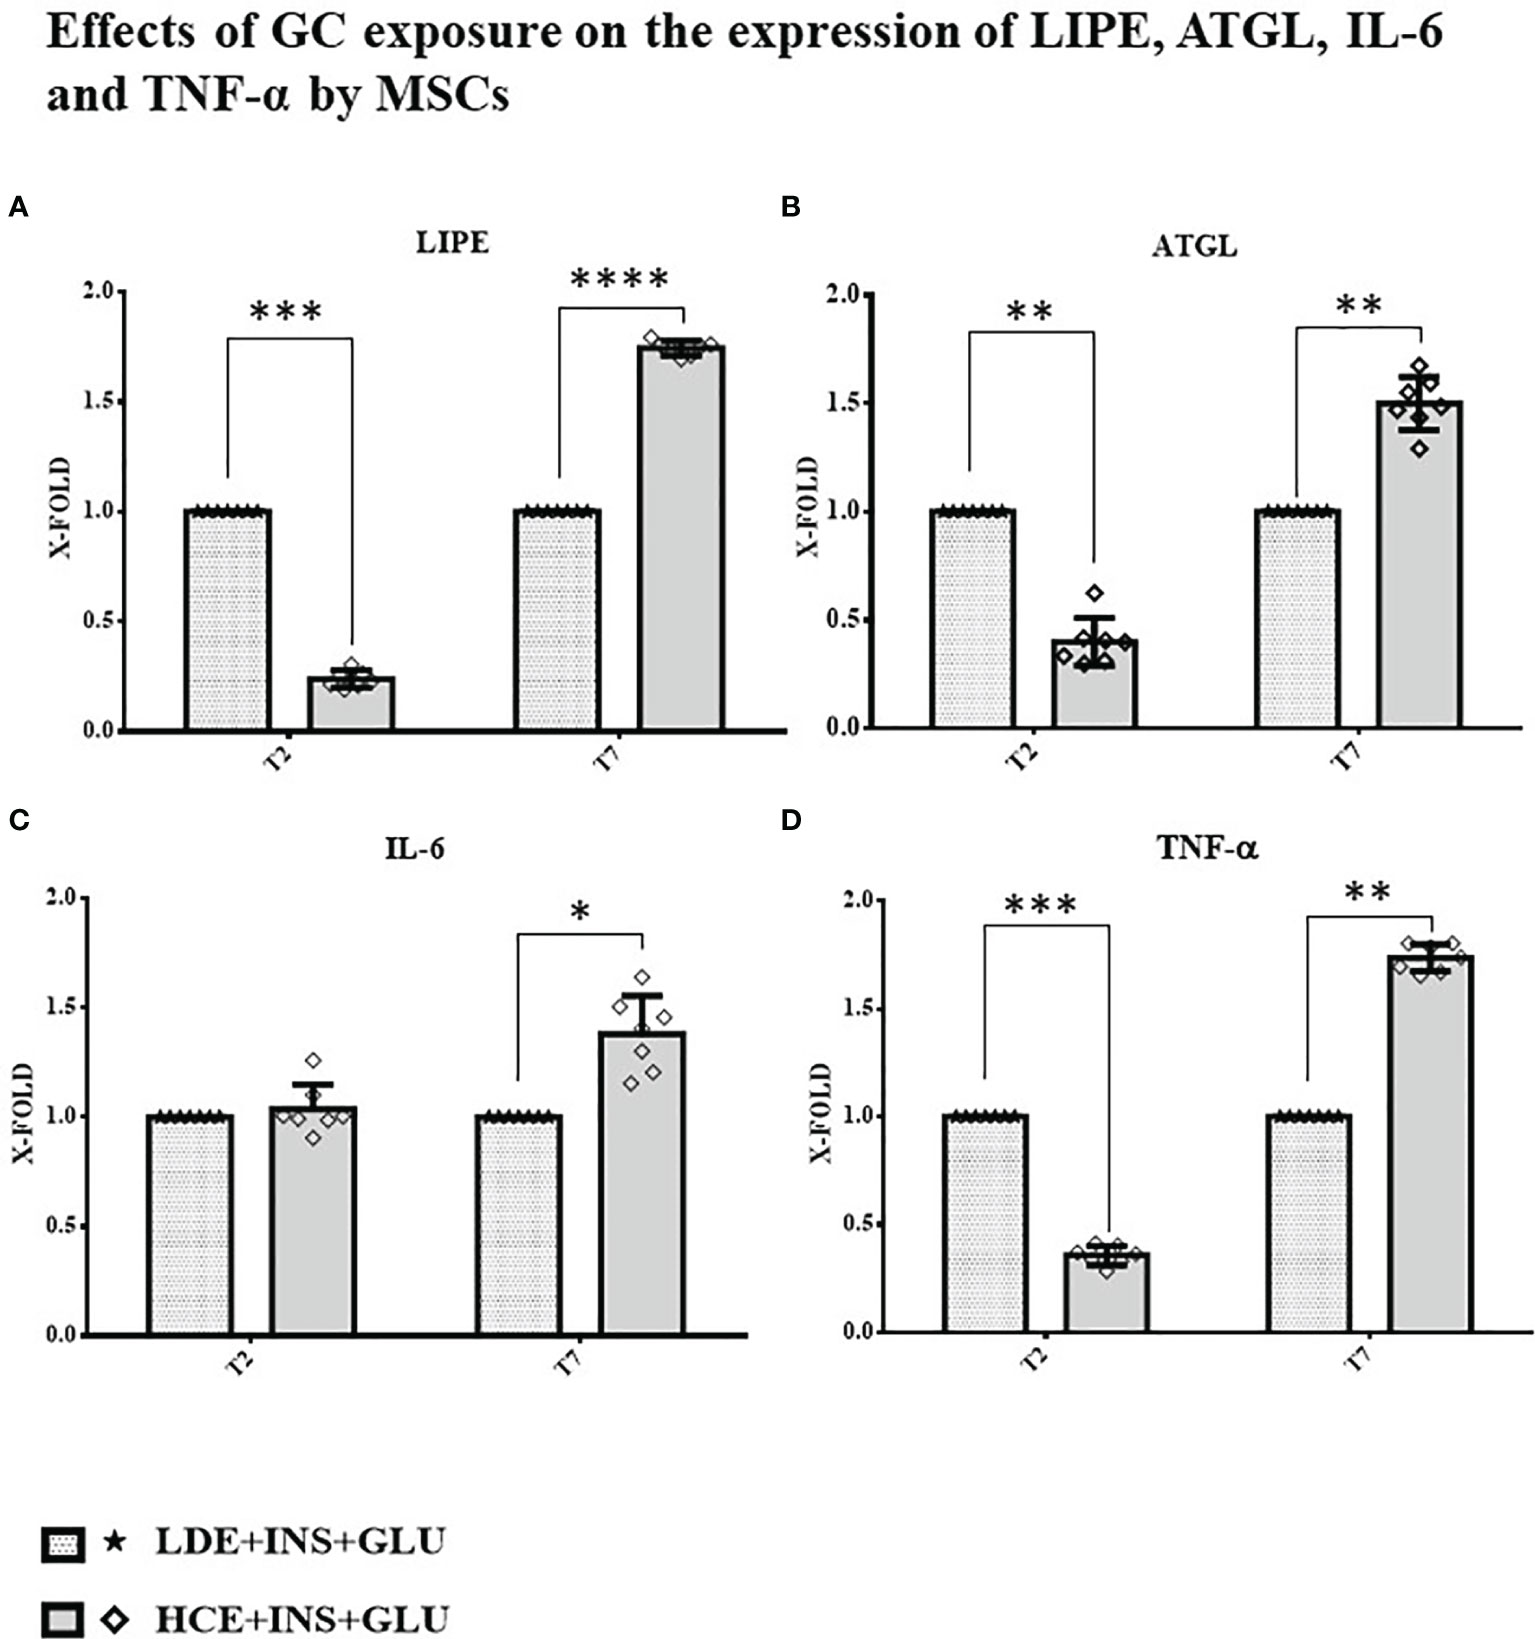
A downregulation of both genes involved in the breakdown of triglycerides to fatty acids (LIPE and ATGL) was found at T2, whereas at T7, their expression was significantly increased in HCE cells compared to LDE cells. At T7, HCE cells showed a significant increase in the expression of both IL-6 and TNF-α genes, whereas at T2, only the expression of TNF-α was lower than that of LDE cells (Figure 7).

FIGURE 7

www.frontiersin.orgFigure 7 Gene expression in MSCs undergoing a LDE or a HCE to GCs. The bars display the expression of genes referred specifically to the development of IR: (A)LIPE(B)ATGL(C): IL-6 and (D): TNF-α at T2 and T7 sampling times. LDE+GLU+INS: LDE (Lower and Decreasing Exposure) cells stimulated with insulin before glucose exposure; HCE+GLU +INS: HCE (higher and Constant Exposure) cells stimulated with insulin before glucose exposure. Data are expressed as mean ± SD (over three independent experiments) of the X-fold (2−ΔΔCt method) of HCE+INS+GLU compared to LDE+INS+GLU arbitrarily expressed as 1, where ΔCt=Ct (gene of interest)—Ct (control gene) and Δ (ΔCt)=ΔCt (HCE+INS+GLU)—ΔCt (LDE+INS+GLU). Unpaired t-Student’s test; *p < 0.05,**p < 0.01,***p < 0.001;****p < 0.0001.

Discussion

The clinical presentation of CS is well established, but the mechanisms underlying the onset of some of its complications, IR above all, have not yet been fully understood and may involve tissue-specific players. As progenitors of specialized cellular lines that are directly implicated in the progression of chronic GC excess-induced damage (such as adipocytes, skeletal muscle cells and osteocytes), MSCs are of particular interest: in a previous study, we showed that MSCs derived from the skin of patients with CS displayed dysregulated inflammatory markers and altered expression of genes related to wound healing, demonstrating not only how they could be a useful cellular model to study this event but also their potential contribution to the development of CS manifestations (16).

With this premise, we hypothesized that MSCs exposed to excess GC encounter altered glucose uptake mechanisms, which are then inherited and consolidated by their derived, specialized cells.

Our work aimed to explore and compare the effects of two different GC regimens (LDE- Lower and Decreasing Exposure- and HCE- Higher and Constant Exposure) on glucose and lipid metabolism in MSCs.

First, MSCs were isolated from abdominal skin and characterized by confirming their undifferentiated state (15). To faithfully reproduce the circadian variations in GC concentrations and food intake, cells were treated by following an articulated protocol (Figure 1).

It is well established that insulin stimulation promotes glucose uptake via GLUT4 translocation (3032) in adipocytes and skeletal muscle cells, but the same mechanism has not yet been demonstrated for MSCs. Therefore, the responsiveness of MSCs to insulin, as well as the involvement of GLUT4 in glucose uptake, were addressed before evaluating the effects of GCs. We demonstrated that the exposure of MCSs to insulin increased their glucose uptake and insulin-induced GLUT4 translocation with mechanisms that are similar to those described for adipocytes and muscle cells by confocal imaging. In contrast to what was previously reported for adipocytes (3334), GLUT4 expression before insulin stimulation occurred in the cytoplasmic, perinuclear and nuclear compartments in a nonvacuolized pattern. The same localization was observed by Tonack et al. in mouse embryonic stem cells (35). As in adipocytes, the protein translocated on the cell surface, favoring glucose uptake after insulin stimulation.

These results opened the second part of the research aimed at evaluating the IR-inducing effects of GCs on MSCs.

MSCs were exposed to two different GC regimens: in LDE cells, insulin stimulation always caused an increase in glucose uptake, confirming that insulin sensitivity of MSCs is not altered when cortisol circadian rhythm is preserved; conversely, in HCE cells, an impaired response to insulin was observed, as demonstrated by their decreased glucose uptake. These observations were also confirmed by confocal data, showing how excess GC blocked the insulin-induced translocation of GLUT4 from the intracellular compartment to the cell surface. Of note, a reduction in glucose uptake was not detected in earlier sampling times (T1, T2) but later (T3, T5, T6, T7). These results, taken together with the lack of GLUT4 translocation, suggest that IR develops over time. The development of IR following chronic exposure to GCs has been widely demonstrated in differentiated cells such as adipocytes, hepatocytes, muscle and endothelial cells (3638), but to our knowledge, this has never been observed in human stem cells before.

Our results are in line with those by Gathercole et al. (12), who reported increased insulin-stimulated glucose uptake in a human immortalized subcutaneous adipocyte line (Chub-S7) after acute exposure to dexamethasone, as well as to hydrocortisone (up to 48 hours, in a dose- and time-dependent manner for the latter), thus proposing that the development of GC-induced obesity was promoted by enhanced adipocyte differentiation. However, it must be noted that although Chub-S7 are not fully differentiated adipocytes, they cannot be considered MSCs.

In our study, MSCs showed transient signs of IR at T3. In our opinion, this finding represents a physiologic phenomenon and is in line with previous findings in healthy volunteers who were administered hydrocortisone at two different time points and whose endogenous cortisol production was suppressed by metyrapone and nutrient intake was controlled by means of a continuous glucose infusion (39): subjects receiving hydrocortisone in the evening showed a more pronounced delayed hyperglycaemic effect than those taking hydrocortisone in the morning (39). Persistent signs of IR in our MSCs appeared even earlier (from T5, after 30 hours of HCE to GCs) than Gathercole’s Chub-S7 (12): the ability of MSCs to develop early documentable and conceptually plausible alterations, which can be tracked even once differentiated, further confirms that they are a reliable model for physiopathology studies.

The relationship between insulin and lipolysis is bidirectional: inhibition of lipolysis is mainly due to insulin (24), but different mechanisms have been identified where increased lipolysis is involved in the impairment of insulin sensitivity (2540). Boden et al. (41) reported that increasing circulating nonesterified fatty acid (NEFA) levels by lipid infusion induced transient IR. To obtain a clearer picture of the possible mechanisms involved in the development of IR in MSCs, we analyzed the expression of LIPE and ATGL genes at different timepoints. We found that HCE cells showed an initial reduction (T2), followed by a significant increase (T7), in the expression of LIPE and ATGL genes compared to LDE cells. The results from previous works on this topic are partially conflicting: Slavin (42) and Villena (43) found upregulated expression of the LIPE and ATGL genes, respectively, after a short treatment with GCs, but studies examining the effects of prolonged GC administration suggested that the acute induction of systemic lipolysis by GCs was not sustained over time (44). However, in these in vitro studies, cells were never treated with insulin, whose counterregulatory effect on lipolysis could not be highlighted. Notably, diabetic patients with CS show an increased activation of lipolysis due to IR (44). Our results fully reflect this scenario, showing that the lipolytic effects are even more marked once insulin levels fail to compensate for associated IR. LIPE and ATGL gene expression was downregulated at T2, when IR had not yet been reached; at T7, when chronic exposure to high GC levels compromised insulin sensitivity, both lipolysis-related enzymes were overexpressed. Of note, increased expression of LIPE and ATGL genes in the presence of IR was also reported by Sumuano et al. in mature adipocytes (37). Given its ability to decrease the tyrosine kinase activity of the insulin receptor, TNF-α is an important mediator of IR in obesity and type 2 diabetes mellitus (26). IL-6 is notably associated with IR by both sustaining low-grade chronic inflammation (45) and impairing the phosphorylation of insulin receptor and IRS-1 (27). In agreement with these statements, TNF-α and IL-6 expression was lower before IR induction (T2) and higher after prolonged exposure (T7) in HCE cells than in LDE cells, further confirming the importance of preserved circadian GC rhythmicity to prevent the occurrence of metabolic alterations.

Conclusions

MSCs derived from skin could be a good human model for studying the toxic effects of GCs. Like mature adipocytes, they are responsive to insulin stimulation that promotes glucose uptake via GLUT4 translocation, and their chronic exposure to excessive levels of GCs induces the development of IR. For differentiated cells, impaired lipolysis is observed in MSCs once IR has arisen. Furthermore, MSCs could be a promising model to track the mechanisms involved in GC-induced IR throughout cellular differentiation. Functional analyses will be necessary to elucidate the mechanisms behind these first descriptive results and overcame the actual weakness of this research. In addition, co-cultures with MSCs and mature adipocytes will be performed to investigate the crosstalk between these two cell types.

Data Availability Statement

The original contributions presented in the study are included in the article/supplementary material, further inquiries can be directed to the corresponding author.

Ethics Statement

The studies involving human participants were reviewed and approved by Università Politecnica delle Marche Ethical Committee. The patients/participants provided their written informed consent to participate in this study.

Author Contributions

Conceptualization, MO and GA. Methodology, MDV and MM. Formal analysis, MDV, VL, and CL. Data curation, GDB and GG. Writing—original draft preparation, MO and MDV. Writing—review and editing, MO, GA, and MM. Supervision, MO and GA. All authors have read and agreed to the published version of the manuscript.

Funding

This work was supported by 2017HRTZYA_005 project grant.

Conflict of Interest

The authors declare that the research was conducted in the absence of any commercial or financial relationships that could be construed as a potential conflict of interest.

Publisher’s Note

All claims expressed in this article are solely those of the authors and do not necessarily represent those of their affiliated organizations, or those of the publisher, the editors and the reviewers. Any product that may be evaluated in this article, or claim that may be made by its manufacturer, is not guaranteed or endorsed by the publisher.

References

1. Russell G, Lightman S. The Human Stress Response. Nat Rev Endocrinol (2019) 15(9):525–34. doi: 10.1038/s41574-019-0228-0

PubMed Abstract | CrossRef Full Text | Google Scholar

2. Chung S, Son GH, Kim K. Circadian Rhythm of Adrenal Glucocorticoid: Its Regulation and Clinical Implications. Biochim Biophys Acta (2011) 1812(5):581–91. doi: 10.1016/j.bbadis.2011.02.003

PubMed Abstract | CrossRef Full Text | Google Scholar

3. Arnaldi G, Mancini T, Tirabassi G, Trementino L, Boscaro M. Advances in the Epidemiology, Pathogenesis, and Management of Cushing’s Syndrome Complications. J Endocrinol Invest (2012) 35(4):434–48. doi: 10.1007/BF03345431

PubMed Abstract | CrossRef Full Text | Google Scholar

4. Nieman LK, Biller BM, Findling JW, Newell-Price J, Savage MO, Stewart PM, et al. the Diagnosis of Cushing’s Syndrome: An Endocrine Society Clinical Practice Guideline. J Clin Endocrinol Metab (2008) 93(5):1526–40. doi: 10.1210/jc.2008-012

PubMed Abstract | CrossRef Full Text | Google Scholar

5. Arnaldi G, Scandali VM, Trementino L, Cardinaletti M, Appolloni G, Boscaro M. Pathophysiology of Dyslipidemia in Cushing’s Syndrome. Neuroendocrinology (2010) 92(Suppl 1):86–90. doi: 10.1159/000314213

PubMed Abstract | CrossRef Full Text | Google Scholar

6. Arnaldi G, Angeli A, Atkinson AB, Bertagna X, Cavagnini F, Chrousos GP, et al. Diagnosis and Complications of Cushing’s Syndrome: A Consensus Statement. J Clin Endocrinol Metab (2003) 88(12):5593–602. doi: 10.1210/jc.2003-030871

PubMed Abstract | CrossRef Full Text | Google Scholar

7. Carroll T, Raff H, Findling JW. Late-Night Salivary Cortisol Measurement in the Diagnosis of Cushing’s Syndrome. Nat Clin Pract Endocrinol Metab (2008) 4(6):344–50. doi: 10.1038/ncpendmet0837

PubMed Abstract | CrossRef Full Text | Google Scholar

8. Geer EB, Islam J, Buettner C. Mechanisms of Glucocorticoid-Induced Insulin Resistance: Focus on Adipose Tissue Function and Lipid Metabolism. Endocrinol Metab Clin North Am (2014) 43(1):75–102. doi: 10.1016/j.ecl.2013.10.005

PubMed Abstract | CrossRef Full Text | Google Scholar

9. Watson RT, Kanzaki M, Pessin JE. Regulated Membrane Trafficking of the Insulin-Responsive Glucose Transporter 4 in Adipocytes. Endocr Rev (2004) 25(2):177–204. doi: 10.1210/er.2003-0011

PubMed Abstract | CrossRef Full Text | Google Scholar

10. Sakoda H, Ogihara T, Anai M, Funaki M, Inukai K, Katagiri H, et al. Dexamethasone-Induced Insulin Resistance in 3T3-L1 Adipocytes is Due to Inhibition of Glucose Transport Rather Than Insulin Signal Transduction. Diabetes (2000) 49(10):1700–8. doi: 10.2337/diabetes.49.10.1700

PubMed Abstract | CrossRef Full Text | Google Scholar

11. Le Marchand-Brustel Y, Gual P, Grémeaux T, Gonzalez T, Barrès R, Tanti JF. Fatty Acid-Induced Insulin Resistance: Role of Insulin Receptor Substrate 1 Serine Phosphorylation in the Retroregulation of Insulin Signalling. Biochem Soc Trans (2003) 31(Pt 6):1152–6. doi: 10.1042/bst0311152

PubMed Abstract | CrossRef Full Text | Google Scholar

12. Gathercole LL, Bujalska IJ, Stewart PM, Tomlinson JW. Glucocorticoid Modulation of Insulin Signaling in Human Subcutaneous Adipose Tissue. J Clin Endocrinol Metab (2007) 92(11):4332–9. doi: 10.1210/jc.2007-1399

PubMed Abstract | CrossRef Full Text | Google Scholar

13. Campanati A, Orciani M, Sorgentoni G, Consales V, Offidani A, Di Primio R. Pathogenetic Characteristics of Mesenchymal Stem Cells in Hidradenitis Suppurativa. JAMA Dermatol (2018) 154(10):1184–90. doi: 10.1001/jamadermatol.2018.2516

PubMed Abstract | CrossRef Full Text | Google Scholar

14. Orciani M, Caffarini M, Lazzarini R, Delli Carpini G, Tsiroglou D, Di Primio R, et al. Mesenchymal Stem Cells From Cervix and Age: New Insights Into CIN Regression Rate. Oxid Med Cell Longev (2018) 2018:154578. doi: 10.1155/2018/1545784

CrossRef Full Text | Google Scholar

15. Dominici M, Le Blanc K, Mueller I, Slaper-Cortenbach I, Marini F, Krause D, et al. Minimal Criteria for Defining Multipotent Mesenchymal Stromal Cells. The International Society for Cellular Therapy Position Statement. Cytotherapy (2006) 8(4):315–7. doi: 10.1080/14653240600855905

PubMed Abstract | CrossRef Full Text | Google Scholar

16. Caffarini M, Armeni T, Pellegrino P, Cianfruglia L, Martino M, Offidani A, et al. Cushing Syndrome: The Role of Mscs in Wound Healing, Immunosuppression, Comorbidities, and Antioxidant Imbalance. Front Cell Dev Biol (2019) 9:227. doi: 10.3389/fcell.2019.00227

CrossRef Full Text | Google Scholar

17. Campanati A, Orciani M, Lazzarini R, Ganzetti G, Consales V, Sorgentoni G, et al. TNF-α Inhibitors Reduce the Pathological Th1 -Th17/Th2 Imbalance in Cutaneous Mesenchymal Stem Cells of Psoriasis Patients. Exp Dermatol (2017) 26(4):319–24. doi: 10.1111/exd.13139

PubMed Abstract | CrossRef Full Text | Google Scholar

18. Campanati A, Orciani M, Sorgentoni G, Consales V, Mattioli Belmonte M, Di Primio R, et al. Indirect Co-Cultures of Healthy Mesenchymal Stem Cells Restore the Physiological Phenotypical Profile of Psoriatic Mesenchymal Stem Cells. Clin Exp Immunol (2018) 193(2):234–40. doi: 10.1111/cei.13141

PubMed Abstract | CrossRef Full Text | Google Scholar

19. Orciani M, Caffarini M, Biagini A, Lucarini G, Delli Carpini G, Berretta A, et al. Chronic Inflammation May Enhance Leiomyoma Development by the Involvement of Progenitor. Cells Stem Cells Int (2018) 13(2018):1716246. doi: 10.1155/2018/1716246

CrossRef Full Text | Google Scholar

20. Lazzarini R, Olivieri F, Ferretti C, Mattioli-Belmonte M, Di Primio R, Orciani M. Mrnas and Mirnas Profiling of Mesenchymal Stem Cells Derived From Amniotic Fluid and Skin: The Double Face of the Coin. Cell Tissue Res (2014) 355(1):121–30. doi: 10.1007/s00441-013-1725-4

PubMed Abstract | CrossRef Full Text | Google Scholar

21. Bonifazi M, Di Vincenzo M, Caffarini M, Mei F, Salati M, Zuccatosta L, et al. How the Pathological Microenvironment Affects the Behavior of Mesenchymal Stem Cells in the Idiopathic Pulmonary Fibrosis. Int J Mol Sci (2020) 21(21):8140. doi: 10.3390/ijms21218140

CrossRef Full Text | Google Scholar

22. Debono M, Ghobadi C, Rostami-Hodjegan A, Huatan H, Campbell MJ, Newell-Price J, et al. Modified-Release Hydrocortisone to Provide Circadian Cortisol Profiles. J Clin Endocrinol Metab (2009) 94(5):1548–54. doi: 10.1210/jc.2008-2380

PubMed Abstract | CrossRef Full Text | Google Scholar

23. Magi S, Nasti AA, Gratteri S, Castaldo P, Bompadre S, Amoroso S, et al. Gram-Negative Endotoxin Lipopolysaccharide Induces Cardiac Hypertrophy: Detrimental Role of Na(+)-Ca(2+) Exchanger. Eur J Pharmacol (2015) 746:31–40. doi: 10.1016/j.ejphar.2014.10.054

PubMed Abstract | CrossRef Full Text | Google Scholar

24. Yaradanakul A, Feng S, Shen C, Lariccia V, Lin MJ, Yang J, et al. Dual Control of Cardiac Na+ Ca2+ Exchange by PIP(2): Electrophysiological Analysis of Direct and Indirect Mechanisms. J Physiol (2007) 582(Pt 3):991–1010. doi: 10.1113/jphysiol.2007.132712

PubMed Abstract | CrossRef Full Text | Google Scholar

25. Weinstein SP, Paquin T, Pritsker A, Haber RS. Glucocorticoid-Induced Insulin Resistance: Dexamethasone Inhibits the Activation of Glucose Transport in Rat Skeletal Muscle by Both Insulin- and non-Insulin-Related Stimuli. Diabetes (1995) 44(4):441–5. doi: 10.2337/diab.44.4.441

PubMed Abstract | CrossRef Full Text | Google Scholar

26. Morigny P, Houssier M, Mouisel E, Langin D. Adipocyte Lipolysis and Insulin Resistance. Biochimie (2016) 125:259–66. doi: 10.1016/j.biochi.2015.10.024

PubMed Abstract | CrossRef Full Text | Google Scholar

27. Macfarlane DP, Forbes S, Walker BR. Glucocorticoids and Fatty Acid Metabolism in Humans: Fuelling Fat Redistribution in the Metabolic Syndrome. J Endocrinol (2008) 197(2):189–204. doi: 10.1677/JOE-08-0054

PubMed Abstract | CrossRef Full Text | Google Scholar

28. Kim JH, Bachmann RA, Chen J. Interleukin-6 and Insulin Resistance. Vitam Horm (2009) 80:613–33. doi: 10.1016/S0083-6729(08)00621-3

PubMed Abstract | CrossRef Full Text | Google Scholar

29. Ghasemi A, Zahediasl S. Normality Tests for Statistical Analysis: A Guide for non-Statisticians. Int J Endocrinol Metab (2012) 10(2):486–9. doi: 10.5812/ijem.3505

PubMed Abstract | CrossRef Full Text | Google Scholar

30. Deshmukh AS. Insulin-Stimulated Glucose Uptake in Healthy and Insulin-Resistant Skeletal Muscle. Horm Mol Biol Clin Investig (2016) 26(1):13–24. doi: 10.1515/hmbci-2015-0041

PubMed Abstract | CrossRef Full Text | Google Scholar

31. Honka MJ, Latva-Rasku A, Bucci M, Virtanen KA, Hannukainen JC, Kalliokoski KK, et al. Insulin-Stimulated Glucose Uptake in Skeletal Muscle, Adipose Tissue and Liver: A Positron Emission Tomography Study. Eur J Endocrinol (2018) 178(5):523–31. doi: 10.1530/EJE-17-0882

PubMed Abstract | CrossRef Full Text | Google Scholar

32. Satoh T. Molecular Mechanisms for the Regulation of Insulin-Stimulated Glucose Uptake by Small Guanosine Triphosphatases in Skeletal Muscle and Adipocytes. Int J Mol Sci (2014) 15(10):18677–92. doi: 10.3390/ijms151018677

PubMed Abstract | CrossRef Full Text | Google Scholar

33. Kandror KV, Pilch PF. The Sugar Is Sirved: Sorting Glut4 and its Fellow Travelers. Traffic (2011) 12(6):665–71. doi: 10.1111/j.1600-0854.2011.01175.x

PubMed Abstract | CrossRef Full Text | Google Scholar

34. Bogan JS. Regulation of Glucose Transporter Translocation in Health and Diabetes. Annu Rev Biochem (2012) 81:507–32. doi: 10.1146/annurev-biochem-060109-094246

PubMed Abstract | CrossRef Full Text | Google Scholar

35. Tonack S, Fischer B, Navarrete Santos A. Expression of the Insulin-Responsive Glucose Transporter Isoform 4 in Blastocysts of C57/BL6 Mice. Anat Embryol (Berl) (2004) 208(3):225–30. doi: 10.1007/s00429-004-0388-z

PubMed Abstract | CrossRef Full Text | Google Scholar

36. Beaupere C, Liboz A, Fève B, Blondeau B, Guillemain G. Molecular Mechanisms of Glucocorticoid-Induced Insulin Resistance. Int J Mol Sci (2021) 22(2):623. doi: 10.3390/ijms22020623

CrossRef Full Text | Google Scholar

37. Ayala-Sumuano JT, Velez-delValle C, Beltrán-Langarica A, Marsch-Moreno M, Hernandez-Mosqueira C, Kuri-Harcuch W. Glucocorticoid Paradoxically Recruits Adipose Progenitors and Impairs Lipid Homeostasis and Glucose Transport in Mature Adipocytes. Sci Rep (2013) 3:2573. doi: 10.1038/srep02573

PubMed Abstract | CrossRef Full Text | Google Scholar

38. Samuel VT, Shulman GI. Mechanisms for Insulin Resistance: Common Threads and Missing Links. Cell (2012) 148(5):852–71. doi: 10.1016/j.cell.2012.02.017

PubMed Abstract | CrossRef Full Text | Google Scholar

39. Plat L, Leproult R, L’Hermite-Baleriaux M, Fery F, Mockel J, Polonsky KS, et al. Metabolic Effects of Short-Term Elevations of Plasma Cortisol are More Pronounced in the Evening Than in the Morning. J Clin Endocrinol Metab (1999) 84(9):3082–92. doi: 10.1210/jcem.84.9.5978

PubMed Abstract | CrossRef Full Text | Google Scholar

40. Ertunc ME, Sikkeland J, Fenaroli F, Griffiths G, Daniels MP, Cao H, et al. Secretion of Fatty Acid Binding Protein Ap2 From Adipocytes Through a Nonclassical Pathway in Response to Adipocyte Lipase Activity. J Lipid Res (2015) 56(2):423–34. doi: 10.1194/jlr.M055798

PubMed Abstract | CrossRef Full Text | Google Scholar

41. Boden G, Chen X, Rosner J, Barton M. Effects of a 48-H Fat Infusion on Insulin Secretion and Glucose Utilization. Diabetes (1995) 44(10):1239–42. doi: 10.2337/diab.44.10.1239

PubMed Abstract | CrossRef Full Text | Google Scholar

42. Slavin BG, Ong JM, Kern PA. Hormonal Regulation of Hormonesensitive Lipase Activity and Mrna Levels in Isolated Rat Adipocytes. J Lip Res (1994) 35(9):1535–41. doi: 10.1016/S0022-2275(20)41151-4

CrossRef Full Text | Google Scholar

43. Villena JA, Roy S, Sarkadi-Nagy E, Kim KH, Sul HS. Desnutrin, an Adipocyte Gene Encoding a Novel Patatin Domain-Containing Protein, is Induced by Fasting and Glucocorticoids: Ectopic Expression of Desnutrin Increases Triglyceride Hydrolysis. J Biol Chem (2004) 279(45):47066–75. doi: 10.1074/jbc.M403855200

PubMed Abstract | CrossRef Full Text | Google Scholar

44. Hotamisligil GS, Peraldi P, Budavari A, Ellis R, White MF. Spiegelman. BM IRS-1-Mediated Inhibition of Insulin Receptor Tyrosine Kinase Activity in TNF-Alpha- and Obesity-Induced Insulin Resistance. Science (1996) 271(5249):665–8. doi: 10.1126/science.271.5249.665

PubMed Abstract | CrossRef Full Text | Google Scholar

45. Rehman K, Akash MSH, Liaqat A, Kamal S, Qadir MI, Rasul A. Role of Interleukin-6 in Development of Insulin Resistance and Type 2 Diabetes Mellitus. Crit Rev Eukaryot Gene Expr (2017) 27(3):229–36. doi: 10.1615/CritRevEukaryotGeneExpr.2017019712

PubMed Abstract | CrossRef Full Text | Google Scholar

Keywords: glucocorticoids, MSCs, lipolysis, glucose uptake, insulin resistance

Citation: Di Vincenzo M, Martino M, Lariccia V, Giancola G, Licini C, Di Benedetto G, Arnaldi G and Orciani M (2022) Mesenchymal Stem Cells Exposed to Persistently High Glucocorticoid Levels Develop Insulin-Resistance and Altered Lipolysis: A Promising In Vitro Model to Study Cushing’s Syndrome. Front. Endocrinol. 13:816229. doi: 10.3389/fendo.2022.816229

Received: 16 November 2021; Accepted: 20 January 2022;
Published: 24 February 2022.

Edited by:

Pierre De Meyts, Université Catholique de Louvain, Belgium

Reviewed by:

Jacqueline Beaudry, University of Toronto, Canada
Małgorzata Małodobra-Mazur, Wroclaw Medical University, Poland

Copyright © 2022 Di Vincenzo, Martino, Lariccia, Giancola, Licini, Di Benedetto, Arnaldi and Orciani. This is an open-access article distributed under the terms of the Creative Commons Attribution License (CC BY). The use, distribution or reproduction in other forums is permitted, provided the original author(s) and the copyright owner(s) are credited and that the original publication in this journal is cited, in accordance with accepted academic practice. No use, distribution or reproduction is permitted which does not comply with these terms.

*Correspondence: Giorgio Arnaldi, g.arnaldi@univpm.it

These authors have contributed equally to this work and share first authorship

These authors have contributed equally to this work and share last authorship

Disclaimer: All claims expressed in this article are solely those of the authors and do not necessarily represent those of their affiliated organizations, or those of the publisher, the editors and the reviewers. Any product that may be evaluated in this article or claim that may be made by its manufacturer is not guaranteed or endorsed by the publisher.

From https://www.frontiersin.org/articles/10.3389/fendo.2022.816229/full

Association of Chronic Central Serous Chorioretinopathy with Subclinical Cushing’s Syndrome

https://doi.org/10.1016/j.ajoc.2022.101455

Abstract

Purpose

To report the clinical course of a patient with central serous chorioretinopathy (CSCR) secondary to subclinical hypercortisolism before and after adrenalectomy.

Observations

A 50-year-old female patient with multifocal, chronic CSCR was found to have an adrenal incidentaloma and was diagnosed with subclinical hypercortisolism. Patient elected to undergo minimally-invasive adrenalectomy and presented at 3 months after surgery without subretinal fluid.

Conclusions and Importance

Subclinical Cushing’s Syndrome (SCS) may present an underrecognized risk factor for developing chronic CSCR. Further investigation is needed to determine the threshold of visual comorbidity that may influence surgical management.

Keywords

Central serous chorioretinopathy
Subclinical Cushing’s syndrome
Hypercortisolism
Adrenalectomy
Retina
Surgical intervention

1. Introduction

Central serous chorioretinopathy (CSCR) is characterized by accumulation of fluid in the subretinal or sub-RPE space, often with consequential visual impairment. Chronic CSCR has been reported as a manifestation of hypercortisolism due to Cushing’s syndrome and subclinical hypercortisolism.1,2 However, the latter is often underrecognized owing to its inherently subtle nature and the optimal threshold for intervention based on associated comorbidities remains unclear. Herein we report the clinical course of a patient with CSCR secondary to subclinical hypercortisolism before and after adrenalectomy.

2. Case report

A 50-year-old female presented with blurred, discolored spots in the right eye for several months. Her past medical history included mild hypertension treated with amlodipine. Past ocular and family history were noncontributory.

On exam, Snellen visual acuity was 20/50 OD, 20/25 OS. Her pupils, intraocular pressure, and anterior segment exam were within normal limits. Dilated fundus exam revealed bilateral, multifocal areas of subretinal fluid and mottled pigmentary changes (Fig. 1A). Optical coherence tomography confirmed areas of subretinal fluid and other areas of outer retinal atrophy (Fig. 1B). Fundus autofluorescence revealed areas of hyperautofluorescence that highlighted the fundoscopic findings (Fig. 1C). Fluorescein angiography showed multifocal areas of expansile dot leakage (Fig. 1D). Altogether these findings were consistent with multifocal, chronic CSCR.

Fig. 1

  1. Download : Download high-res image (1MB)
  2. Download : Download full-size image

Fig. 1. Multimodal imaging of bilateral multifocal central serous chorioretinopathy. Fundus photographs reveal multifocal subretinal fluid and pigmentary changes (Fig. 1A). Optical coherence tomography demonstrates subretinal fluid and outer retinal atrophy (Fig. 1B). Areas of hyperautofluorescence highlight the fundoscopic findings of subretinal fluid (Fig. 1C). Fluorescein angiography showing multiple areas of expansile dot leakage (Fig. 1D).

On further clinical follow-up, an adrenal incidentaloma (AI) was detected when the patient underwent imaging for back pain. Subsequently she saw an endocrinologist; she had a normal serum cortisol, but low ACTH and an abnormal dexamethasone suppression test. This led to a diagnosis of subclinical hypercortisolism and provided a reason for her hypertension and chronic CSCR.

Since the blur and relative scotomata interfered with her daily activities, she elected to try eplerenone, which yielded a moderate but suboptimal therapeutic response at 50 mg daily. While contemplating photodynamic therapy, in discussion with her endocrinologist, the patient opted to undergo minimally-invasive adrenalectomy. At last follow-up 3 months after surgery and 6 years after her initial presentation, she has been off eplerenone and without subretinal fluid (Fig. 2).

Fig. 2

  1. Download : Download high-res image (1MB)
  2. Download : Download full-size image

Fig. 2. Optical coherence tomography imaging at presentation and at last follow-up 3 months after adrenalectomy. There is a significant improvement in subretinal fluid in both eyes, though outer retinal irregularity remains.

3. Discussion

CSCR has previously been associated with many risk factors including exposure to excess steroid. A recent study analyzing a nationally representative dataset of 35,000 patients found that patients with CSCR had a higher odds of Cushing’s syndrome (OR 2.19, 95% CI 1.33 to 3.59, p = 0.002) than exposure to exogenous steroids (OR 1.14, 95% CI 1.09 to 1.19, p < 0.001)1 Our case highlights the importance of thorough medication reconciliation and careful consideration of comorbid conditions in patients with chronic CSCR.

In recent years, subtle endogenous hypercortisolism, termed subclinical Cushing’s syndrome (SCS), has been of particular interest in the endocrinology literature because it can be a challenging diagnosis and the most appropriate management remains controversial.3 In general, SCS is comprised of: 1) the presence of an adrenal incidentaloma or mass, 2) biochemical confirmation of cortisol excess, and 3) no classic phenotypic manifestations of Cushing’s syndrome.4 Since adrenal incidentaloma has an estimated prevalence of 1–8% of the population,5 it is quite possible that SCS is an underrecognized risk factor for CSCR.

SCS may potentiate metabolic syndrome and osteoporosis; studies have found that surgical resection of adrenal incidentalomas improve weight, blood pressure, and glucose control. Consequently, some authors recommend those with SCS-associated comorbidities be considered for resection.6 An important consideration in these patients is how visual comorbidity factors into intervention. In our patient’s case, the recurrent CSCR, hypertension, and increased risk of metabolic syndrome were sufficient reasons to elect to have surgery.

4. Conclusion

In summary, SCS is a condition of subtle cortisol dysregulation that may represent an underrecognized risk factor for chronic CSCR. Further investigation is needed to determine the threshold of visual comorbidity that may influence surgical management.

Patient consent

Consent to publish the case report was not obtained. This report does not contain any personal information that could lead to the identification of the patient.

Acknowledgments and Disclosures

Grant support was from the J. Arch McNamara Retina Research Fund. The following authors have no financial disclosures: RRS, AS, AC All authors attest that they meet the current ICMJE criteria for Authorship. No other contributions to acknowledge.

References

© 2022 The Authors. Published by Elsevier Inc.

Vitamin D Deficiency in Cushing’s Disease: Before and After Its Supplementation

1
Department of Health Promotion, Maternal-Infantile Care, Excellence Internal and Specialist Medicine “G. D’Alessandro” [PROMISE], Section of Endocrine Disease and Nutrition, University of Palermo, 90127 Palermo, Italy
2
Biochemistry Head CQRC Division (Quality Control and Biochemical Risk), Department of Health Promotion, Maternal-Infantile Care, Excellence Internal and Specialist Medicine “G. D’Alessandro” [PROMISE], University of Palermo, 90127 Palermo, Italy
Author to whom correspondence should be addressed.
Academic Editor: Edgard Delvin
Nutrients 202214(5), 973; https://doi.org/10.3390/nu14050973

Abstract

Background: The primary objective of the study was to assess serum 25-hydroxyvitamin D [25(OH)D] values in patients with Cushing’s disease (CD), compared to controls. The secondary objective was to assess the response to a load of 150,000 U of cholecalciferol. Methods: In 50 patients with active CD and 48 controls, we evaluated the anthropometric and biochemical parameters, including insulin sensitivity estimation by the homeostatic model of insulin resistance, Matsuda Index and oral disposition index at baseline and in patients with CD also after 6 weeks of cholecalciferol supplementation. Results: At baseline, patients with CD showed a higher frequency of hypovitaminosis deficiency (p = 0.001) and lower serum 25(OH)D (p < 0.001) than the controls. Six weeks after cholecalciferol treatment, patients with CD had increased serum calcium (p = 0.017), 25(OH)D (p < 0.001), ISI-Matsuda (p = 0.035), oral disposition index (p = 0.045) and decreased serum PTH (p = 0.004) and total cholesterol (p = 0.017) values than at baseline. Multivariate analysis showed that mean urinary free cortisol (mUFC) was independently negatively correlated with serum 25(OH)D in CD. Conclusions: Serum 25(OH)D levels are lower in patients with CD compared to the controls. Vitamin D deficiency is correlated with mUFC and values of mUFC > 240 nmol/24 h are associated with hypovitaminosis D. Cholecalciferol supplementation had a positive impact on insulin sensitivity and lipids.

1. Introduction

Vitamin D is the precursor of a hormone with pleiotropic effects. Its deficiency has been largely investigated and shown to be associated with many complications including diabetes mellitus, adrenal insufficiency, cardiovascular disease, neurological disorders and other endocrinopathies [1,2,3].
Vitamin D, also known as cholecalciferol, is first formed in the skin by the photolysis of 7-dehydrocholesterol and after hydroxylated in the liver to 25-hydroxyvitamin D [25(OH)D]. It is further transformed in the kidney into 1,25-dihydroxyvitamin D3 (1,25(OH)2D3) (calcitriol) that is the active form [4].
Cushing’s disease (CD) is characterized by a cortisol excess due to autonomous pituitary ACTH secretion. Patients with CD show many comorbidities such as cardiovascular disease, metabolic disease, diabetes mellitus, metabolic syndrome, dyslipidemia, obesity, osteoporosis/osteopenia and infections that contribute to increasing the mortality risk for these patients [5,6,7,8,9,10,11]. Indeed, GCs are key regulators of intermediary metabolism promoting hepatic gluconeogenesis and glycogenosis and on lipid metabolism favouring the deposition of fat to the upper trunk and the face [12]. They stimulate water diuresis, glomerular filtration rate and renal plasma flow and these effects result in arterial hypertension and atherosclerosis. GCs reduce bone remodelling, augment urinary calcium excretion and decrease the intestinal calcium absorption. In addition, they act on immune and hematological systems inhibiting the secretion of interleukins and increasing the red blood cell count, respectively [12].
An interesting relationship exists between glucocorticoids (GCs) and vitamin D values [13,14,15,16]. Indeed, exogenous steroid therapy has been reported to be associated with vitamin deficiency [13]. The mechanism by which GCs reduce 25(OH)D levels is not direct, but indirect, regulating vitamin D receptor expression in many tissues and cells [17,18]. Some authors have shown that treatment with dexamethasone in mice was associated with a decrease in 1α-hydroxylase which is involved in the conversion from 25(OH)D3 to the active metabolite 1,25(OH)2D3 and an increase in 24-hydroxylase, able to break down the active form of calcitriol, in inactive, reducing circulating 25(OH)D levels [19]. In a clinical setting, controversial data have been reported on GCs effects on serum 1,25(OH)2D concentrations [20,21,22,23]. A likely reason for these discrepancies might be the marked heterogeneity of the studied groups. Some of these studies were performed in humans [23,24,25,26], and others in animal models [27,28], but only a few studies were conducted in subjects with endogenous hypercortisolism.
Low serum 25(OH)D levels have significant skeletal and extra-skeletal consequences such as myopathy, high risk of fractures and also affect the immune system and metabolism. All of these systems are impaired in patients with hypercortisolism and a vitamin D deficiency may provide a further aggravation of CD comorbidities. Indeed, it may cause a reduced intestinal calcium absorption resulting in secondary hypocalcemia and hyperparathyroidism leading to a bone demineralization. Its deficiency can contribute to obesity and metabolic syndrome due to the lack of antiadipogenic effect of vitamin D and to cardiovascular disease by a deregulation of the renin–angiotensin–aldosterone system, cardiac contractility and increase in cytokine release [29]. In the end, vitamin D deficiency causes impaired insulin sensitivity and immune system [30].
The discrepancies that emerge in the above-mentioned studies suggest a need to investigate the role of 25(OH)D in patients with CD. Therefore, the primary objective of the study was to evaluate serum 25(OH)D levels in patients with CD, compared to a control group matched for age, BMI and gender, and search for a possible correlation with the degree of hypercortisolism. The secondary objective was to evaluate the response to a course of 150,000 U of cholecalciferol on metabolic and hormonal parameters 6 weeks after the administration in patients with CD.

2. Materials and Methods

2.1. Subjects and Study Design

Fifty patients with active CD, 43 of them women (86%) and 7 of them men (20%) (mean age 50.9 ± 17.4 years; mean duration of disease 32.5 ± 22.4 years), followed from January 2016 to December 2020, by the Endocrinology of the University of Palermo, were included in the current study. Clinical practice guidelines and a recent consensus statement were used to diagnose CD [31,32].
We recruited a control group matched for age, BMI and gender in the same temporal period. It was composed of 48 patients, 33 women (82.5%) and 7 men (17.5%) (mean age 48.5 ± 13.4 years) were evaluated by our team for a suspicion not biochemically confirmed of Cushing’s syndrome (CS).
In all patients, we evaluated phenotypic characteristics including moon face, facial rubor, dorsal fat pad or buffalo hump, defined as a fatty tissue deposit between the shoulders, purple striae, defined as wide, reddish-purple streaks, and myopathy defined as muscle weakness at the proximal level.
We also assessed cardiovascular, metabolic and bone comorbidities. The diagnosis of metabolic syndrome was based on National Cholesterol Education Program Adult Treatment Panel (NCEP ATP III) criteria, while the diagnosis of diabetes mellitus and prediabetes were based on the American Diabetes Association (ADA, Arlington, VA, USA) criteria [33,34].
Among patients with diabetes mellitus (18 out of 50), 16 were treated with metformin alone, while 2 were treated with a combination of metformin and GLP-1 agonist receptors. Metformin and GLP-1 agonist receptors were discontinued 24 h and 2 weeks before metabolic evaluations, respectively, to avoid any interference with metabolic parameters. Diabetic patients were on good metabolic control (HbA1c ≤ 7%). Both CD patients and the controls were naïve to cholecalciferol.
In CD and the controls, BMI and waist circumference (WC), fasting serum lipids (total cholesterol (TC), HDL cholesterol, LDL cholesterol and triglycerides (TG), HbA1c, glycaemia, insulinaemia, albumin corrected calcium, phosphorus and parathyroid hormone (PTH) were assessed. To avoid seasonal influences, serum 25(OH)D levels were only assayed between winter and spring seasons (November–April). We evaluated urinary free cortisol (UFC) as the mean of three 24 h urine collections (mUFC), cortisol after a low dose of dexamethasone suppression test and plasma ACTH. We defined patients with mild hypercortisolism when mUFC levels not exceeding twice the upper limit of normal (ULN), moderate hypercortisolism by a level of mUFC more than 2 to 5 times the ULN and severe hypercortisolism by a mUFC level more than 5 times the ULN, as previously reported [35].
As defined by the Endocrine Society guidelines, we considered 25(OH)D deficiency for values < 20 ng/mL (50 nmol/L), insufficiency as levels of 20–30 ng/mL (50–75 nmol/L) and sufficiency for values ≥ 30 ng/mL (≥75 nmol/L) [36]. In addition, severe 25(OH)D deficiency was defined by levels < 10 ng/mL (<25 nmol/L) [37].
As markers of insulin sensitivity, we calculated the homeostatic model of insulin resistance (HOMA2-IR) [38], and in 32 patients with CD and in 40 controls who had no previous diagnosis of diabetes, we also evaluated the Matsuda index of insulin sensitivity (ISI-Matsuda) [39], the oral disposition index (DIo) [40] and the area under the curve for insulin (AUC2h insulinemia) and glucose (AUC2h glycaemia).
At the baseline visit, we assessed patients’ lifestyle habits: physical activity level, balanced diet (consumption of dairy products, meat, coffee, soft drinks), exposure to ultraviolet (UV) radiation, smoking status and alcohol use.
We excluded patients with adrenal-dependent hypercortisolism, pregnancy, taking oral contraceptives, liver or renal disease, cholecalciferol supplementation within 3 months before the study, malabsorption syndrome and exposure to ultraviolet (UV) radiation (solarium and sunscreen usage).
Patients with CD received an oral load dose of cholecalciferol of 150,000 UI [41,42] and biochemical parameters (metabolic and hormonal) were assayed 6 weeks after administration.
The study protocol was approved by the Ethics Committee of the Policlinico Paolo Giaccone hospital. All patients signed a written informed consent.

2.2. Assays

Biochemical parameters were measured by standard methods (Modular P800, Roche, Milan, Italy), as previously reported [9].
Hormonal parameters were measured by electrochemiluminescence immunoassay (ECLIA, Elecsys, Roche, Milan, Italy) following the manufacturer’s instructions, as previously reported [9].
Mean UFC was measured by mass spectrometry, as previously reported [35].
Normal values for hormonal markers were defined as follows: ACTH 2.2–14 pmol/L and UFC 59–378 nmol/24 h.

2.3. Statistical Analysis

We used statistical Packages for Social Science SPSS version 19 (SPSS, Inc., Chicago, IL, USA) for data analysis. The normality of quantitative variables was tested with the Shapiro–Wilk test. We calculated mean ± SD for continuous variables and rates and proportions for categorical variables. The differences between paired continuous variables (CD vs. controls) were analysed using one-way ANOVA. We used univariate Pearson correlation to evaluate the relations with the outcome parameters. For those variables which were significant at univariate correlation, we performed multiple linear regression analysis to identify independent predictors of the dependent variable 25(OH)D. A p-value of 0.05 was considered statistically significant. A receiver operating characteristic (ROC) analysis was performed to investigate the diagnostic ability of significantly associated risk factors to predict 25(OH)D deficiency. The ROC curve is plotted as sensitivity versus 1-specificity. The area under the ROC curve (AUC) was estimated to measure the overall performance of the predictive factors for serum 25(OH)D deficiency.

3. Results

At baseline, patients with CD had a higher frequency of arterial hypertension (p = 0.009), osteoporosis/osteopenia (p = 0.002), hypercholesterolemia (p = 0.002), diabetes mellitus (p = 0.026), myopathy (p < 0.001), facial rubor (p = 0.005), buffalo hump (p = 0.002) and hypovitaminosis deficiency (p = 0.001) than the controls (Table 1).
Table 1. Comorbidities of patients with CD and controls at baseline.
Table
By contrast, the controls had a higher frequency of vitamin D sufficiency (p = 0.004). Patients with CD also had higher WC (p = 0.031), PTH (p = 0.003), glycaemia (p = 0.010), HbA1c (p = 0.004), total cholesterol (p < 0.001), LDL cholesterol (p = 0.002), ACTH (p < 0.001), mUFC (p = 0.001), cortisol after a low dose of dexamethasone suppression test (p = 0.001) and lower 25(OH)D (p < 0.001), ISI-Matsuda (p = 0.007) and DIo (p = 0.003) than the controls (Table 2).
Table 2. Anthropometric and biochemical parameters of patients with CD and controls at baseline.
Table
Six weeks after cholecalciferol treatment, patients with CD showed increased serum calcium (p = 0.017), 25(OH)D (p < 0.001), ISI-Matsuda (p = 0.035), DIo (p = 0.045) and a decrease in PTH (p = 0.004) and total cholesterol (p = 0.017) levels than at baseline (Table 3).
Table 3. Anthropometric and biochemical parameters at baseline and 6 weeks after cholecalciferol supplementation in patients with CD.
Table
Considering the degree of hypercortisolism, in patients with severe hypercortisolism we observed 25(OH)D deficiency in 73.1% of cases (53.8% of them had a severe deficiency), insufficiency in 12.5% of cases and sufficiency in 6.3% of cases. In patients with moderate hypercortisolism, we observed 25(OH)D deficiency in 64.7% of cases (29% of them had a severe deficiency), insufficiency in 23.5% of cases and sufficiency in 11.8% of cases. In patients with mild hypercortisolism, we observed deficiency in 52.9% of cases (20% of them had a severe deficiency), insufficiency in 41.1% of cases and sufficiency in 6% of cases.
At univariate correlation, in patients with CD at baseline, serum 25(OH)D was inversely correlated with glycaemia (r = −0.385, p = 0.019), HbA1c (r = −0.391, p = 0.017), WC (r = −0.373, p = 0.023), mUFC (r = −0.466, p = 0.033) and cortisol after a low dose of dexamethasone suppression test (r = −0.299, p = 0.049) (Table 4). In the controls, at baseline, 25(OH)D was inversely correlated with WC (r = −0.130, p = 0.042) (Table 4).
Table 4. Correlation of serum 25-hydroxyvitamin D [25(OH)D] levels at baseline in patients with Cushing’s disease and controls.
Table
Multivariate analysis showed that mUFC was independently inversely associated with 25(OH)D (p = 0.010) in patients with CD (Figure 1). In the controls, no significant associations were found.
Nutrients 14 00973 g001 550
Figure 1. Independent variables associated with serum 25(OH)D in patients with active CD at multivariate analysis. mUFC: mean urinary free cortisol.
The ROC analysis showed that a cut-off of mUFC > 240 nmol/24 h was associated with 25(OH)D deficiency with a specificity of 100% and a sensitivity of 56.9%, AUC 0.803 (Figure 2).
Nutrients 14 00973 g002 550
Figure 2. 25(OH)D status and mUFC. ROC curve showed that a cut-off of mUFC > 240 nmol/24 h could be associated with 25(OH)D deficiency. Statistical analysis was performed using the chi-square test and receiver operator characteristic (ROC) curve analysis.

4. Discussion

The present study shows that patients with active CD have lower serum 25(OH)D values than the controls and that serum 25(OH)D levels are inversely correlated with mUFC in CD. In addition, a cholecalciferol load is associated after 6 weeks from the administration with an improvement of serum 25(OH)D and glycometabolic and lipid parameters in patients with CD. Furthermore, we found that higher values of mUFC than 240 nmol/24 h are predictive of 25(OH)D deficiency. The degree of hypercortisolism evaluated by UFC levels is a useful parameter to quantify the “amount” of cortisol secretion, even though it is not sufficiently exhaustive to assess the aggressiveness of the disease [35]. Indeed, a combination of several factors, including the degree of hypercortisolism, but also the duration of the disease, age and other individual predisposing factors, contribute to the aggressiveness of the disease.
Long-standing studies were conducted on vitamin D levels in patients with CD. Patients with CD, with and without osteopenia, were compared before and after oral calcium load showing that serum 1,25 (OH)2D3 plasma levels were higher in subjects with osteopenia than in those without it, likely due to a secondary increase in PTH levels as an effect of hypercortisolism [19]. Another study investigated the effect of hypercortisolism and eucortisolism, showing a reduction in serum 25(OH)D levels, but not in 1,25 (OH)2D3 in patients with hypercortisolism. By contrast, two other studies found normal serum 25(OH)D values in patients with CD [23,24]. However, all the above-mentioned studies were conducted on a small sample of patients. Recently, a meta-analysis conducted on the studies that evaluated serum 25(OH)D levels in patients treated with GCs reported lower serum 25(OH)D levels in these patients compared to healthy subjects [16]. A hypothetical reason was that patients with CD had low 24-hydroxylase levels than the controls, causing an alteration of vitamin D catabolism.
An interesting in vitro study in NCI-H295R cells found that treatment with 1,25(OH)2D3 decreased corticosterone secretion without affecting cortisol levels [43].
As expected, in the current study, we showed that treatment with cholecalciferol is associated with an improvement in insulin sensitivity and total cholesterol values in patients with CD. Indeed, cholecalciferol supplementation has been reported to be associated with improved peripheral insulin sensitivity and secretion in patients at high risk of diabetes or with type 2 diabetes [44]. A recent meta-analysis on 41 randomized controlled studies showed a significant improvement in total cholesterol levels after cholecalciferol supplementation. In addition, this improvement was more pronounced in patients with vitamin D deficiency [45,46].
A recent study compared the metabolism of vitamin D in patients with CD and controls after cholecalciferol treatment, showing that patients with CD had a higher 25(OH)D/24,25(OH)2D ratio than healthy controls, likely due to a decrease in 24-hydroxylase activity. The authors concluded that this alteration of vitamin D catabolism might have an influence on the effectiveness of cholecalciferol therapy in CD [47].
There are some limitations in the current study. First, the study is not randomized. Second, the dose of cholecalciferol administered is the same independently of the baseline serum 25(OH)D values. Third, we did not register the intake of milk and dairy products of the patients included in the study.
In conclusion, serum 25(OH)D levels are lower in subjects with active CD compared to controls matched for age, BMI and gender. Vitamin D deficiency is correlated with mUFC and values of mUFC > 240 nmol/24 h are predictive of 25(OH)D deficiency. In addition, cholecalciferol supplementation has a positive impact on insulin sensitivity and lipids and therefore should be considered part of the treatment of patients with CD at diagnosis, in order to improve the comorbidities. However, further studies are needed to evaluate a possible effect of cholecalciferol supplementation on the aggressiveness of CD.

Author Contributions

Conceptualization, V.G. and F.D.G.; methodology, V.G.; software, V.G.; validation, V.G., F.D.G. and C.G.; formal analysis, V.G.; investigation, V.G.; resources, F.D.G.; data curation, V.G.; writing—original draft preparation, V.G.; writing—review and editing, V.G.; visualization, V.G.; supervision, C.G.; project administration, C.G.; funding acquisition, C.G. All authors have read and agreed to the published version of the manuscript.

Funding

This research received no external funding.

Institutional Review Board Statement

The study was conducted in accordance with the Declaration of Helsinki, and was approved by the Institutional Review Board (or Ethics Committee) of Policlinico Paolo Giaccone (number 1, approved on the 17 January 2022).

Informed Consent Statement

Informed consent was obtained from all subjects involved in the study. Written informed consent has been obtained from the patient(s) to publish this paper.

Data Availability Statement

Data are available on demand at corresponding author.

Conflicts of Interest

The authors declare no conflict of interest.

References

  1. Muscogiuri, G.; Altieri, B.; Annweiler, C.; Balercia, G.; Pal, H.B.; Boucher, B.J.; Cannell, J.J.; Foresta, C.; Grübler, M.R.; Kotsa, K.; et al. Vitamin D and chronic diseases: The current state of the art. Arch. Toxicol. 2017, 91, 97–107. [Google Scholar] [CrossRef] [PubMed]
  2. Marino, R.; Misra, M. Extra-skeletal effects of Vitamin D. Nutrients 2019, 11, 1460. [Google Scholar] [CrossRef] [PubMed]
  3. Zendehdel, A.; Arefi, M. Molecular evidence of role of vitamin D deficiency in various extraskeletal diseases. J. Cell. Biochem. 2019, 120, 8829–8840. [Google Scholar] [CrossRef] [PubMed]
  4. Bikle, D.; Christakos, S. New aspects of vitamin D metabolism and action-addressing the skin as source and target. Nat. Rev. Endocrinol. 2020, 16, 234–252. [Google Scholar] [CrossRef]
  5. Pivonello, R.; Isidori, A.; De Martino, M.C.; Newell-Price, J.; Biller, B.M.K.; Colao, A. Complications of Cushing’s syndrome: State of the art. Lancet Diabetes Endocrinol. 2016, 4, 611–629. [Google Scholar] [CrossRef]
  6. Guarnotta, V.; Ferrigno, R.; Martino, M.; Barbot, M.; Isidori, A.M.; Scaroni, C.; Ferrante, A.; Arnaldi, G.; Pivonello, R.; Giordano, C. Glucocorticoid excess and COVID-19 disease. Rev. Endocr. Metab. Disord. 2020, 22, 703–714. [Google Scholar] [CrossRef]
  7. Giordano, C.; Guarnotta, V.; Pivonello, R.; Amato, M.C.; Simeoli, C.; Ciresi, A.; Cozzolino, A.; Colao, A. Is diabetes in Cushing’s syndrome only a consequence of hypercortisolism? Eur. J. Endocrinol. 2014, 170, 311–319. [Google Scholar] [CrossRef]
  8. Drey, M.; Berr, C.M.; Reincke, M.; Fazel, J.; Seissler, J.; Schopohl, J.; Bidlingmaier, M.; Zopp, S.; Reisch, N.; Beuschlein, F.; et al. Cushing′s syndrome: A model for sarcopenic obesity. Endocrine 2017, 57, 481–485. [Google Scholar] [CrossRef]
  9. Guarnotta, V.; Prinzi, A.; Pitrone, M.; Pizzolanti, G.; Giordano, C. Circulating irisin levels as a marker of osteosarcopenic-obesity in Cushing’s disease. Diabetes Metab. Syndr. Obes. 2020, 13, 1565–1574. [Google Scholar] [CrossRef]
  10. Hakami, O.A.; Ahmed, S.; Karavitaki, N. Epidemiology and mortality of Cushing′s syndrome. Best Pr. Res. Clin. Endocrinol. Metab. 2021, 35, 101521. [Google Scholar] [CrossRef]
  11. Javanmard, P.; Duan, D.; Geer, E.B. Mortality in patients with endogenous Cushing′s Syndrome. Endocrinol. Metab. Clin. North Am. 2018, 47, 313–333. [Google Scholar] [CrossRef] [PubMed]
  12. McKay, L.I.; Cidlowski, J.A. Physiologic and pharmacologic effects of corticosteroids. In Holland-Frei Cancer Medicine, 6th ed.; Kufe, D.W., Pollock., R.E., Weichselbaum, R.R., Eds.; BC Decker: Hamilton, ON, Canada, 2003. [Google Scholar]
  13. Tirabassi, G.; Salvio, G.; Altieri, B.; Ronchi, C.L.; Della Casa, S.; Pontecorvi, A.; Balercia, G. Adrenal disorders: Is there any role for Vitamin D? Rev. Endocr. Metab. Disord. 2016, 18, 355–362. [Google Scholar] [CrossRef] [PubMed]
  14. Skversky, A.L.; Kumar, J.; Abramowitz, M.K.; Kaskel, F.J.; Melamed, M.L. Association of glucocorticoid use and low 25-Hydroxyvitamin D levels: Results from the National Health and Nutrition Examination Survey (NHANES): 2001–2006. J. Clin. Endocrinol. Metab. 2011, 96, 3838–3845. [Google Scholar] [CrossRef] [PubMed]
  15. Muscogiuri, G.; Altieri, B.; Penna-Martinez, M.; Badenhoop, K. Focus on Vitamin D and the Adrenal Gland. Horm. Metab. Res. 2015, 47, 239–246. [Google Scholar] [CrossRef]
  16. Davidson, Z.E.; Walker, K.Z.; Truby, H. Clinical review: Do Glucocorticosteroids alter Vitamin D status? A systematic review with meta-analyses of observational studies. J. Clin. Endocrinol. Metab. 2012, 97, 738–744. [Google Scholar] [CrossRef]
  17. Hidalgo, A.A.; Trump, D.L.; Johnson, C.S. Glucocorticoid regulation of the vitamin D receptor. J. Steroid Biochem. Mol. Biol. 2010, 121, 372–375. [Google Scholar] [CrossRef]
  18. Hidalgo, A.A.; Deeb, K.K.; Pike, J.W.; Johnson, C.S.; Trump, D.L. Dexamethasone enhances 1α,25-Dihydroxyvitamin D3 effects by increasing Vitamin D receptor transcription. J. Biol. Chem. 2011, 286, 36228–36237. [Google Scholar] [CrossRef]
  19. Favus, M.J.; Kimberg, D.V.; Millar, G.N.; Gershon, E. Effects of cortisone administration on the metabolism and localization of 25-Hydroxycholecalciferol in the rat. J. Clin. Investig. 1973, 52, 1328–1335. [Google Scholar] [CrossRef]
  20. Kugai, N.; Koide, Y.; Yamashita, K.; Shimauchi, T.; Nagata, N.; Takatani, O. Impaired mineral metabolism in Cushing’s syndrome: Parathyroid function, vitamin D metabolites and osteopenia. Endocrinol. Jpn. 1986, 33, 345–352. [Google Scholar] [CrossRef]
  21. Aloia, J.F.; Roginsky, M.; Ellis, K.; Shukla, K.; Cohn, S. Skeletal metabolism and body composition in Cushing’s Syndrome. J. Clin. Endocrinol. Metab. 1974, 39, 981–985. [Google Scholar] [CrossRef]
  22. Findling, J.W.; Adams, N.D.; Lemann, J., Jr.; Gray, R.W.; Thomas, C.J.; Tyrrell, J.B. Vitamin D metabolites and parathyroid hormone in Cushing’s Syndrome: Relationship to calcium and phosphorus homeostasis. J. Clin. Endocrinol. Metab. 1982, 54, 1039–1044. [Google Scholar] [CrossRef] [PubMed]
  23. Seeman, E.; Kumar, R.; Hunder, G.G.; Scott, M.; Heath, H., 3rd; Riggs, B.L. Production, degradation, and circulating levels of 1,25-dihydroxyvitamin D in health and in chronic glucocorticoid excess. J. Clin. Investig. 1980, 66, 664–669. [Google Scholar] [CrossRef] [PubMed]
  24. Klein, R.G.; Arnaud, S.B.; Gallagher, J.C.; DeLuca, H.F.; Riggs, B.L. Intestinal calcium absorption in exogenous Hypercortisonism. J. Clin. Investig. 1977, 60, 253–259. [Google Scholar] [CrossRef] [PubMed]
  25. Chaiamnuay, S.; Chailurkit, L.-O.; Narongroeknawin, P.; Asavatanabodee, P.; Laohajaroensombat, S.; Chaiamnuay, P. Current daily glucocorticoid use and serum creatinine levels are associated with lower 25(OH) Vitamin D levels in Thai patients with systemic lupus erythematosus. JCR J. Clin. Rheumatol. 2013, 19, 121–125. [Google Scholar] [CrossRef]
  26. Slovik, D.M.; Neer, R.M.; Ohman, J.L.; Lowell, F.C.; Clark, M.B.; Segre, G.V.; Potts, J.T., Jr. Parathyroid hormone and 25-hydroxyvitamin D levels in glucocorticoid-treated patients. Clin. Endocrinol. 1980, 12, 243–248. [Google Scholar] [CrossRef]
  27. Lindgren, J.U.; Merchant, C.R.; DeLuca, H.F. Effect of 1,25-dihydroxyvitamin D3 on osteopenia induced by prednisolone in adult rats. Calcif. Tissue Res. 1982, 34, 253–257. [Google Scholar] [CrossRef]
  28. Corbee, R.; Tryfonidou, M.; Meij, B.; Kooistra, H.; Hazewinkel, H. Vitamin D status before and after hypophysectomy in dogs with pituitary-dependent hypercortisolism. Domest. Anim. Endocrinol. 2012, 42, 43–49. [Google Scholar] [CrossRef]
  29. Park, J.E.; Pichiah, P.T.; Cha, Y.-S. Vitamin D and metabolic diseases: Growing roles of Vitamin D. J. Obes. Metab. Syndr. 2018, 27, 223–232. [Google Scholar] [CrossRef]
  30. Medrano, M.; Carrillo-Cruz, E.; Montero, I.; Perez-Simon, J.A. Vitamin D: Effect on Haematopoiesis and immune system and clinical applications. Int. J. Mol. Sci. 2018, 19, 2663. [Google Scholar] [CrossRef]
  31. Fleseriu, M.; Auchus, R.; Bancos, I.; Ben-Shlomo, A.; Bertherat, J.; Biermasz, N.R.; Boguszewski, C.L.; Bronstein, M.D.; Buchfelder, M.; Carmichael, J.D.; et al. Consensus on diagnosis and management of Cushing’s disease: A guideline update. Lancet Diabetes Endocrinol. 2021, 9, 847–875. [Google Scholar] [CrossRef]
  32. Nieman, L.K.; Biller, B.M.K.; Findling, J.W.; Newell-Price, J.; Savage, M.O.; Stewart, P.M.; Montori, V. The diagnosis of Cushing’s Syndrome: An endocrine society clinical practice guideline. J. Clin. Endocrinol. Metab. 2008, 93, 1526–1540. [Google Scholar] [CrossRef] [PubMed]
  33. Expert Panel on Detection, Evaluation, Treatment of High Blood Cholesterol in Adults. Executive summary of the third report of the National Cholesterol Education Program (NCEP) expert panel on detection, evaluation, and treatment of high blood cholesterol in adults (Adult Treatment Panel III). JAMA 2001, 285, 2486–2497. [Google Scholar] [CrossRef] [PubMed]
  34. American Diabetes Association. Classification and diagnosis of diabetes: Standards of medical care in diabetes—2021. Diabetes Care 2021, 44 (Suppl. S1), S15–S33. [Google Scholar] [CrossRef] [PubMed]
  35. Guarnotta, V.; Amato, M.C.; Pivonello, R.; Arnaldi, G.; Ciresi, A.; Trementino, L.; Citarrella, R.; Iacuaniello, D.; Michetti, G.; Simeoli, C.; et al. The degree of urinary hypercortisolism is not correlated with the severity of cushing’s syndrome. Endocrine 2016, 55, 564–572. [Google Scholar] [CrossRef] [PubMed]
  36. Holick, M.F.; Binkley, N.C.; Bischoff-Ferrari, H.A.; Gordon, C.M.; Hanley, D.A.; Heaney, R.P.; Murad, M.H.; Weaver, C.M. Endocrine Society. Evaluation, treatment, and prevention of Vitamin D deficiency: An endocrine society clinical practice guideline. J. Clin. Endocrinol. Metab. 2011, 96, 1911–1930. [Google Scholar] [CrossRef]
  37. Fiebrich, H.-B.; Berg, G.V.D.; Kema, I.P.; Links, T.P.; Kleibeuker, J.H.; Van Beek, A.P.; Walenkamp, A.M.E.; Sluiter, W.J.; De Vries, E.G.E. Deficiencies in fat-soluble vitamins in long-term users of somatostatin analogue. Aliment. Pharmacol. Ther. 2010, 32, 1398–1404. [Google Scholar] [CrossRef]
  38. Matthews, D.R.; Hosker, J.P.; Rudenski, A.S.; Naylor, B.A.; Treacher, D.F.; Turner, R.C. Homeostasis model assessment: Insulin resistance and β-cell function from fasting plasma glucose and insulin concentrations in man. Diabetologia 1985, 28, 412–419. [Google Scholar] [CrossRef]
  39. Matsuda, M.; DeFronzo, R.A. Insulin sensitivity indices obtained from oral glucose tolerance testing: Comparison with the euglycemic insulin clamp. Diabetes Care 1999, 22, 1462–1470. [Google Scholar] [CrossRef]
  40. Utzschneider, K.M.; Prigeon, R.L.; Faulenbach, M.V.; Tong, J.; Carr, D.B.; Boyko, E.J.; Leonetti, D.L.; McNeely, M.J.; Fujimoto, W.Y.; Kahn, S.E. Oral disposition index predicts the development of future diabetes above and beyond fasting and 2-h glucose levels. Diabetes Care 2009, 32, 335–341. [Google Scholar] [CrossRef]
  41. Glendenning, P.; Zhu, K.; Inderjeeth, C.; Howat, P.; Lewis, J.R.; Prince, R.L. Effects of three-monthly oral 150,000 IU cholecalciferol supplementation on falls, mobility, and muscle strength in older postmenopausal women: A randomized controlled trial. J. Bone Miner. Res. 2011, 27, 170–176. [Google Scholar] [CrossRef]
  42. Kearns, M.D.; Alvarez, J.A.; Tangpricha, V. Large, single-dose, oral Vitamin D supplementation in adult populations: A systematic review. Endocr. Pract. 2014, 20, 341–351. [Google Scholar] [CrossRef] [PubMed]
  43. Lundqvist, J.; Norlin, M.; Wikvall, K. 1α,25-Dihydroxyvitamin D3 affects hormone production and expression of steroidogenic enzymes in human adrenocortical NCI-H295R cells. Biochim. Biophys. Acta 2010, 1801, 1056–1062. [Google Scholar] [CrossRef] [PubMed]
  44. Lemieux, P.; Weisnagel, S.J.; Caron, A.Z.; Julien, A.-S.; Morisset, A.-S.; Carreau, A.-M.; Poirier, J.; Tchernof, A.; Robitaille, J.; Bergeron, J.; et al. Effects of 6-month vitamin D supplementation on insulin sensitivity and secretion: A randomised, placebo-controlled trial. Eur. J. Endocrinol. 2019, 181, 287–299. [Google Scholar] [CrossRef] [PubMed]
  45. Li, Y.; Tong, C.H.; Rowland, C.M.; Radcliff, J.; Bare, L.A.; McPhaul, M.J.; Devlin, J.J. Association of changes in lipid levels with changes in vitamin D levels in a real-world setting. Sci. Rep. 2021, 11, 21536. [Google Scholar] [CrossRef] [PubMed]
  46. Dibaba, D.T. Effect of vitamin D supplementation on serum lipid profiles: A systematic review and meta-analysis. Nutr. Rev. 2019, 77, 890–902. [Google Scholar] [CrossRef] [PubMed]
  47. Povaliaeva, A.; Bogdanov, V.; Pigarova, E.; Zhukov, A.; Dzeranova, L.; Belaya, Z.; Rozhinskaya, L.; Mel’Nichenko, G.; Mokrysheva, N. Assessment of Vitamin D metabolism in patients with Cushing’s disease in response to 150,000 IU cholecalciferol treatment. Nutrients 2021, 13, 4329. [Google Scholar] [CrossRef]
Publisher’s Note: MDPI stays neutral with regard to jurisdictional claims in published maps and institutional affiliations.