Repeat Endoscopic Endonasal Transsphenoidal Surgery for Residual or Recurrent Cushing’s Disease: Safety, Feasibility, and Success

Abstract

Purpose

The success and outcomes of repeat endoscopic transsphenoidal surgery (ETS) for residual or recurrent Cushing’s disease (CD) are underreported in the literature. This study aims to address this gap by assessing the safety, feasibility, and efficacy of repeat ETS in these patients.

Methods

A retrospective analysis was conducted on 56 patients who underwent a total of 65 repeat ETS performed by a single neurosurgeon between January 2006 and December 2020. Data including demographic, clinical, laboratory, radiological, and operational details were collected from electronic medical records. Logistic regression was used to identify potential predictors associated with sustained remission.

Results

Among the cases, 40 (61.5%) had previously undergone microscopic surgery, while 25 (38.5%) had prior endoscopic procedures. Remission was achieved in 47 (83.9%) patients after the first repeat ETS, with an additional 9 (16.1%) achieving remission after the second repeat procedure. During an average follow-up period of 97.25 months, the recurrence rate post repeat surgery was 6.38%. Sustained remission was achieved in 48 patients (85.7%), with 44 after the first repeat ETS and 4 following the second repeat ETS. Complications included transient diabetes insipidus (DI) in 5 (7.6%) patients, permanent (DI) in 2 (3%) patients, and one case (1.5%) of panhypopituitarism. Three patients (4.6%) experienced rhinorrhea requiring reoperation. A serum cortisol level > 5 µg/dL on postoperative day 1 was associated with a reduced likelihood of sustained remission.

Conclusion

Repeat ETS is a safe and effective treatment option for residual or recurrent CD with satisfactory remission rates and low rates of complications.

Introduction

Cushing’s disease (CD) arises from an adrenocorticotropic hormone (ACTH)-secreting pituitary adenoma, leading to excessive endogenous glucocorticoid production [ 1 ]. The reported incidence of CD varies from 0.7 to 2.4 cases per million individuals annually [ 2 ‐ 6 ]. Hypercortisolism impacts every bodily system and is linked to increased morbidity and mortality risks [ 7 , 8 ]. Therefore, prompt CD diagnosis and management are crucial to enhance patient outcomes.
Transsphenoidal surgery remains the primary treatment for CD, and has been associated with satisfactory remission rates ranging from 65 to 94% [ 2 , 3 , 5 , 9 ‐ 11 ]. Two surgical techniques are utilized: microscopic and endoscopic approaches. While both methods are effective, studies indicate that endoscopic transsphenoidal surgery (ETS) offers higher rates of complete tumor removal and lower complication rates [ 12 ‐ 14 ]. ETS holds advantages over microscopic transsphenoidal surgery (MTS) due to superior tumor visualization, especially for laterally invasive tumors and macroadenomas [ 15 ]. Since its introduction in 1997, ETS has gained popularity and is now the standard surgical approach for managing CD [ 16 ].
Remission rates post-ETS for CD treatment range from 77 to 90% [ 17 ‐ 22 ]. Despite ETS’s technical benefits and favorable outcomes, recurrence rates for Cushing’s disease after successful ETS range between 5.6% and 22.8% [ 17 , 18 , 22 , 23 ]. Reoperating for residual or recurrent CD presents challenges due to altered surgical landmarks and scar tissue formation from previous surgeries, potentially elevating morbidity, and mortality risks [ 24 , 25 ]. Limited literature exists on the success and outcomes of repeat endoscopic transsphenoidal surgery for residual or recurrent CD. This study aims to address this gap by assessing the safety, feasibility, and efficacy of repeat ETS in patients with residual or recurrent Cushing’s disease.

Methods

Study design

This is a retrospective cohort study of repeat endoscopic transsphenoidal surgery for residual or recurrent Cushing’s disease. All patients underwent endoscopic endonasal transsphenoidal surgery by the senior author between 2006 and 2020. The study protocol was approved by the local ethics committee for clinical studies.

Patient selection

The study participants were selected based on specific inclusion and exclusion criteria. Inclusion criteria were as follows: (i) a confirmed diagnosis of Cushing’s disease, (ii) prior transsphenoidal surgery, and (iii) confirmation of residual or recurrent CD through clinical, laboratory, and/or imaging assessments. Exclusion criteria included: (i) prior craniotomy without transsphenoidal surgery, (ii) previous radiotherapy before reoperation, (iii) inaccessible clinical, laboratory, or radiological data, and (iv) follow-up duration of less than 6 months.

Diagnostic criteria

Each patient underwent thorough screening for active Cushing’s disease. An increased 24-hour urine cortisol level > 45 µg/day or a serum fasting cortisol level exceeding 1.8 µg/dl following a low-dose (2 mg) dexamethasone suppression test was deemed abnormal. Subsequently, a high-dose (8 mg) dexamethasone test was administered, and a reduction of 50% or more from the baseline value was indicative of active Cushing’s disease. Due to the technical limitations of the institution that the research has been done, late-night salivary cortisol tests were not performed. Early remission was characterized by a fasting serum cortisol level below 5 µg/dl on the 1st and 7th postoperative days. Patients displaying a serum cortisol level below 1.8 µg/dl after the low-dose dexamethasone suppression test or those requiring continued corticosteroid replacement post-surgery were considered to maintain remission. The presence of a residual adenoma on postoperative magnetic resonance imaging (MRI) confirmed residual disease.

Routine follow-up protocol

Patients were evaluated for Cushing’s disease symptoms before surgery and monitored at 6 months after surgery, as well as during annual check-ups for any changes in their condition. Fasting serum ACTH and cortisol levels were measured in the morning before surgery, on the 1st and 7th days after surgery, at the 1st, 3rd, and 6th months, and during annual follow-up appointments. Prior to surgery, all patients underwent contrast-enhanced pituitary MRI and paranasal sinus CT scans. Follow-up pituitary MRI scans were conducted on the 1st day, at 3 and 12 months after surgery, and then annually thereafter.

Data collection

Data from electronic medical records were gathered, encompassing demographic, clinical, laboratory, radiological, and operational details. Laboratory assessments comprised an anterior pituitary hormone panel (Follicle-stimulating hormone [FSH], Luteinizing hormone [LH], Thyroid-stimulating hormone [TSH], Prolactin [PRL], Growth hormone [GH]), serum electrolytes, preoperative and postoperative serum ACTH, and cortisol levels. Patient records, along with CT and MRI scans, were scrutinized to document preoperative tumor characteristics such as size, multifocality, relationship with the cavernous sinus, Hardy-Wilson classification of sellar destruction, and suprasellar extension. Tumors larger than 10 mm were classified as macroadenomas. The operational database was examined to collect data on previous surgeries, including the number and dates of prior procedures, as well as the surgical techniques utilized. Outcome measures included remission rates and surgical complications.

Statistical analysis

Statistical analysis was conducted utilizing SPSS 23.0 software (IBM, New York). Two-group comparisons were performed using Chi-square and Fisher’s exact tests for categorical variables and Student’s t-test for continuous variables. Categorical variables were presented as numbers and percentages, while continuous variables were presented as means ± SD or median [IQR]. Logistic regression was performed to investigate potential predictors linked to sustained remission. A p-value of < 0.05 was considered statistically significant.

Results

Baseline characteristics

Supplementary File 1 displays the demographic characteristics of the patient cohort.
A retrospective analysis was conducted on 190 patients who underwent a total of 212 operations for CD at our department between January 2006 and December 2020. Among them, 56 patients, comprising 65 repeat endonasal transsphenoidal surgeries due to either recurrence ( n  = 18, 27.7% ) or residual disease ( n  = 47, 72.3%), were identified. The majority of patients were female ( n  = 48, 85.7%), with a mean age of 37.6 ± 12.4 years. Of the 56 patients, 43 (76.8%) were referred from another institution. Most patients ( n  = 42, 75%) had undergone only one prior surgery, while 12 patients (21.4%) had a history of two previous surgeries, and 2 patients (3.6%) had undergone three prior surgeries before referral to our center. The average follow-up duration since the first repeat ETS was 97.2 ± 36.8 months. The mean time to recurrence was 80.2 ± 61.1 months (median 75 months, range 23.2 to 103.5 months).

Hormonal data

Table  1 depicts the preoperative and postoperative serum ACTH and cortisol levels. The average preoperative serum cortisol levels for the entire patient cohort stood at 18.7 ± 11.1 µg/dL (median 17, range 12-24.6). The median preoperative 24-hour urine free cortisol level was 237 µg/day [188.5–425.5]. On the initial postoperative day, the mean serum cortisol levels for all patients were 13.4 ± 13.8 µg/dL (median 6.4, range 1.7–21). In 46.2% of cases ( n  = 30), cortisol levels on the first postoperative day were below 5 µg/dL (< 2 µg/dL in 33.8%). A comparison of the mean preoperative and postoperative serum ACTH and cortisol levels between the groups with residual disease and recurrence is detailed in Table  1 .
Table 1

Cohort overview and comparison of recurrence and residual disease groups
variable
Total ( n  = 65)
Residual disease ( n  = 47)
Recurrence ( n  = 18)
p -value
Technique of the previous surgery
< 0.001
 MTS
40 (61.5)
36 (76.6)
4 (22.2)
 ETS
25 (38.5)
11 (23.4)
14 (77.8)
Tumor size
 Microadenoma
41 (63.1)
30 (63.8)
11 (61.1)
0.839
 Macroadenoma
24 (36.9)
17 (36.2)
7 (38.9)
Multifocality
 Unifocal
50 (76.9)
37 (78.7)
13 (72.2)
0.743
 Bifocal
15 (23.1)
10 (21.3)
5 (27.8)
Relation to cavernous sinus
 Extension
21 (32.3)
15 (31.9)
6 (33.3)
0.589
 invasion
10 (15.4)
6 (12.8)
4 (22.2)
 No relationship
34 (52.3)
26 (55.3)
8 (44.4)
Hardy-Wilson Classification
0.339
 Degrees
  I
38 (58.5)
25 (59.5)
8 (57.1)
  II
16 (24.6)
8 (19)
5 (5)
  III
6 (9.2)
6 (14.3)
1 (7.1)
  IV
5 (7.7)
3 (7.1)
0 (0)
 stage
0.443
  A
30 (46.2)
19 (45.2)
7 (50)
  b
7 (10.8)
4 (9.5)
3 (21.4)
  C
2 (3.1)
2 (4.8)
0 (0)
  D
1 (1.5)
0 (0)
0 (0)
  E
25 (38.5)
17 (40.5)
4 (28.6)
Laboratory values
 Preoperative serum ACTH (pg/mL)
182.71 ± 577.08
60.5 [37.15–104.5]
220.7 ± 675.73
83.5 ± 61.7
0.395
 Preoperative serum cortisol (µg/dL)
18.75 ± 11.16
17 [12-24.65]
19.18 ± 12.11
17.64 ± 8.39
0.621
 Postoperative serum ACTH (pg/mL)
43.29 ± 50.2
25.5 [15.8–53.7]
43.07 ± 45.42
43.94 ± 63.96
0.953
 Postoperative serum cortisol (µg/dL)
13.41 ± 13.85
6.45 [1.77–21.01]
14.62 ± 14.52
10.25 ± 11.7
0.259
POD 1 Cortisol levels
0.700
 >5 µg/dL
35 (53.8)
26 (55.3)
9 (50)
 ≤5 µg/dL
30 (46.2)
21 (44.7)
9 (50)
Tumor pathology
0.198
 ACTH + adenoma
55 (85)
40 (85.1)
15 (83.3)
 Crooke degeneration
2 (3)
1 (2.1)
1 (5.6)
 Pituitary hyperplasia
2 (3)
1 (2.1)
1 (5.6)
 Normal pituitary tissue
6 (9)
5 (10.6)
1 (5.6)
Result of reoperation
0.740
 Remission
51 (78.5)
36 (76.6)
15 (83.3)
 Residual disease
14 (21.5)
11 (23.4)
3 (16.7)
Values ​​are shown as number (%), mean ± SD or median [IQR] unless otherwise indicated
Abbreviations MTS, microscopic transsphenoidal surgery; ETS, endoscopic transsphenoidal surgery; ACTH, adrenocorticotropic hormone; POD 1, postoperative day 1

Radiological findings

In the entire case cohort, there were 41 microadenomas (63.1%) and 24 macroadenomas (36.9%). Fifteen cases (23.1%) exhibited bifocal adenomas. Adenoma extension into the cavernous sinuses, indicated by cavernous sinus wall displacement, was present in 21 cases (32.3%), while invasion into the cavernous sinuses was observed in 10 cases (15.4%). Based on the Hardy-Wilson Classification, there were 38 Grade I adenomas (58.5%), 16 Grade II adenomas (24.6%), 6 Grade III adenomas (9.2%), and 5 Grade IV adenomas (7.7%). Thirty patients (46.2%) presented with Stage A adenoma, 7 (10.8%) with Stage B adenoma, 2 (3.1%) with Stage C adenoma, 1 (1.5%) with Stage D adenoma, and 25 (38.5%) with Stage E adenoma. As indicated in Table  1 , there were no statistically significant differences between patients with residual disease and recurrence concerning radiological findings.

Surgical characteristics

A single surgeon conducted all 65 reoperations. Among these, 47 patients (72.3%) underwent repeat ETS due to residual disease, while 18 (27.7%) did so due to recurrence. The previous surgical technique was microscopic in 40 cases (61.5%) and endoscopic in 25 cases (38.5%). Microscopic transsphenoidal surgeries were exclusively performed at other institutions. There was a notable disparity between patients with residual disease and recurrence regarding the technique of the previous surgery. Residual disease occurrence following endoscopic transsphenoidal surgery was less frequent ( n  = 11/25, 44%) compared to after microscopic transsphenoidal surgery ( n  = 36/40, 90%; p  < 0.001) (Table  1 ). Immunohistochemical staining of the specimens indicated that 55 cases (85%) exhibited ACTH-positive adenoma. Nevertheless, all patients with a negative pathology at the repeat surgery had a confirmed ACTH adenoma at the first surgery. Of the 10 patients (15%) with a negative ACTH-positive adenoma pathology, two patients underwent inferior petrosal sinus sampling (IPSS) previously and were confirmed to have CD. Remaining patients did not undergo an additional inferior petrosal sinus sampling (IPSS) because all functional test results indicated a central source and MRI confirmed pituitary microadenoma in all cases. Notably, there are studies reporting that IPSS may not be required in patients with a sellar mass and a biochemical testing suggestive of CD [ 26 , 27 ]. Additionally, we also explored both sides of the pituitary and confirmed the adenoma intraoperatively. Therefore, negative pathology in the repeat surgery is most likely due to sampling error.

Outcomes

As depicted in Fig.  1 , among the 56 patients, 47 (83.9%) experienced initial remission following the first repeat ETS, while 9 (16.1%) still had residual adenoma. Within the group achieving initial remission, 44 patients (93.6%) maintained remission without the need for further surgeries, while 3 (6.4%) experienced recurrence during follow-up and required a second repeat ETS.
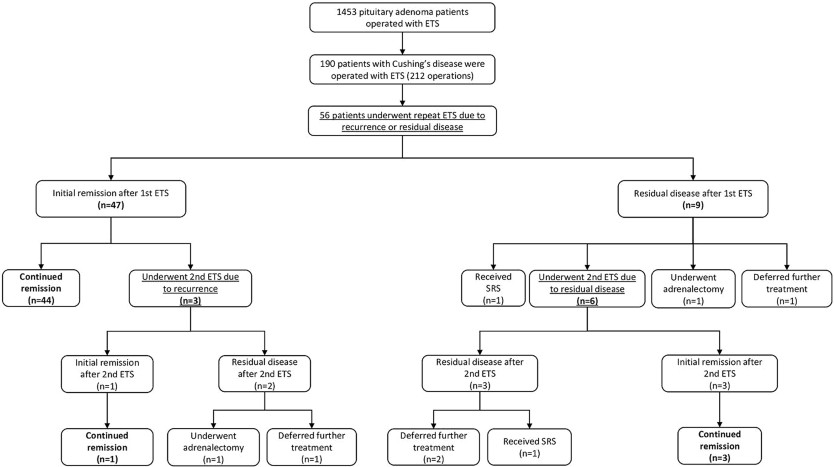
https://static-content.springer.com/image/art%3A10.1007%2Fs11102-024-01396-x/MediaObjects/11102_2024_1396_Fig1_HTML.png

Fig. 1

Outcomes of repeat endoscopic transsphenoidal surgery for residual or recurrent Cushing’s disease
Among the 9 patients with residual disease after the first repeat ETS, 1 (11.1%) opted to defer further treatment, 1 (11.1%) received radiotherapy, 1 (11.1%) chose adrenalectomy, and 6 (66.7%) underwent a second repeat ETS. Of the 9 patients who underwent a second repeat ETS due to residual disease or recurrence, 4 (44.4%) sustained remission, 5 (55.6%) still had residual disease, but 3 of them deferred further treatment, 1 received radiotherapy, while 1 achieved remission after adrenalectomy. Overall, 78.5% ( n  = 51) of the entire case cohort achieved remission following repeat ETS. Representative cases are presented in Fig.  2 .
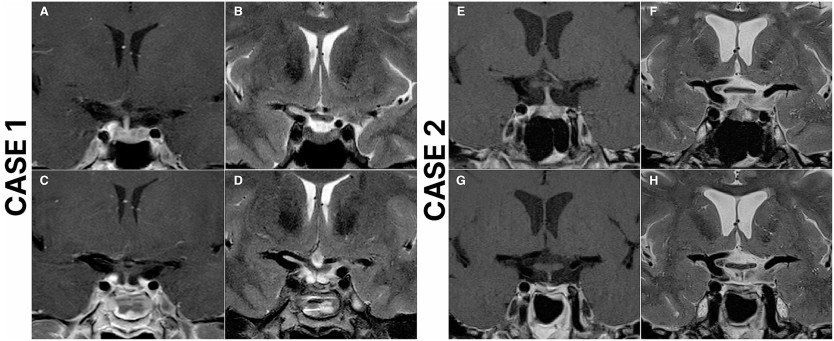
https://static-content.springer.com/image/art%3A10.1007%2Fs11102-024-01396-x/MediaObjects/11102_2024_1396_Fig2_HTML.png

Fig. 2

Case 1: Preoperative and postoperative magnetic resonance imaging (MRI) scans of a 49-year-old female who underwent repeat endoscopic transsphenoidal surgery (ETS) due to recurrent Cushing’s disease and achieved remission. The patient underwent initial surgery 14 years ago at an outside institution. Preoperative T2 ( A ), and T1 contrast-enhanced ( B ) MRI scans demonstrate a right-sided pituitary adenoma. Postoperative T2 ( C ), and T1 contrast-enhanced ( D ) MRI scans demonstrate total resection of the adenoma. Case 2: Preoperative and postoperative magnetic resonance imaging (MRI) scans of a 53-year-old female who underwent repeat endoscopic transsphenoidal surgery (ETS) due to recurrent Cushing’s disease and achieved remission. The patient underwent initial surgery 3 years ago at an outside institution. Preoperative T2 ( E ), and T1 contrast-enhanced ( F ) MRI scans demonstrate a left-sided pituitary adenoma, in close relation to ICA. Postoperative T2 ( G ), and T1 contrast-enhanced ( H ) MRI scans demonstrate total resection of the adenoma
Transient diabetes insipidus (DI) developed in 5 patients (7.6%), while 2 (3%) experienced permanent DI following repeat ETS. Intraoperative cerebrospinal fluid (CSF) leak occurred in 20 operations (30.7%). Three patients (4.6%) developed rhinorrhea and required reoperation. Five patients (7.6%) developed prolactin deficiency, 3 patients (4.6%) had GH deficiency, and another 3 patients (4.6%) had TSH deficiency requiring thyroxine replacement. Four patients (6.2%) had combined deficiencies in TSH, FSH, LH and prolactin, while one patient (1.5%) developed panhypopituitarism following the second repeat ETS.

Factors predisposing to unsuccessful repeat endoscopic transsphenoidal surgery

Among the 42 patients who underwent repeat ETS for residual disease, 9 (21.4%) still had residual disease after the first repeat ETS. We conducted a multivariable logistic regression analysis to explore potential risk factors for unsuccessful repeat ETS. However, the analysis did not reveal any significant association between the success of repeat ETS and factors such as extension or invasion into cavernous sinuses, sellar or parasellar extension, or tumor size (Supplementary File 1 ).

Potential predictors of sustained remission

We conducted a multivariable logistic regression analysis to investigate possible predictors of sustained remission. The variables included in the analysis are detailed in Table 5. The results indicated that having a serum cortisol level exceeding 5 µg/dL on postoperative day 1 was linked to a decreased likelihood of achieving sustained remission (odds ratio [OR] 0.09, 95% confidence interval [CI] 0.01–0.52, p  = 0.006) (Table  2 ).
Table 2

Logistic regression analysis of potential predictors for continued remission
variable
OR (95% CI)
p -value
Age
1.003 (0.94–1.06)
0.913
Gender
 Female
Reference
 times
0.43 (0.06–2.88)
0.387
Indication for repeat ETS
 Residual disease
Reference
 Recurrence
1.2 (0.25–5.68)
0.812
Tumor size
 Microadenoma
Reference
 Macroadenoma
0.94 (0.18–4.79)
0.948
Relation to cavernous sinus
 No relation
Reference
 Extension invasion
0 (0)
0.999
Hardy-Wilson Classification
 Degrees
  I-II
Reference
  III-IV
3.2 (0.3-34.06)
0.334
 stage
  AC
Reference
  EN
0 (0)
0.999
POD 1 Cortisol levels
 ≤5 µg/dL
Reference
 >5 µg/dL
0.09 (0.01–0.52)
0.006
Abbreviations ETS, endoscopic transsphenoidal surgery; POD 1, postoperative day 1

Discussion

Transsphenoidal surgery remains the established standard for treating Cushing’s disease, with demonstrated remission rates ranging from 65 to 94%, contingent upon the surgeon’s expertise and remission criteria [ 2 , 3 , 5 , 9 ‐ 11 ]. The advent of endoscopic techniques has significantly augmented this approach, offering greater visibility, reduced nasal trauma, and shorter hospital stays [ 16 , 25 , 28 , 29 ]. While the effectiveness of ETS in managing CD is well-documented, literature on its efficacy in treating residual or recurrent cases is limited. Our study addresses this gap by assessing the safety, feasibility, and outcomes of repeat ETS for patients with persistent or recurrent Cushing’s disease.
In our study, 56 patients underwent 65 repeat ETS procedures for residual or recurrent Cushing’s disease. Mean follow-up duration was 97.2 ± 36.8 months, which is one of the longest follow-up durations that has been reported following repeat endoscopic transsphenoidal surgery [ 5 , 30 ‐ 32 ]. Of these patients, 40 (61.5%) had previously undergone microscopic surgery, while 25 (38.5%) had undergone prior endoscopic procedures. Importantly, a notable difference emerged between patients with residual disease and those experiencing recurrence regarding the prior surgical approach, with residual disease being less frequent after endoscopic surgery compared to microscopic surgery ( p  < 0.001). This variance was expected, as numerous studies have indicated that ETS yields a higher rate of complete resection compared to MTS [ 12 ‐ 14 ].
After the first repeat ETS, 47 patients (83.9%) achieved remission, and 78.5% ( n  = 44) of them maintained remission at a mean follow-up of 97.2 months without requiring additional surgery. Limited data exists regarding the remission rates of CD following repeat transsphenoidal surgery, with reported rates ranging from 28.9 to 73% [ 33 , 34 , 35 ]. Burke et al. reported an immediate remission rate of 86.7% and a continued remission rate of 73.3% at follow-up after repeat ETS [ 36 ]. Among our patients who achieved remission after successful repeat ETS, 3 individuals (6.38%, n  = 3/47) experienced recurrence after the first repeat ETS, with a mean time to recurrence of 45.6 months. The rates of CD recurrence following reoperation vary, with documented rates ranging between 22% and 63.2% [ 37 , 38 ]. In our study, 9 patients required a second repeat ETS due to residual disease or recurrence. Of these, 4 (44.4%) achieved continued remission following the second repeat ETS, while 5 (55.6%) had residual disease; however, 4 of them deferred further treatment, and 1 achieved remission after adrenalectomy. In total, 47 patients (83.9%) in the entire patient cohort achieved remission following endoscopic transsphenoidal surgery and did not require further intervention.
Within our case cohort, among the 42 patients who underwent repeat ETS for residual disease, 9 individuals (21.4%) continued to exhibit residual disease following the first repeat ETS. We did not establish a significant association between the success of repeat ETS and factors such as extension or invasion into cavernous sinuses, sellar or parasellar extension, or tumor size.
The degree of hypocortisolism following transsphenoidal surgery is considered a potential indicator of remission in the postoperative period [ 3 ]. Numerous studies have indicated that patients with subnormal postoperative cortisol levels tend to experience a lower recurrence rate compared to those with normal or supranormal levels, although consensus on the precise cutoff level remains elusive [ 30 ‐ 32 , 39 ]. In a retrospective study involving 52 patients with CD, researchers reported a 100% positive predictive value of a postoperative nadir cortisol level < 2 µg/dL for achieving remission [ 5 ]. Additionally, Esposito et al. observed that a morning serum cortisol level ≤ 5 µg/dL on postoperative day 1 or 2 appears to serve as a reliable predictor of remission [ 11 ]. In our investigation, logistic regression analysis revealed that patients with a serum cortisol level > 5 µg/dL on postoperative day 1 were less inclined to achieve continued remission compared to those with a serum cortisol level < 5 µg/dL on postoperative day 1.
Repeat transsphenoidal surgery presents unique challenges due to distorted surgical landmarks and the presence of scar tissue from prior procedures, often resulting in lower cure rates and increased morbidity risk [ 24 , 25 , 28 ]. Non-surgical options such as radiotherapy and radiosurgery have been considered as an effective treatment option for recurrent or residual CD due to low rates of morbidity and acceptable remission rates [ 28 , 40 ]. However, our findings suggest that the outcomes and complication rates associated with repeat ETS are comparable to primary ETS for CD and superior to other non-surgical options for residual or recurrent CD. Within our patient cohort, 5 (7.6%) individuals experienced transient diabetes insipidus (DI), while 2 (3%) developed permanent DI. Additionally, one patient (1.5%) experienced panhypopituitarism following the second repeat ETS. Similarly, various studies have reported DI rates ranging from 2 to 13% and panhypopituitarism rates between 2% and 9.7% [ 25 , 28 , 41 ‐ 43 ]. In our series, 3 (5.3%) patients developed rhinorrhea and required reoperation, consistent with reported rates of postoperative CSF leak ranging from 1 to 5% following repeat endoscopic transsphenoidal surgery for residual or recurrent pituitary tumors [ 25 , 28 , 44 ]. While radiotherapy and radiosurgery are options for patients who have failed transsphenoidal surgery or experienced recurrence, the literature suggests remission rates ranging from 46 to 84%, with several studies indicating high recurrence rates (25-50%) following radiotherapy [ 40 , 45 ‐ 47 ]. In our study, among 56 patients, 47 (83.9%) achieved remission following the first repeat ETS, while 4 (17.8%) achieved remission after the second repeat ETS. Over a mean follow-up duration of 97.25 months, our recurrence rate following repeat ETS was 27.7%, with a mean time to recurrence of 45.62 months.
At our institution, we adhere to a specific algorithm (Fig.  3 ) for managing Cushing’s disease patients and implement a meticulous protocol for individuals undergoing repeat ETS for residual or recurrent CD. A thorough clinical and radiological assessment is conducted for all patients before surgery. Detailed radiological evaluation is particularly essential to identify any distortions in surgical landmarks from prior procedures, such as the course of sphenoidal septa and the location of the sellar floor opening, as well as other potential aberrations like internal carotid artery and optic nerve dehiscence. Imaging techniques should encompass dynamic pituitary MRI with and without contrast and paranasal CT scans. Our objective is to achieve extensive exposure during surgery, which is especially critical for managing bifocal adenomas or adenomas with cavernous sinus invasion or extension. The expanded visual field also facilitates the visualization of concealed parts of the adenoma, allowing the surgeon to achieve complete resection, which may be challenging or even impossible with limited exposure. We employ a multilayer closure technique to prevent CSF leaks, and if necessary, utilize a vascularized pedicled nasoseptal flap (Hadad-Bassagasteguy flap).
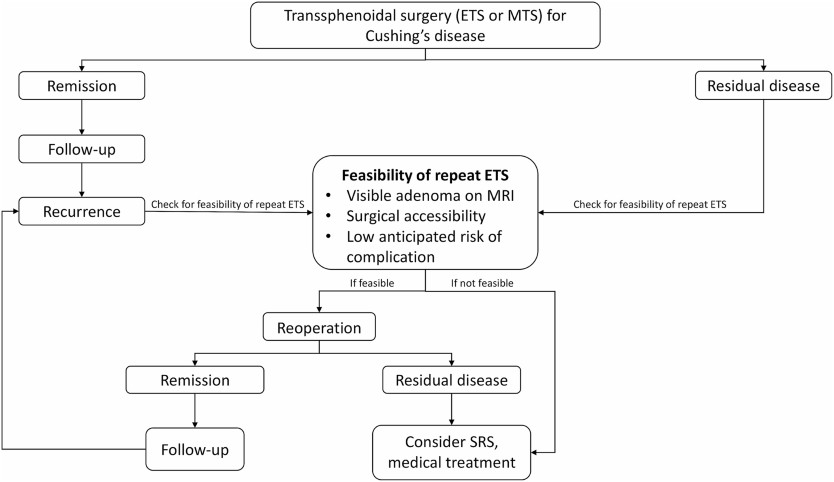
https://static-content.springer.com/image/art%3A10.1007%2Fs11102-024-01396-x/MediaObjects/11102_2024_1396_Fig3_HTML.png

Fig. 3

Specific algorithm for the management of Cushing’s disease patients
In summary, our findings suggest that in the hands of experienced surgeons, repeat ETS represents a safe and effective treatment option for managing residual or recurrent Cushing’s disease.

Strengths and limitations

Our study represents one of the largest case series in the literature examining the safety, feasibility, and efficacy of repeat ETS for managing recurrent or residual CD. Our findings underscore the safety and efficacy of repeat ETS in experienced centers, showcasing satisfactory remission rates and minimal complications. However, it is important to acknowledge the retrospective nature of our study, which inherently introduces potential biases such as selection bias. Lastly, our study exclusively focuses on patients undergoing surgical intervention for recurrent or residual CD, limiting our ability to compare the effectiveness of surgical treatment with alternative modalities like radiotherapy or radiosurgery.

Conclusion

Our study underscores the efficacy and safety of repeat endoscopic transsphenoidal surgery in managing residual or recurrent Cushing’s disease. Remarkably, 82.1% of patients achieved remission after their first reoperation, aligning closely with reported remission rates following primary endoscopic transsphenoidal surgery. Furthermore, the complication rates observed in our cohort were consistent with documented rates for both primary and repeat transsphenoidal surgeries. Notably, patients with serum cortisol levels < 5 µg/dL are more likely to maintain remission. Overall, our findings emphasize that in the hands of experienced surgeons, repeat endoscopic transsphenoidal surgery emerges as a reliable and safe treatment modality for residual or recurrent Cushing’s disease, offering satisfactory remission rates and minimal complications.

Acknowledgments

Not applicable.

Declarations

Ethical approval

This study is approved by the ethics committee of the hospital where the research was conducted and informed consent is obtained from patients.

Competing interests

The authors declare no competing interests.
Open Access This article is licensed under a Creative Commons Attribution 4.0 International License, which permits use, sharing, adaptation, distribution and reproduction in any medium or format, as long as you give appropriate credit to the original author(s) and the source, provide a link to the Creative Commons license, and indicate if changes were made. The images or other third party material in this article are included in the article’s Creative Commons license, unless indicated otherwise in a credit line to the material. If material is not included in the article’s Creative Commons license and your intended use is not permitted by statutory regulation or exceeds the permitted use, you will need to obtain permission directly from the copyright holder. To view a copy of this license, visit http://​creativecommons.​org/​licenses/​by/​4.​0/​ .

Publisher’s Note

Springer Nature remains neutral with regard to jurisdictional claims in published maps and institutional affiliations.


Unveiling the Uncommon: Cushing’s Syndrome (CS) Masquerading as Severe Hypokalemia

Abstract

Cushing’s syndrome (CS) arises from an excess of endogenous or exogenous cortisol, with Cushing’s disease specifically implicating a pituitary adenoma and exaggerated adrenocorticotropic hormone (ACTH) production. Typically, Cushing’s disease presents with characteristic symptoms such as weight gain, central obesity, moon face, and buffalo hump.

This case report presents an unusual manifestation of CS in a 48-year-old male with a history of hypertension, where severe hypokalemia was the primary presentation. Initial complaints included bilateral leg swelling, muscle weakness, occasional shortness of breath, and a general feeling of not feeling well. Subsequent investigations revealed hypokalemia, metabolic alkalosis, and an abnormal response to dexamethasone suppression, raising concerns about hypercortisolism. Further tests, including 24-hour urinary free cortisol and ACTH testing, confirmed significant elevations. Brain magnetic resonance imaging (MRI) identified a pituitary macroadenoma, necessitating neurosurgical intervention.

This case underscores the rarity of CS presenting with severe hypokalemia, highlighting the diagnostic challenges and the crucial role of a collaborative approach in managing such intricate cases.

Introduction

Cushing’s syndrome (CS), characterized by excessive cortisol production, is well-known for its diverse and often conspicuous clinical manifestations. Cushing’s disease is a subset of CS resulting from a pituitary adenoma overproducing adrenocorticotropic hormone (ACTH), leading to heightened cortisol secretion. The classic presentation involves a spectrum of symptoms such as weight gain, central obesity, muscle weakness, and mood alterations [1].

Despite its classic presentation, CS can demonstrate diverse and atypical features, challenging conventional diagnostic paradigms. This case report sheds light on a rare manifestation of CS, where severe hypokalemia was the primary clinical indicator. Notably, instances of CS prominently manifesting through severe hypokalemia are scarce in the literature [1,2].

Through this exploration, we aim to provide valuable insights into the diagnostic intricacies of atypical CS presentations, underscore the significance of a comprehensive workup, and emphasize the collaborative approach essential for managing such uncommon hormonal disorders.

Case Presentation

A 48-year-old male with a history of hypertension presented to his primary care physician with complaints of bilateral leg swelling, occasional shortness of breath, dizziness, and a general feeling of malaise persisting for 10 days. The patient reported increased water intake and urinary frequency without dysuria. The patient was diagnosed with hypertension eight months ago. He experienced progressive muscle weakness over two months, hindering his ability to perform daily activities, including using the bathroom. The primary care physician initiated a blood workup that revealed severe hypokalemia with a potassium level of 1.3 mmol/L (reference range: 3.6 to 5.2 mmol/L), prompting referral to the hospital.

Upon admission, the patient was hypertensive with a blood pressure of 180/103 mmHg, a heart rate of 71 beats/minute, a respiratory rate of 18 breaths/minute, and an oxygen saturation of 96% on room air. Physical examination revealed fine tremors, bilateral 2+ pitting edema in the lower extremities up to mid-shin, abdominal distension with normal bowel sounds, and bilateral reduced air entry in the bases of the lungs on auscultation. The blood work showed the following findings (Table 1).

Parameter Result Reference Range
Potassium (K) 1.8 mmol/L 3.5-5.0 mmol/L
Sodium (Na) 144 mmol/L 135-145 mmol/L
Magnesium (Mg) 1.3 mg/dL 1.7-2.2 mg/dL
Hemoglobin (Hb) 15.5 g/dL 13.8-17.2 g/dL
White blood cell count (WBC) 13,000 x 103/µL 4.5 to 11.0 × 10⁹/L
Platelets 131,000 x 109/L 150-450 x 109/L
pH 7.57 7.35-7.45
Bicarbonate (HCO3) 46 mmol/L 22-26 mmol/L
Lactic acid 4.2 mmol/L 0.5-2.0 mmol/L
Table 1: Blood work findings

In order to correct the electrolyte imbalances, the patient received intravenous (IV) magnesium and potassium replacement and was later transitioned to oral. The patient was also started on normal saline at 100 cc per hour. To further investigate the complaint of shortness of breath, the patient underwent a chest X-ray, which revealed bilateral multilobar pneumonia (Figure 1). He was subsequently treated with ceftriaxone (1 g IV daily) and clarithromycin (500 mg twice daily) for seven days.

A-chest-X-ray-revealing-(arrows)-bilateral-multilobar-pneumonia
Figure 1: A chest X-ray revealing (arrows) bilateral multilobar pneumonia

With persistent abdominal pain and lactic acidosis, a computed tomography (CT) scan abdomen and pelvis with contrast was conducted, revealing a psoas muscle hematoma. Subsequent magnetic resonance imaging (MRI) depicted an 8×8 cm hematoma involving the left psoas and iliacus muscles. The interventional radiologist performed drainage of the hematoma involving the left psoas and iliacus muscles (Figure 2).

Magnetic-resonance-imaging-(MRI)-depicting-an-8x8-cm-hematoma-(arrow)-involving-the-left-psoas-and-iliacus-muscles
Figure 2: Magnetic resonance imaging (MRI) depicting an 8×8 cm hematoma (arrow) involving the left psoas and iliacus muscles

In light of the concurrent presence of hypokalemia, hypertension, and metabolic alkalosis, there arose concerns about Conn’s syndrome, prompting consultation with endocrinology. Their recommended workup for Conn’s syndrome included assessments of the aldosterone-renin ratio and random cortisol levels. The results unveiled an aldosterone level below 60 pmol/L (reference range: 190 to 830 pmol/L in SI units) and a plasma renin level of 0.2 pmol/L (reference range: 0.7 to 3.3 mcg/L/hr in SI units). Notably, the aldosterone-renin ratio was low, conclusively ruling out Conn’s syndrome. The random cortisol level was notably elevated at 1334 nmol/L (reference range: 140 to 690 nmol/L).

Furthermore, a low-dose dexamethasone suppression test was undertaken due to the high cortisol levels. Following the administration of 1 mg of dexamethasone at 10 p.m., cortisol levels were measured at 9 p.m., 3 a.m., and 9 a.m. the following day. The results unveiled a persistently elevated cortisol level surpassing 1655 nmol/L, signaling an abnormal response to dexamethasone suppression and raising concerns about a hypercortisolism disorder, such as CS.

In the intricate progression of this case, the investigation delved deeper with a 24-hour urinary free cortisol level, revealing a significant elevation at 521 mcg/day (reference range: 10 to 55 mcg/day). Subsequent testing of ACTH portrayed a markedly elevated level of 445 ng/L, distinctly exceeding the normal reference range of 7.2 to 63.3 ng/L. A high-dose 8 mg dexamethasone test was performed to ascertain the source of excess ACTH production. The baseline serum cortisol levels before the high-dose dexamethasone suppression test were 1404 nmol/L, which decreased to 612 nmol/L afterward, strongly suggesting the source of excess ACTH production to be in the pituitary gland.

A CT scan of the adrenal glands ruled out adrenal mass, while an MRI of the brain uncovered a 1.3×1.3×3.2 cm pituitary macroadenoma (Figure 3), leading to compression of adjacent structures. Neurosurgery was consulted, and they recommended surgical removal of the macroadenoma due to the tumor size and potential complications. The patient was referred to a tertiary care hospital for pituitary adenoma removal.

Magnetic-resonance-imaging-(MRI)-of-the-brain-depicting-a-1.3x1.3x3.2-cm-pituitary-macroadenoma-(star)
Figure 3: Magnetic resonance imaging (MRI) of the brain depicting a 1.3×1.3×3.2 cm pituitary macroadenoma (star)

Discussion

CS represents a complex endocrine disorder characterized by excessive cortisol production. While the classic presentation of CS includes weight gain, central obesity, and muscle weakness, our case highlights an uncommon initial manifestation: severe hypokalemia. This atypical presentation underscores the diverse clinical spectrum of CS and the challenges it poses in diagnosis and management [1,2].

While CS typically presents with the classic symptoms mentioned above, severe hypokalemia as the initial manifestation is exceedingly rare. Hypokalemia in CS often results from excess cortisol-mediated activation of mineralocorticoid receptors, leading to increased urinary potassium excretion and renal potassium wasting. Additionally, metabolic alkalosis secondary to cortisol excess further exacerbates hypokalemia [3,4].

Diagnosing a case of Cushing’s disease typically commences with a thorough examination of the patient’s medical history and a comprehensive physical assessment aimed at identifying characteristic manifestations such as central obesity, facial rounding, proximal muscle weakness, and increased susceptibility to bruising. Essential to confirming the diagnosis are laboratory examinations, which involve measuring cortisol levels through various tests, including 24-hour urinary free cortisol testing, late-night salivary cortisol testing, and dexamethasone suppression tests. Furthermore, assessing plasma ACTH levels aids in distinguishing between pituitary-dependent and non-pituitary causes of CS. Integral to the diagnostic process are imaging modalities such as MRI of the pituitary gland, which facilitate the visualization of adenomas and the determination of their size and precise location [1-4].

Treatment for Cushing’s disease primarily entails surgical removal of the pituitary adenoma via transsphenoidal surgery, with the aim of excising the tumor and restoring normal pituitary function. In cases where surgical intervention is unsuitable or unsuccessful, pharmacological therapies employing medications such as cabergoline (a dopamine receptor agonist) or pasireotide (a somatostatin analogue) may be considered to suppress ACTH secretion and regulate cortisol levels. Additionally, radiation therapy, whether conventional or stereotactic radiosurgery, serves as a supplementary or alternative treatment approach to reduce tumor dimensions and mitigate ACTH production [5,6]. To assess the effectiveness of treatment, manage any problem, and assure long-term illness remission, diligent long-term follow-up and monitoring are essential. Collaborative multidisciplinary care involving specialists such as endocrinologists, neurosurgeons, and other healthcare professionals is pivotal in optimizing patient outcomes and enhancing overall quality of life [2,4].

The prognosis of CS largely depends on the underlying cause, stage of the disease, and efficacy of treatment. Early recognition and prompt intervention are essential for improving outcomes and minimizing long-term complications. Surgical resection of the adrenal or pituitary tumor can lead to remission of CS in the majority of cases. However, recurrence rates vary depending on factors such as tumor size, invasiveness, and completeness of resection [2,3]. Long-term follow-up with endocrinologists is crucial for monitoring disease recurrence, assessing hormonal function, and managing comorbidities associated with CS.

Conclusions

In conclusion, our case report highlights the rarity of severe hypokalemia as the initial presentation of CS. This unique presentation underscores the diverse clinical manifestations of CS and emphasizes the diagnostic challenges encountered in clinical practice. A multidisciplinary approach involving endocrinologists, neurosurgeons, and radiologists is essential for the timely diagnosis and management of CS. Early recognition, prompt intervention, and long-term follow-up are essential for optimizing outcomes and improving the quality of life for patients with this endocrine disorder.

References

  1. Nieman LK, Biller BM, Findling JW, Newell-Price J, Savage MO, Stewart PM, Montori VM: The diagnosis of Cushing’s syndrome: an Endocrine Society Clinical Practice Guideline. J Clin Endocrinol Metab. 2008, 93:1526-40. 10.1210/jc.2008-0125
  2. Newell-Price J, Bertagna X, Grossman AB, Nieman LK: Cushing’s syndrome. Lancet. 2006, 367:1605-17. 10.1016/S0140-6736(06)68699-6
  3. Torpy DJ, Mullen N, Ilias I, Nieman LK: Association of hypertension and hypokalemia with Cushing’s syndrome caused by ectopic ACTH secretion: a series of 58 cases. Ann N Y Acad Sci. 2002, 970:134-44. 10.1111/j.1749-6632.2002.tb04419.x
  4. Elias C, Oliveira D, Silva MM, Lourenço P: Cushing’s syndrome behind hypokalemia and severe infection: a case report. Cureus. 2022, 14:e32486. 10.7759/cureus.32486
  5. Fleseriu M, Petersenn S: Medical therapy for Cushing’s disease: adrenal steroidogenesis inhibitors and glucocorticoid receptor blockers. Pituitary. 2015, 18:245-52. 10.1007/s11102-014-0627-0
  6. Pivonello R, De Leo M, Cozzolino A, Colao A: The treatment of Cushing’s disease. Endocr Rev. 2015, 36:385-486. 10.1210/er.2013-1048

From Knee Pain Consultation to Pituitary Surgery: The Challenge of Cushing Disease Diagnosis

Abstract

Cushing syndrome (CS) is a rare endocrinological disorder resulting from chronic exposure to excessive cortisol. The term Cushing disease is used specifically when this is caused by excessive secretion of adrenocorticotropic hormone (ACTH) by a pituitary tumor, usually an adenoma. This disease is associated with a poor prognosis, and if left untreated, it has an estimated 5-year survival rate of 50%. We present the case of a 66-year-old female patient who received a referral to endocrinology for an evaluation of obesity due to right knee arthropathy. Taking into consideration her age, she was screened for osteoporosis, with results that showed diminished bone density. Considering this, combined with other clinical features of the patient, suspicion turned toward hypercortisolism. Laboratory findings suggested that the CS was ACTH-dependent and originated in the pituitary gland. After a second look at the magnetic resonance imaging results, a 4-mm lesion was identified on the pituitary gland, prompting a transsphenoidal resection of the pituitary adenoma.

Introduction

Chronic excessive exposure to glucocorticoids leads to the diverse clinical manifestations of Cushing syndrome (CS), which has an annual incidence ranging from 1.8 to 3.2 cases per million individuals [1]. The syndrome’s signs and symptoms are not pathognomonic, and some of its primary manifestations, such as obesity, hypertension, and glucose metabolism alterations, are prevalent in the general population [2], making diagnosis challenging. Endogenous CS falls into 2 categories: adrenocorticotropic hormone (ACTH)-dependent (80%-85% of cases), mostly due to a pituitary adenoma, or ACTH-independent (15%-20% of cases), typically caused by adrenal adenomas or hyperplasia [3]. Cushing disease (CD) represents a specific form of CS, characterized by the presence of an ACTH-secreting pituitary tumor [1]. Untreated CD is associated with high morbidity and mortality compared to the general population [1], with a 50% survival rate at 5 years [2]. However, surgical removal of a pituitary adenoma can result in complete remission, with mortality rates similar to those of the general population [2]. This article aims to highlight the challenges of suspecting and diagnosing CD and to discuss the current management options for this rare condition.

Case Presentation

A 66-year-old woman received a referral to endocrinology for an evaluation of obesity due to right knee arthropathy. During physical examination, she exhibited a body mass index of 34.3 kg/m2, blood pressure of 180/100, a history of non-insulin-requiring type 2 diabetes mellitus with glycated hemoglobin (HbA1c) of 6.9% (nondiabetic: < 5.7%; prediabetic: 5.7% to 6.4%; diabetic: ≥ 6.5%) and hypertension. Additionally, the patient complained of proximal weakness in all 4 limbs.

Diagnostic Assessment

Upon admission, densitometry revealed osteoporosis with T scores of −2.7 in the lumbar spine and −2.8 in the femoral neck. Hypercortisolism was suspected due to concomitant arterial hypertension, central obesity, muscle weakness, and osteoporosis. Physical examination did not reveal characteristic signs of hypercortisolism, such as skin bruises, flushing, or reddish-purple striae. Late-night salivary cortisol (LNSC) screening yielded a value of 8.98 nmol/L (0.3255 mcg/dL) (reference value [RV] 0.8-2.7 nmol/L [0.029-0.101 mcg/dL]) and ACTH of 38.1 pg/mL (8.4 pmol/L) (RV 2-11 pmol/L [9-52 pg/mL]). A low-dose dexamethasone suppression test (LDDST) was performed (cutoff value 1.8 mcg/dL [49 nmol/L]), with cortisol levels of 7.98 mcg/dL (220 nmol/L) at 24 hours and 20.31 mcg/dL (560 nmol/L) at 48 hours. Subsequently, a high-dose dexamethasone suppression test (HDDST) was conducted using a dose of 2 mg every 6 hours for 2 days, for a total dose of 16 mg, revealing cortisol levels of 0.0220 nmol/L (0.08 ng/mL) at 24 hours and 0.0560 nmol/L (0.0203 ng/mL) at 48 hours, alongside 24-hour urine cortisol of 0.8745 nmol/L (0.317 ng/mL) (RV 30-145 nmol/24 hours [approximately 11-53 μg/24 hours]) [4].

These findings indicated the presence of endogenous ACTH-dependent hypercortisolism of pituitary origin. Consequently, magnetic resonance imaging (MRI) was requested, but the results showed no abnormalities. Considering ectopic ACTH production often occurs in the lung, a high-resolution chest computed tomography scan was performed, revealing no lesions.

Treatment

Upon reassessment, the MRI revealed a 4-mm adenoma, prompting the decision to proceed with transsphenoidal resection of the pituitary adenoma.

Outcome and Follow-Up

The histological analysis revealed positive staining for CAM5.2, chromogranin, synaptophysin, and ACTH, with Ki67 staining at 1%. At the 1-month follow-up assessment, ACTH levels were 3.8 pmol/L (17.2 pg/mL) and morning cortisol was 115.8621 nmol/L (4.2 mcg/dL) (RV 5-25 mcg/dL or 140-690 nmol/L). Somatomedin C was measured at 85 ng/mL (RV 70-267 ng/mL) and prolactin at 3.5 ng/mL (RV 4-25 ng/mL). At the 1-year follow-up, the patient exhibited a satisfactory postoperative recovery. However, she developed diabetes insipidus and secondary hypothyroidism. Arterial hypertension persisted. Recent laboratory results indicated a glycated hemoglobin (HbA1c) level of 5.4%. Medications at the time of follow-up included prednisolone 5 milligrams a day, desmopressin 60 to 120 micrograms every 12 hours, losartan potassium 50 milligrams every 12 hours, and levothyroxine 88 micrograms a day.

Discussion

CD is associated with high mortality, primarily attributable to cardiovascular outcomes and comorbidities such as metabolic and skeletal disorders, infections, and psychiatric disorders [1]. The low incidence of CD in the context of the high prevalence of chronic noncommunicable diseases makes early diagnosis a challenge [2]. This case is relevant for reviewing the diagnostic approach process and highlighting the impact of the availability bias, which tends to prioritize more common diagnoses over rare diseases. Despite the absence of typical symptoms, a timely diagnosis was achieved.

Once exogenous CS is ruled out, laboratory testing must focus on detecting endogenous hypercortisolism to prevent misdiagnosis and inappropriate treatment [5]. Screening methods include 24-hour urinary free cortisol (UFC) for total cortisol load, while circadian rhythm and hypothalamic-pituitary-adrenal (HPA) axis function may be evaluated using midnight serum cortisol and LNSC [5]. An early hallmark of endogenous CS is the disruption of physiological circadian cortisol patterns, characterized by a constant cortisol level throughout the day or no significant decrease [2]. Measuring LNSC has proven to be useful in identifying these patients. The LNSC performed on the patient yielded a high result.

To assess HPA axis suppressibility, tests such as the overnight and the standard 2-day LDDST [5] use dexamethasone, a potent synthetic corticosteroid with high glucocorticoid receptor affinity and prolonged action, with minimal interference with cortisol measurement [6]. In a normal HPA axis, cortisol exerts negative feedback, inhibiting the secretion of corticotropin-releasing-hormone (CRH) and ACTH. Exogenous corticosteroids suppress CRH and ACTH secretion, resulting in decreased synthesis and secretion of cortisol. In pathological hypercortisolism, the HPA axis becomes partially or entirely resistant to feedback inhibition by exogenous steroids [56]. The LDDST involves the administration of 0.5 mg of dexamethasone orally every 6 hours for 2 days, with a total dose of 4 mg. A blood sample is drawn 6 hours after the last administered dose [6]. Following the LDDST, the patient did not demonstrate suppression of endogenous corticosteroid production.

After diagnosing CS, the next step in the diagnostic pathway involves categorizing it as ACTH-independent vs ACTH-dependent. ACTH-independent cases exhibit low or undetectable ACTH levels, pointing to adrenal origin. The underlying principle is that excess ACTH production in CD can be partially or completely suppressed by high doses of dexamethasone, a response not observed in ectopic tumors [6]. In this case, the patient presented with an ACTH of 38.1 pg/mL (8.4 pmol/L), indicative of ACTH-dependent CD.

Traditionally, measuring cortisol levels and conducting pituitary imaging are standard practices for diagnosis. Recent advances propose alternative diagnostic methods such as positron emission tomography (PET) scans and corticotropin-releasing factor (CRF) tests [7]. PET scans, utilizing radioactive tracers, offer a view of metabolic activity in the adrenal glands and pituitary region, aiding in the identification of abnormalities associated with CD. Unfortunately, the availability of the aforementioned tests in the country is limited.

Once ACTH-dependent hypercortisolism is confirmed, identifying the source becomes crucial. A HDDST is instrumental in distinguishing between a pituitary and an ectopic source of ACTH overproduction [26]. The HDDST involves administering 8 mg of dexamethasone either overnight or as a 2-day test. In this case, the patient received 2 mg of dexamethasone orally every 6 hours for 2 days, totaling a dose of 16 mg. Simultaneously, a urine sample for UFC is collected during dexamethasone administration. The HDDST suppressed endogenous cortisol production in the patient, suggesting a pituitary origin.

In ACTH-dependent hypercortisolism, CD is the predominant cause, followed by ectopic ACTH syndrome and, less frequently, an ectopic CRH-secreting tumor [35]. With the pretest probability for pituitary origin exceeding 80%, the next diagnostic step is typically an MRI of the pituitary region. However, the visualization of microadenomas on MRI ranges from 50% to 70%, requiring further testing if results are negative or inconclusive [5]. Initial testing of our patient revealed no pituitary lesions. Following a pituitary location, ACTH-secreting tumors may be found in the lungs. Thus, a high-resolution chest computed tomography scan was performed, which yielded negative findings. Healthcare professionals must keep these detection rates in mind. In instances of high clinical suspicion, repeating or reassessing tests and imaging may be warranted [3], as in our case, ultimately leading to the discovery of a 4-mm pituitary adenoma.

It is fundamental to mention that the Endocrine Society Clinical Practice Guideline on Treatment of CS recommends that, when possible, all patients presenting with ACTH-dependent CS and lacking an evident causal neoplasm should be directed to an experienced center capable of conducting inferior petrosal sinus sampling to differentiate between pituitary and nonpituitary or ectopic cause [8]. However, in this instance, such a referral was regrettably hindered by logistical constraints.

Regarding patient outcomes and monitoring in CD, there is no consensus on defining remission criteria following tumor resection. Prolonged hypercortisolism results in suppression of corticotropes, resulting in low levels of ACTH and cortisol after surgical intervention. Typically, remission is identified by morning serum cortisol values below 5 µg/dL (138 nmol/L) or UFC levels between 28 and 56 nmol/d (10-20 µg/d) within 7 days after surgical intervention. In our case, the patient’s morning serum cortisol was 115.8621 nmol/L (4.2 µg/dL), indicating remission. Remission rates in adults are reported at 73% to 76% in selectively resected microadenomas and at 43% in macroadenomas [8], highlighting the need for regular follow-up visits to detect recurrence.

Following the surgery, the patient experienced diabetes insipidus, a relatively common postoperative occurrence, albeit usually transient [8]. It is recommended to monitor serum sodium levels during the first 5 to 14 days postsurgery for early detection and management. Additionally, pituitary deficiencies may manifest following surgery. In this patient, prolactin levels were compromised, potentially impacting sexual response. However, postoperative somatomedin levels were normal, and gonadotropins were not measured due to the patient’s age group, as no additional clinical decisions were anticipated based on those results. Secondary hypothyroidism was diagnosed postoperatively.

Moving forward, it is important to emphasize certain clinical signs and symptoms for diagnosing CD. The combination of low bone mineral density (Likelihood Ratio [LR] +21.33), central obesity (LR +3.10), and arterial hypertension (LR + 2.29) [9] has a higher positive LR than some symptoms considered “characteristic,” such as reddish-purple striae, plethora, proximal muscle weakness, and unexplained bruising [210]. It is essential to give relevance to the signs the patient may present, emphasizing signs that have been proven to have an increased odds ratio (OR) such as osteoporosis (OR 3.8), myopathies (OR 6.0), metabolic syndrome (OR 2.7) and adrenal adenoma (OR 2.4) [9‐11]. The simultaneous development and worsening of these conditions should raise suspicion for underlying issues. Understanding the evolving nature of CD signs highlights the importance of vigilance during medical examinations, prioritizing the diagnostic focus, and enabling prompt initiation of treatment.

Recognizing the overlap of certain clinical features in CS is fundamental to achieving a timely diagnosis.

Learning Points

  • CS diagnosis is challenging due to the absence of pathognomonic signs and symptoms and the overlap of features present in many pathologies, such as metabolic syndrome.
  • Early detection of CS is crucial, given its association with high morbidity and mortality resulting from chronic exposure to glucocorticoids.
  • Recognizing the combination of low bone mineral density, obesity, hypertension, and diabetes as valuable clinical indicators is key in identifying CS.
  • Interdisciplinary collaboration is essential to achieve a comprehensive diagnostic approach.

Acknowledgments

We extend our gratitude to Pontificia Universidad Javeriana in Bogotá for providing essential resources and facilities that contributed to the successful completion of this case report. Special acknowledgment is reserved for the anonymous reviewers, whose insightful feedback significantly enhanced the quality of this manuscript during the peer-review process. Their contributions are sincerely appreciated.

Contributors

All authors made individual contributions to authorship. A.B.O. was involved in the diagnosis and management of this patient. M.A.G., J.M.H., and A.B.O. were involved in manuscript drafting and editing. All authors reviewed and approved the final draft.

Funding

This research received no public or commercial funding.

Disclosures

The authors declare that they have no conflicts of interest related to the current study.

Informed Patient Consent for Publication

Signed informed consent could not be obtained from the patient or a proxy but has been approved by the treating institution.

Data Availability Statement

Restrictions apply to the availability of some or all data generated or analyzed during this study to preserve patient confidentiality or because they were used under license. The corresponding author will on request detail the restrictions and any conditions under which access to some data may be provided.

References

1

Hakami
OA

,

Ahmed
S

,

Karavitaki
N

.

Epidemiology and mortality of Cushing’s syndrome

.

Best Pract Res Clin Endocrinol Metab

.

2021

;

35

(

1

):

101521

.

2

Nieman
LK

,

Biller
BMK

,

Findling
JW

, et al.

The diagnosis of Cushing’s syndrome: an endocrine society clinical practice guideline

.

J Clin Endocrinol Metab

.

2008

;

93

(

5

):

1526

1540

.

3

Gutiérrez Restrepo
J

,

Latorre Sierra
G

,

Campuzano Maya
G

.

Síndrome de cushing

.

Med Lab

.

2009

;

15

:

411

430

.

4

Petersenn
S

,

Newell-Price
J

,

Findling
JW

, et al.

High variability in baseline urinary free cortisol values in patients with Cushing’s disease

.

Clin Endocrinol (Oxf)

.

2014

;

80

(

2

):

261

269

.

5

Lila
AR

,

Sarathi
V

,

Jagtap
VS

,

Bandgar
T

,

Menon
P

,

Shah
NS

.

Cushing’s syndrome: stepwise approach to diagnosis

.

Indian J Endocrinol Metab

.

2011

;

15

(

Suppl4

):

S317

S321

.

6

Dogra
P

,

Vijayashankar
NP

.

Dexamethasone suppression test. In: StatPearls StatPearls Publishing; 2024

. Accessed January 29, 2024. http://www.ncbi.nlm.nih.gov/books/NBK542317/

7

Müller
OA

,

Dörr
HG

,

Hagen
B

,

Stalla
GK

,

von Werder
K

.

Corticotropin releasing factor (CRF)-stimulation test in normal controls and patients with disturbances of the hypothalamo-pituitary-adrenal axis

.

Klin Wochenschr

.

1982

;

60

(

24

):

1485

1491

.

8

Nieman
LK

,

Biller
BMK

,

Findling
JW

, et al.

Treatment of Cushing’s syndrome: an endocrine society clinical practice guideline

.

J Clin Endocrinol Metab

.

2015

;

100

(

8

):

2807

2831

.

9

Aron
DC

.

Cushing’s syndrome: why is diagnosis so difficult?
Rev Endocr Metab Disord

.

2010

;

11

(

2

):

105

116

.

10

Braun
LT

,

Vogel
F

,

Zopp
S

, et al.

Whom should we screen for cushing syndrome? the Endocrine Society practice guideline recommendations 2008 revisited

.

J Clin Endocrinol Metab

.

2022

;

107

(

9

):

e3723

e3730

.

11

Schneider
HJ

,

Dimopoulou
C

,

Stalla
GK

,

Reincke
M

,

Schopohl
J

.

Discriminatory value of signs and symptoms in Cushing’s syndrome revisited: what has changed in 30 years?
Clin Endocrinol (Oxf)

.

2013

;

78

(

1

):

153

154

.

Abbreviations


  • ACTH

    adrenocorticotropic hormone

  • CD

    Cushing disease

  • CRH

    corticotropin-releasing hormone

  • CS

    Cushing syndrome

  • HDDST

    high-dose dexamethasone suppression test

  • HPA

    hypothalamic-pituitary-adrenal

  • LDDST

    low-dose dexamethasone suppression test

  • LNSC

    late-night salivary cortisol

  • MRI

    magnetic resonance imaging

  • OR

    odds ratio

  • RV

    reference value

  • UFC

    urinary free cortisol

© The Author(s) 2024. Published by Oxford University Press on behalf of the Endocrine Society.
This is an Open Access article distributed under the terms of the Creative Commons Attribution License (https://creativecommons.org/licenses/by/4.0/), which permits unrestricted reuse, distribution, and reproduction in any medium, provided the original work is properly cited.

Obesity-Related Hemodynamic Alterations in Patients with Cushing’s Disease

Abstract

Background: Cushing’s disease (CD) is associated with a specific form of metabolic syndrome that includes visceral obesity, which may affect cardiovascular hemodynamics by stimulating hypercortisolism-related metabolic activity. The purpose of this study was to evaluate the relationship between obesity and the hemodynamic profile of patients with CD.
Methods: This prospective clinical study involved a hemodynamic status assessment of 54 patients newly diagnosed with CD with no significant comorbidities (mean age of 41 years). The assessments included impedance cardiography (ICG) to assess such parameters as stroke index (SI), cardiac index (CI), velocity index (VI), acceleration index (ACI), Heather index (HI), systemic vascular resistance index (SVRI), and total arterial compliance index (TACI) as well as applanation tonometry to assess such parameters as central pulse pressure (CPP) and augmentation index (AI). These assessments were complemented by echocardiography to assess cardiac structure and function.
Results: Compared with CD patients without obesity, individuals with CD and obesity (defined as a body mass index ≥ 30 kg/m2) exhibited significantly lower values of ICG parameters characterizing the pumping function of the heart (VI: 37.0 ± 9.5 vs. 47.2 ± 14.3 × 1*1000−1*s−1, p = 0.006; ACI: 58.7 ± 23.5 vs. 76.0 ± 23.5 × 1/100/s2, p = 0.005; HI: 11.1 ± 3.5 vs. 14.6 ± 5.5 × Ohm/s2, p = 0.01), whereas echocardiography in obese patients showed larger heart chamber sizes and a higher left ventricular mass index. No significant intergroup differences in blood pressure, heart rate, LVEF, GLS, TACI, CPP, or AI were noted.
Conclusions: Hemodynamic changes associated with obesity already occur at an early stage of CD and manifest via significantly lower values of the ICG parameters illustrating the heart’s function as a pump, despite the normal function of the left ventricle in echocardiography.

Graphical Abstract

1. Introduction

Cushing’s disease (CD), caused by a pituitary neuroendocrine tumor, leads to a specific type of metabolic syndrome that includes hypertension, obesity, impaired glucose metabolism, and dyslipidemia [1,2,3]. Chronic hypercortisolemia in patients with CD results in the excessive accumulation of visceral fat due to abnormal adipokine production [4]. Visceral obesity plays an important role in hypercortisolism-induced metabolic abnormalities and increased activity of the renin–angiotensin–aldosterone system activity in patients with CD [1,2,3,4,5]. Visceral obesity in patients with CD not only contributes to metabolic syndrome, but it is also an independent risk factor for cardiovascular disease [1,3,6,7]. Importantly, the structure and function of adipose tissue in patients with CD differ from those of healthy individuals [1,8,9]. The various hypercortisolism-induced metabolic abnormalities occurring in obese patients with CD may affect cardiovascular hemodynamics. There are no data on the effect of obesity on the hemodynamic profile of patients with CD and also few data are known on the association between obesity and hemodynamic disturbances in people without CD [10,11]. It was shown that the hemodynamic profile of a person with obesity is characterized by increased cardiac output and thoracic fluid content and decreased vascular resistance in comparison with these parameters in healthy individuals [12].
More studies are needed to enhance our understanding of the pathophysiology of CD-related obesity as a modifiable cardiovascular risk factor, in order to develop effective preventive and therapeutic strategies. Unfortunately, subclinical consequences of hypercortisolism in newly diagnosed patients with early CD, particularly with comorbid obesity, may be undetectable with standard methods. Therefore, novel and easy-to-use diagnostic methods would be of additive value to the standard methods of assessing cardiovascular structure and function in patients with CD. A detailed evaluation of the nature of obesity in patients with CD by innovative noninvasive diagnostic methods, such as impedance cardiography (ICG), applanation tonometry (AT), and echocardiographic assessment of global longitudinal strain (GLS), may provide additional data on cardiovascular hemodynamics, particularly the heart’s pumping function, preload, and afterload [13,14,15,16,17,18]. Our previous studies demonstrated the usefulness of ICG in identifying subclinical cardiovascular complications in patients with CD [19,20].
The purpose of this analysis was to assess the relationship between obesity and the hemodynamic profile of patients newly diagnosed with CD with no significant comorbidities.

2. Materials and Methods

2.1. Study Population

This was a prospective observational cohort study involving a comprehensive assessment of 54 patients (mean age of 41 years) newly diagnosed with CD with no significant comorbidities (although 64.8% were diagnosed with hypertension). These patients were admitted to the Military Institute of Medicine—National Research Institute between 2016 and 2021 in order to undergo a thorough cardiovascular assessment prior to transsphenoidal pituitary neuroendocrine tumor resection surgery.
This study was approved by the ethics committee at the Military Institute of Medicine—National Research Institute (approval No. 76/WIM/2016) and compliant with the Declaration of Helsinki and Good Clinical Practice guidelines. Each patient received detailed information on the purpose of this study and signed an informed consent form. This study was financed by the Polish Ministry of Research and Higher Education/Military Institute of Medicine—National Research Institute in Warsaw (grant No. 453/WIM).

2.2. Inclusion Criteria

The diagnosis of CD was established based on the presence of the typical (clinical and hormonal) evidence of hypercortisolism with no adrenocorticotropic hormone (ACTH) response to corticotropin-releasing hormone (CRH) stimulation, which meets the current guidelines for the diagnosis and treatment of CD [21,22,23]. Physical examination findings consistent with the signs and symptoms of CD, including central obesity with the characteristic altered body fat distribution (a moon face and a short, thick neck); muscle atrophy in the torso and limbs; purplish stretch marks on the abdomen, hips, and thighs; thinned skin; ecchymoses; signs and symptoms of hyperandrogenism; bone pain; frequent infections; erectile dysfunction in men; and secondary amenorrhea and infertility in women. Hormone test results included elevated 24 h urinary free cortisol levels, increased morning serum cortisol levels, altered circadian rhythmicity of ACTH and cortisol secretion, elevated or detectable morning serum ACTH, and a lack of overnight serum cortisol suppression to <1.8 mg/dL during a low-dose dexamethasone suppression test (1 mg or 2 mg of dexamethasone administered at midnight). In order to ensure a pituitary etiology of CD, all patients underwent a two-day high-dose (2 mg every 6 h = a total of 8 mg) dexamethasone suppression test (HDDST), which was expected to show low serum cortisol or a >50% decrease in urinary-free cortisol levels. Moreover, each patient was shown to have no ACTH secretion response to a CRH stimulation test (with 100 μg intravenous CRH), and the presence of a pituitary neuroendocrine tumor was confirmed via contrast magnetic resonance imaging of the pituitary. Patients with inconclusive hormone tests or imaging studies additionally underwent bilateral inferior petrosal sinus sampling (used to determine ACTH levels in the venous blood before and after CRH stimulation) [21,22,23].

2.3. Exclusion Criteria

The following comorbidities, which might considerably affect hemodynamic profiles, constituted our study exclusion criteria: (1) heart failure with mildly reduced or reduced left ventricular ejection fraction (LVEF) (i.e., LVEF of <50%); (2) cardiomyopathy; (3) clinically significant valvular heart disease or arrhythmia; (4) coronary artery disease, including a history of acute coronary syndrome; (5) a poor acoustic window on echocardiography; (6) a history of pulmonary embolism; (7) a history of a stroke or transient ischemic attack; (8) renal failure (estimated glomerular filtration rate < 60 mL/min/1.73 m2); (9) peripheral vascular disease and polyneuropathy; (10) chronic obstructive pulmonary disease; (11) respiratory failure (decreased partial pressure of arterial oxygen [PaO2] < 60 mmHg and/or increased partial pressure of carbon dioxide [PaCO2] > 45 mmHg); (12) a history of head trauma; (13) pregnancy; (14) age < 18 years; (15) no written informed consent.

2.4. Additional Hormone Tests

Due to the fact that hypercortisolemia inhibits gonadotropin release, hormone testing was expanded to include follicle-stimulating hormone and luteinizing hormone levels. The patients also had their serum thyroid-stimulating hormone levels tested to determine possible hypothyroidism, associated with reduced CRH and thyroid-stimulating hormone secretion and hypercortisolism-induced alterations in thyroid function. The patients with CD included in this study were not receiving any medications affecting the hypothalamus–pituitary–adrenal axis. None of the female patients with CD were pregnant at the time of the study or had given birth within the previous five years.

2.5. Laboratory Tests

In order to detect possible metabolic conditions, such as impaired fasting glucose, type 2 diabetes mellitus, or dyslipidemia, all patients underwent fasting blood tests from venous blood samples collected in the morning (at 6:00 a.m.). The tests evaluated the levels of fasting glucose, creatinine, eGFR, total cholesterol, low-density lipoprotein cholesterol, high-density lipoprotein cholesterol, and triglycerides, as well as a complete blood count.

2.6. Anamnesis and Physical Examination

The patients were thoroughly evaluated for cardiovascular risk factors, cardiovascular signs and symptoms, a family history of cardiovascular disease, comorbidities, prescription medications and other drugs, and smoking.
The body mass index (BMI) was calculated, and obesity was determined based on the International Diabetes Federation and European Society of Cardiology guidelines, which define it as a BMI of ≥30 kg/m2 [24,25]. In the study, patients were divided into two groups: patients with CD and obesity (defined as high body mass index ≥ 30 kg/m2) and patients with CD without obesity (defined as normal BMI < 30 kg/m2).
Physical examination included the resting heart rate (HR), systolic and diastolic blood pressure, and anthropometric parameters.
Office blood pressure measurements were taken by a trained nurse in seated patients in the morning, after a 5 min rest. The blood pressure monitor used was Omron M4 Plus (Omron Healthcare Co. Ltd., Kyoto, Japan), which meets the European Society of Cardiology criteria [26].

2.7. Echocardiography

Two-dimensional echocardiography included standard parasternal, apical, and subcostal views with a 2.5 MHz transducer (VIVID E95, GE Medical System, Wauwatosa, WI, USA) in accordance with the American Society of Echocardiography (ASE) and the European Association of Cardiovascular Imaging (EACVI) guidelines [27]. The parasternal long-axis view was used to measure the left ventricular end-diastolic diameter (LVEDd), right ventricular end-diastolic diameter (RVEDd), interventricular septal thickness, and left atrial (LA) diameter. Linear 2-dimensional left ventricular measurements were used to calculate the left ventricular mass index (LVMI), which is the left ventricular mass divided by the body surface area (LVMI cut-off values of >115 g/m2 for men and >95 g/m2 for women meet ASE and EACVI criteria for the diagnosis of left ventricular hypertrophy). The LVEF was calculated with the biplane Simpson method, based on 2-dimensional views of the left ventricle during systole and diastole in four- and two-chamber apical views. The ascending aortic diameter, valvular structure and function, and pericardium were assessed. The patients were assessed for left ventricular diastolic dysfunction according to current guidelines. Pulse wave Doppler in an apical four-chamber view aligned with mitral valve tips was used to visualize mitral inflow, including the early passive blood inflow (E) and the later atrial (A) contribution to the mitral inflow, E/A ratio, and early mitral inflow deceleration time. Apical four-chamber views were used to determine the septal and lateral early diastolic mitral annular velocities (e′ avg), and the E/e′ avg ratio was calculated [27,28].
Global longitudinal strain (GLS) was assessed via electrocardiography-gated automated function imaging in two-, three-, and four-chamber views. The rates of >60 frames per second were used for optimal speckle-tracking strain assessment. Patients with a poor acoustic window were excluded from the study. Semiautomated endocardial border detection was initiated by manually selecting two points identifying the mitral annulus and one point at the apex. Segmental and whole-chamber strain was assessed. The results have been presented in the form of a “bull’s eye” graph. The data were analyzed for four-, three-, and two-chamber views, and average GLS was calculated [29].

2.8. Impedance Cardiography

Based on the phenomenon of impedance variability in individual body segments associated with regional arterial blood flow, ICG is a noninvasive tool for assessing cardiovascular hemodynamics. ICG assessments were conducted by a trained nurse with a Niccomo device (Medis, Ilmenau, Germany) in patients who had been resting for 10 min in a supine position. ICG data were recorded during a 10 min assessment and processed with dedicated software (Niccomo Software, Medis). We analyzed the mean values of the following hemodynamic parameters reflecting the pumping function of the heart: (1) stroke volume (SV [mL]) and stroke index (SI [mL/m2]), based on the following formula: SV = VEPT × (dZmax/Z0) × LVET, where VEPT is tissue volume calculated from body weight, height, and patient sex, Z0 is the initial thoracic impedance, dZmax is the maximum change in thoracic impedance, and LVET is the left ventricular ejection time; (2) cardiac output (CO [mL] = SV × HR), and cardiac index (CI [mL*m−2*min−1]); (3) velocity index (VI [1*1000−1*s−1]); (4) acceleration index (ACI [1/100/s2], which is the peak acceleration of blood flow in the aorta; and (5) Heather index (HI [Ohm/s2] = dZmax × TRC, where TRC the time interval between the R-peak in the electrocardiogram and the C-point on the impedance wave). We also conducted a detailed analysis of the following afterload parameters: (1) systemic vascular resistance (SVR [dyn*s*cm−5]) together with SVR index (SVRI [dyn*s*cm−5*m2]) and (2) total arterial compliance (TAC) and TAC index (TACI [mL/mmHg] = SV/pulse pressure [mL/mmHg*m2]). Preload was assessed based on thoracic fluid content (TFC [1/kOhm], based on the formula TFC = 1000/Z0, where Z0 is the initial thoracic impedance [30,31,32].

2.9. Applanation Tonometry

Applanation tonometry is a novel method of indirectly illustrating arterial pressure waveform in the aorta and arterial stiffness, which reflect left ventricular afterload. AT parameters were assessed noninvasively with a SphygmoCor system (AtCor Medical, Sydney, NSW, Australia). The measurements were taken in supine patients by a qualified nurse immediately after ICG. Radial artery pressure curves were recorded via AT with a micromanometer (Millar Instruments, Houston, TX, USA) strapped onto the left wrist. We selected high-quality recordings for our analysis. Radial pulse was calibrated against the latest brachial systolic and diastolic blood pressure measurement with an oscillometric module of the Niccomo device. SphygmoCor software (version 9.0; AtCor Medical Inc. Pty Ltd., Sydney, NSW, Australia) was used to process the arterial waveform and generate an appropriate aortic blood pressure curve from the radial pulse curve. The analyzed waveforms were composed of the pulse wave generated by the aorta and were augmented by an overlapping reflected wave. Our analyses yielded the following parameters: central systolic blood pressure; central diastolic blood pressure; central pulse pressure (CPP); augmentation pressure, which is the absolute increase in aortic systolic pressure (directly generated by left ventricular contraction) resulting from the reflection wave; and the augmentation index, calculated as AP × 100/CPP, which is a quotient of the augmentation pressure and the blood pressure in the aorta [33].

2.10. Statistical Analysis

For the statistical analysis of the results, we used MS Office Excel 2023 and Statistica 12.0 (StatSof Inc., Tulsa, OK, USA). Data distribution and normality were assessed visually on histograms and with the use of the Kolmogorov–Smirnov test. Continuous variables were expressed as mean ± standard deviation (SD) or median (interquartile range, IQR), and categorical variables were expressed as absolute and relative (percentage) values. In order to evaluate differences between the subgroups of CD patients with and without comorbid obesity, we used Student’s t-test for normally distributed data, and the Mann–Whitney U test for non-normally distributed data. A comparative analysis with the use of the Mann–Whitney U test was conducted on the data from patients stratified into two subgroups: patients with CD and obesity (BMI ≥ 30 kg/m2, n = 22) and patients with CD without obesity (BMI < 30 kg/m2, n = 32). The relationship between selected indices of cardiovascular function and obesity (represented as BMI) was analyzed separately for each one in a multivariable regression model, adjusting for age and hypertension as potential covariates related to hemodynamics. The threshold of statistical significance was adopted at p < 0.05.

3. Results

3.1. Baseline Characteristics

Nearly half of the patients with CD were found to be obese (n = 22, 40.7%). Overall, 20 of the 54 patients with Cushing’s disease (37%) were diagnosed with type 2 diabetes mellitus, 5 (9.3%) had prediabetes, and 29 (46.3%) had normal glucose tolerance. Of the patients with Cushing’s disease and type 2 diabetes, 14 received metformin, 5 received metformin with insulin, and 1 received insulin.
The mean age, HR, hemoglobin, creatinine, and sex distribution were similar in the subgroup with and without obesity (Table 1).
Table 1. Clinical, echocardiographic, hemodynamic, and applanation tonometry variables in patients with Cushing’s disease (CD) and with or without obesity.

3.2. Echocardiographic Assessment

Patients with CD and obesity (BMI ≥ 30 kg/m2) showed larger dimensions of heart chambers and ascending aorta (RVEDd, p < 0.001; LVEDd, p = 0.028; LA diameter, p < 0.001; aortic arch, p = 0.005) and higher rates of left ventricular mass index (LVMI, p = 0.028). We observed no significant differences between the subgroups in terms of the systolic (LVEF or GLS) or diastolic function of the left ventricle (Table 1).

3.3. ICG and AT Assessment

The most noticeable differences in ICG were observed for parameters of the left ventricular function as a pump. In obese individuals, VI (p = 0.006), ACI (p = 0.005), and HI (p = 0.012) were lower, whereas the systolic time ratio (STR) was higher (p = 0.038) than those in non-obese individuals, with SI and CI comparable in both subgroups. We observed no significant differences in afterload (TACI, SVRI, CPP, or augmentation index) or preload (TFC) parameters (Table 1).

3.4. Correlation Analysis

Analyzing the relationships between BMI and ICG hemodynamic parameters, we observed significant correlations, independent of sex and hypertension, between BMI and CI (R = 0.46; p < 0.001), SI (R = 0.29; p = 0.043), SVRI (−0.31; 0.028), and VI (R = −0.37; p = 0.0006)—see Table 2.
Table 2. Correlations between hemodynamic parameters assessed with impedance cardiography and body mass index, adjusted for sex and hypertension in multivariable regression models.

4. Discussion

The results of our study revealed a relationship between obesity and hemodynamic profile assessed via ICG in patients newly diagnosed with active CD. The use of novel diagnostic modalities demonstrated that excessive fat accumulation in young and middle-aged patients with CD, already at the early stages of the disease, is associated with some hemodynamic changes in the cardiovascular system, which—at that stage—may still be undetectable in routine assessments. These findings support the need for the early detection of subclinical heart dysfunction in patients with CD to enable early treatment and help prevent cardiovascular complications [1,34,35,36].
Occurring in 25%–100% of patients with CD, visceral obesity is one of the most common components of metabolic syndrome, often being the first sign of the disease. The duration of hypercortisolism correlates with obesity development [1,7,37,38], with chronic excessive cortisol levels being responsible for the abnormal distribution of adipose tissue [39]. The mechanisms behind this phenomenon may be due to the tissue overexpression of the 11β-hydroxysteroid dehydrogenase type 1 (11β-HSD1), which affects the pattern of excessive fat distribution in the torso, face, and neck [1,6]. Visceral obesity found in patients with CD is not only a component of metabolic syndrome but is in itself associated with increased metabolic activity, which makes it an independent cardiovascular risk factor, leading to the development of cardiovascular disease [1,4,9]. The tendency to accumulate visceral fat in patients with CD is also associated with abnormal adipokine production [4,6,40,41].
Our study included patients newly diagnosed with active CD with no clinically significant cardiovascular disease. Males were underrepresented in both subgroups. The proportion of patients with hypertension was 64.8%, which is comparable with that reported by other authors [38,42,43,44] and similarly distributed between subgroups. However, the patients in our study presented well-controlled hypertension (mean blood pressure was 126/83 mmHg), usually with one or two medications. Considering both sex and hypertension as potential confounders, these variables were included in regression models evaluating correlations between hemodynamics and BMI.
Similar to reports by other authors, our study showed higher SV and CO values in obese patients with CD; however, the respective indexed values (SI and CI) were comparable in obese and non-obese patients [12,45]. A more detailed ICG assessment demonstrated significant impairment of the pumping function of the heart as evidenced by lower HI, VI, and ACI values, and a higher STR value. The analysis of correlations revealed the independence of age and sex interrelation between some hemodynamic indices (CI, SI, SVRI, VI) and BMI. The paradox of the positive relation of obesity with volume indices of left ventricular function (CI and SI), which is negative with the marker of both its outflow and myocardial contractility (VI) encourages further studies investigating the (patho)physiological background of this phenomenon.
These findings were detected despite the lack of echocardiographic evidence of left ventricular systolic or diastolic dysfunction.
Moreover, our study showed larger heart chamber diameters and significantly higher LVMI in patients with CD and obesity, which is consistent with numerous earlier reports by other authors [46,47,48]. Nonetheless, it seems that in this case, increased heart chamber size and left ventricular hypertrophy should not be considered as only secondary to an increase in body weight. Hypercortisolism in patients with CD worsens the structural and functional condition of the heart muscle and may lead to myocardial fibrosis [48]. This results in myocardial remodeling associated with concentric left ventricular hypertrophy, which may impair left ventricular hemodynamic function, subsequently leading to myocardial dysfunction and symptomatic heart failure [49,50,51]. The effective treatment of patients with CD has been shown to normalize their serum cortisol levels and ultimately stop myocardial remodeling [47]. Therefore, the ICG-evidenced impaired pumping function of the heart may result from myocardial remodeling associated with complex metabolic and neuroendocrine changes in obese patients with CD [52]. These findings are consistent with previous reports on the adverse effect of obesity on left ventricular contractility [53,54,55,56].
The potential mechanisms underlying the results of our study remain to be elucidated. An interesting perspective is represented by the cross-talk between glucocorticoid (GR) and mineralocorticoid receptors (MR) and their impact on metabolic syndrome. Excessive activation of the MR in extra-renal tissues by aldosterone or glucocorticoids depending on the expression of 11beta-hydroxysteroid dehydrogenase type 2 has been shown to be associated with the development of vascular dysfunction and metabolic abnormalities, leading to obesity and metabolic syndrome. High concentrations of aldosterone may also activate the transcriptional function of the GR. These mechanisms result in an interaction between GR and MR in the regulation of adipogenesis [57].
The novelty of our approach is due to the use of noninvasive tools (ICG, AT) for hemodynamic assessment of the cardiovascular system in patients with CD to detect subclinical changes associated with obesity. On the one hand, our findings support earlier observations in other patient groups; on the other hand, they cast a new light on the relationship between obesity and an impaired hemodynamic profile in CD, which may result in the early development of cardiovascular complications.

4.1. Clinical Implications

We determined that a dysfunctional pumping action of the heart is the key marker of impaired cardiovascular hemodynamics in obese patients newly diagnosed with CD. The use of noninvasive diagnostic methods in this study revealed a complex relationship between obesity-related hemodynamic changes and the efficiency of left ventricular contractions. An early assessment of a patient’s hemodynamic profile may help detect subclinical cardiovascular dysfunction. Such a personalized approach may facilitate early therapeutic intervention and monitoring of treatment effectiveness focused on preventing myocardial remodeling and heart dysfunction.

4.2. Limitations

One limitation of our study was the small sample size. This was a result of the relatively low incidence of pituitary neuroendocrine tumors secreting ACTH. The exclusion of patients with clinically significant comorbidities further diminished the study population. However, this helped to eliminate the effect of additional factors on hemodynamic profiles. The patients assessed in our study were mostly young and middle-aged individuals with CD; therefore, our conclusions should not be extrapolated to older subjects. Although we conducted neither cardiac stress tests nor coronary angiography to exclude asymptomatic ischemic heart disease, other thorough assessments showed no physical, electrocardiographic, or echocardiographic evidence suggesting myocardial ischemia. Another potential limitation of our study is the fact that some patients had hypertension; however, it was well controlled with medications. The hemodynamic assessments involved the use of noninvasive methods as an alternative to the more expensive and less readily available invasive techniques. Nonetheless, we acknowledge the fact that noninvasive measurements can only provide indirect measurements and depend on the patient’s condition, which may vary over time.

5. Conclusions

The results of our study support the usefulness of ICG in diagnosing early heart dysfunction associated with obesity in patients with CD. Asymptomatic impairment of the heart’s pumping function seems to be the earliest clinical sign of cardiovascular hemodynamic abnormalities, which at this stage are still undetectable with standard echocardiography. Individual hemodynamic profile assessment with novel noninvasive diagnostic methods encourages further studies on cardiovascular system function in obese individuals with CD and on the use of personalized therapies, which aim at preventing adverse cardiovascular events.

Author Contributions

Conceptualization, A.J. and P.K.; methodology, A.J., P.K., G.G., B.U.-Ż., P.W. and G.Z.; software, P.K.; validation, A.J., P.K., B.U.-Ż., P.W. and G.Z.; formal analysis, P.K., P.W., G.G. and G.Z.; investigation, A.J., P.K., B.U.-Ż., P.W. and G.Z.; resources, A.J., P.K., B.U.-Ż., P.W. and G.Z.; data curation, A.J., P.K., B.U.-Ż., P.W., G.Z., A.K., R.W. and M.B.; writing—original draft preparation, A.J. and P.K.; writing—review and editing, G.G., B.U.-Ż., P.W. and G.Z.; visualization, A.J.; supervision, G.G. and G.Z.; project administration, G.Z.; funding acquisition, G.Z. All authors have read and agreed to the published version of the manuscript.

Funding

This research was funded by the Polish Ministry of Research and Higher Education/Military Institute of Medicine—National Research Institute in Warsaw (grant No. 453/WIM).

Institutional Review Board Statement

The study was conducted in accordance with the Declaration of Helsinki and Good Clinical Practice guidelines and approved by the Bioethics Committee at the Military Institute of Medicine—National Research Institute in Warsaw, Poland (approval No. 76/WIM/2016; 21 December 2016).

Informed Consent Statement

Informed consent was obtained from all subjects involved in the study.

Data Availability Statement

The data presented in this study are available upon request from the corresponding author. The data are not publicly available due to privacy or ethical restrictions.

Acknowledgments

We would like to thank the medical personnel of the Military Institute of Medicine—National Research Institute in Warsaw for the provided patient care.

Conflicts of Interest

The authors declare no conflicts of interest.

References

  1. Pivonello, R.; Isidori, A.M.; De Martino, M.C.; Newell-Price, J.; Biller, B.M.; Colao, A. Complications of Cushing’s syndrome: State of the art. Lancet Diabetes Endocrinol. 2016, 4, 611–629. [Google Scholar] [CrossRef]
  2. Dekkers, O.M.; Horváth-Puhó, E.; Jørgensen, J.O.; Cannegieter, S.C.; Ehrenstein, V.; Vandenbroucke, J.P.; Pereira, A.M.; Sørensen, H.T. Multisystem morbidity and mortality in Cushing’s syndrome: A cohort study. J. Clin. Endocrinol. Metab. 2013, 98, 2277–2284. [Google Scholar] [CrossRef] [PubMed]
  3. Pivonello, R.; Faggiano, A.; Lombardi, G.; Colao, A. The metabolic syndrome and cardiovascular risk in Cushing’s syndrome. Endocrinol. Metab. Clin. N. Am. 2005, 34, 327–339. [Google Scholar] [CrossRef] [PubMed]
  4. Pivonello, R.; De Leo, M.; Vitale, P.; Cozzolino, A.; Simeoli, C.; De Martino, M.C.; Lombardi, G.; Colao, A. Pathophysiology of diabetes mellitus in Cushing’s syndrome. Neuroendocrinology 2010, 1, 77–81. [Google Scholar] [CrossRef]
  5. Davy, K.P.; Hall, J.E. Obesity and hypertension: Two epidemics or one? Am. J. Physiol. Regul. Integr. Comp. Physiol. 2004, 286, R803–R813. [Google Scholar] [CrossRef]
  6. Lee, M.J.; Pramyothin, P.; Karastergiou, K.; Fried, S.K. Deconstructing the roles of glucocorticoids in adipose tissue biology and the development of central obesity. Biochim. Biophys. Acta 2014, 1842, 473–481. [Google Scholar] [CrossRef] [PubMed]
  7. Mancini, T.; Kola, B.; Mantero, F.; Boscaro, M.; Arnaldi, G. High cardiovascular risk in patients with Cushing’s syndrome according to 1999 WHO/ISH guidelines. Clin. Endocrinol. 2004, 61, 768–777. [Google Scholar] [CrossRef]
  8. Bujalska, I.J.; Kumar, S.; Stewart, P.M. Does central obesity reflect “Cushing’s disease of the omentum”? Lancet 1997, 349, 1210–1213. [Google Scholar] [CrossRef]
  9. Galton, D.J.; Wilson, J.P. Lipogenesis in adipose tissue of patients with obesity and Cushing’s disease. Clin. Sci. 1972, 43, 17P. [Google Scholar] [CrossRef]
  10. Koch, R.; Sharma, A.M. Obesity and cardiovascular hemodynamic function. Curr. Hypertens. Rep. 1999, 1, 127–130. [Google Scholar] [CrossRef]
  11. Raison, J. Conséquences cardiovasculaires de l’obésité associée à l’hypertension artérielle [Cardiovascular consequences of obesity associated with arterial hypertension]. Presse Med. 1992, 21, 1522–1525. [Google Scholar]
  12. de Simone, G.; Devereux, R.B.; Kizer, J.R.; Chinali, M.; Bella, J.N.; Oberman, A.; Kitzman, D.W.; Hopkins, P.N.; Rao, D.C.; Arnett, D.K. Body composition and fat distribution influence systemic hemodynamics in the absence of obesity: The HyperGEN Study. Am. J. Clin. Nutr. 2005, 81, 757–761. [Google Scholar] [CrossRef] [PubMed]
  13. Krzesiński, P.; Gielerak, G.; Kowal, J. Kardiografia impedancyjna—Nowoczesne narzedzie terapii monitorowanej chorób układu krazenia [Impedance cardiography—A modern tool for monitoring therapy of cardiovascular diseases]. Kardiol. Pol. 2009, 67, 65–71. (In Polish) [Google Scholar]
  14. El-Dawlatly, A.; Mansour, E.; Al-Shaer, A.A.; Al-Dohayan, A.; Samarkandi, A.; Abdulkarim, A.; Alshehri, H.; Faden, A. Impedance cardiography: Noninvasive assessment of hemodynamics and thoracic fluid content during bariatric surgery. Obes. Surg. 2005, 15, 655–658. [Google Scholar] [CrossRef] [PubMed]
  15. Eikås, J.G.; Gerdts, E.; Halland, H.; Midtbø, H.; Cramariuc, D.; Kringeland, E. Arterial Stiffness in Overweight and Obesity: Association with Sex, Age, and Blood Pressure. High Blood Press Cardiovasc. Prev. 2023, 30, 435–443. [Google Scholar] [CrossRef] [PubMed]
  16. Abomandour, H.G.; Elnagar, A.M.; Aboleineen, M.W.; Shehata, I.E. Subclinical Impairment of Left Ventricular Function assessed by Speckle Tracking in Type 2 Diabetic Obese and Non-Obese Patients: Case Control Study. J. Cardiovasc. Echogr. 2022, 32, 95–106. [Google Scholar] [CrossRef]
  17. Galderisi, M.; Lomoriello, V.S.; Santoro, A.; Esposito, R.; Olibet, M.; Raia, R.; Di Minno, M.N.; Guerra, G.; Mele, D.; Lombardi, G. Differences of myocardial systolic deformation and correlates of diastolic function in competitive rowers and young hypertensives: A speckle-tracking echocardiography study. J. Am. Soc. Echocardiogr. 2010, 23, 1190–1198. [Google Scholar] [CrossRef]
  18. Kalam, K.; Otahal, P.; Marwick, T.H. Prognostic implications of global LV dysfunction: A systematic review and meta-analysis of global longitudinal strain and ejection fraction. Heart 2014, 100, 1673–1680. [Google Scholar] [CrossRef]
  19. Jurek, A.; Krzesiński, P.; Gielerak, G.; Witek, P.; Zieliński, G.; Kazimierczak, A.; Wierzbowski, R.; Banak, M.; Uziębło-Życzkowska, B. Cushing’s Disease: Assessment of Early Cardiovascular Hemodynamic Dysfunction With Impedance Cardiography. Front. Endocrinol. 2021, 12, 751743. [Google Scholar] [CrossRef]
  20. Jurek, A.; Krzesiński, P.; Uziębło-Życzkowska, B.; Witek, P.; Zieliński, G.; Kazimierczak, A.; Wierzbowski, R.; Banak, M.; Gielerak, G. The patient’s sex determines the hemodynamic profile in patients with Cushing disease. Front. Endocrinol. 2023, 14, 1270455. [Google Scholar] [CrossRef]
  21. Fleseriu, M.; Auchus, R.; Bancos, I.; Ben-Shlomo, A.; Bertherat, J.; Biermasz, N.R.; Boguszewski, C.L.; Bronstein, M.D.; Buchfelder, M.; Carmichael, J.D.; et al. Consensus on diagnosis and management of Cushing’s disease: A guideline update. Lancet Diabetes Endocrinol. 2021, 9, 847–875. [Google Scholar] [CrossRef] [PubMed]
  22. Nieman, L.K.; Biller, B.M.; Findling, J.W.; Newell-Price, J.; Savage, M.O.; Stewart, P.M.; Montori, V.M. The diagnosis of Cushing’s syndrome: An Endocrine Society Clinical Practice Guideline. J. Clin. Endocrinol. Metab. 2008, 93, 1526–1540. [Google Scholar] [CrossRef]
  23. Ceccato, F.; Boscaro, M. Cushing’s syndrome: Screening and diagnosis. High. Blood Press. Cardiovasc. Prev. 2016, 23, 209–215. [Google Scholar] [CrossRef]
  24. Alberti, K.G.; Eckel, R.H.; Grundy, S.M.; Zimmet, P.Z.; Cleeman, J.I.; Donato, K.A.; Fruchart, J.C.; James, W.P.; Loria, C.M.; Smith, S.C., Jr.; et al. Harmonizing the metabolic syndrome: A joint interim statement of the International Diabetes Federation Task Force on Epidemiology and Prevention; National Heart, Lung, and Blood Institute; American Heart Association; World Heart Federation; International Atherosclerosis Society; and International Association for the Study of Obesity. Circulation 2009, 120, 1640–1645. [Google Scholar] [CrossRef]
  25. Visseren, F.L.J.; Mach, F.; Smulders, Y.M.; Carballo, D.; Koskinas, K.C.; Bäck, M.; Benetos, A.; Biffi, A.; Boavida, J.M.; Capodanno, D.; et al. 2021 ESC Guidelines on cardiovascular disease prevention in clinical practice. Eur. Heart J. 2021, 42, 3227–3337. [Google Scholar] [CrossRef] [PubMed]
  26. Williams, B.; Mancia, G.; Spiering, W.; Agabiti Rosei, E.; Azizi, M.; Burnier, M.; Clement, D.L.; Coca, A.; de Simone, G.; Dominiczak, A.; et al. 2018 ESC/ESH Guidelines for the management of arterial hypertension. Eur. Heart J. 2018, 39, 3021–3104. [Google Scholar] [CrossRef]
  27. Lang, R.M.; Badano, L.P.; Mor-Avi, V.; Afilalo, J.; Armstrong, A.; Ernande, L.; Flachskampf, F.A.; Foster, E.; Goldstein, S.A.; Kuznetsova, T.; et al. Recommendations for cardiac chamber quantification by echocardiography in adults: An update from the American Society of Echocardiography and the European Association of Cardiovascular Imaging. J. Am. Soc. Echocardiogr. 2015, 28, 1–39.e14. [Google Scholar] [CrossRef]
  28. Nagueh, S.F.; Smiseth, O.A.; Appleton, C.P.; Byrd, B.F.; Dokainish, H.; Edvardsen, T.; Flachskampf, F.A.; Gillebert, T.C.; Klein, A.L.; Lancellotti, P.; et al. Recommendations for the evaluation of left ventricular diastolic function by echocardiography: An update from the American Society of Echocardiography and the European Association of Cardiovascular Imaging. J. Am. Soc. Echocardiogr. 2016, 29, 277–314. [Google Scholar] [CrossRef]
  29. Voigt, J.U.; Pedrizzetti, G.; Lysyansky, P.; Marwick, T.H.; Houle, H.; Baumann, R.; Pedri, S.; Ito, Y.; Abe, Y.; Metz, S.; et al. Definitions for a common standard for 2D speckle tracking echocardiography: Consensus document of the EACVI/ASE/Industry Task Force to standardize deformation imaging. J. Am. Soc. Echocardiogr. 2015, 28, 183–193. [Google Scholar] [CrossRef] [PubMed]
  30. Bhalla, V.; Isakson, S.; Bhalla, M.A.; Lin, J.P.; Clopton, P.; Gardetto, N.; Maisel, A.S. Diagnostic Ability of B-Type Natriuretic Peptide and Impedance Cardiography: Testing to Identify Left Ventricular Dysfunction in Hypertensive Patients. Am. J. Hypertens. 2005, 18, 73S–81S. [Google Scholar] [CrossRef]
  31. Parrott, C.W.; Burnham, K.M.; Quale, C.; Lewis, D.L. Comparison of Changes in Ejection Fraction to Changes in Impedance Cardiography Cardiac Index and Systolic Time Ratio. Congest. Heart Fail. 2004, 10, 11–13. [Google Scholar] [CrossRef]
  32. Packer, M.; Abraham, W.T.; Mehra, M.R.; Yancy, C.W.; Lawless, C.E.; Mitchell, J.E.; Smart, F.W.; Bijou, R.; O’Connor, C.M.; Massie, B.M.; et al. Utility of Impedance Cardiography for the Identification of Short-Term Risk of Clinical Decompensation in Stable Patients with Chronic Heart Failure. J. Am. Coll. Cardiol. 2006, 47, 2245–2252. [Google Scholar] [CrossRef]
  33. Pauca, A.L.; O’Rourke, M.F.; Kon, N.D. Prospective evaluation of a method for estimating ascending aortic pressure from the radial artery pressure waveform. Hypertension 2001, 38, 932–937. [Google Scholar] [CrossRef] [PubMed]
  34. Coulden, A.; Hamblin, R.; Wass, J.; Karavitaki, N. Cardiovascular health and mortality in Cushing’s disease. Pituitary 2022, 25, 750–753. [Google Scholar] [CrossRef] [PubMed]
  35. Clayton, R.N. Cardiovascular complications of Cushings syndrome: Impact on morbidity and mortality. J. Neuroendocrinol. 2022, 34, e13175. [Google Scholar] [CrossRef] [PubMed]
  36. De Leo, M.; Pivonello, R.; Auriemma, R.S.; Cozzolino, A.; Vitale, P.; Simeoli, C.; De Martino, M.C.; Lombardi, G.; Colao, A. Cardiovascular disease in Cushing’s syndrome: Heart versus vasculature. Neuroendocrinology 2010, 1, 50–54. [Google Scholar] [CrossRef]
  37. Faggiano, A.; Pivonello, R.; Spiezia, S.; De Martino, M.C.; Filippella, M.; Di Somma, C.; Lombardi, G.; Colao, A. Cardiovascular risk factors and common carotid artery caliber and stiff ness in patients with Cushing’s disease during active disease and 1 year after disease remission. J. Clin. Endocrinol. Metab. 2003, 88, 2527–2533. [Google Scholar] [CrossRef] [PubMed]
  38. Witek, P.; Zieliński, G.; Szamotulska, K.; Witek, J.; Zgliczyński, W. Complications of Cushing’s disease—Prospective evaluation and clinical characteristics. Do they affect the efficacy of surgical treatment? Endokrynol. Pol. 2012, 63, 277–285. [Google Scholar] [PubMed]
  39. Geer, E.B.; Shen, W.; Gallagher, D.; Punyanitya, M.; Looker, H.C.; Post, K.D.; Freda, P.U. MRI assessment of lean and adipose tissue distribution in female patients with Cushing’s disease. Clin. Endocrinol. 2010, 73, 469–475. [Google Scholar] [CrossRef] [PubMed]
  40. Wang, M. The role of glucocorticoid action in the pathophysiology of the metabolic syndrome. Nutr. Metab. 2005, 2, 3. [Google Scholar] [CrossRef]
  41. Tataranni, P.A.; Larson, D.E.; Snitker, S.; Young, J.B.; Flatt, J.P.; Ravussin, E. Eff ects of glucocorticoids on energy metabolism and food intake in humans. Am. J. Physiol. 1996, 271, E317–E325. [Google Scholar] [PubMed]
  42. Isidori, A.M.; Graziadio, C.; Paragliola, R.M.; Cozzolino, A.; Ambrogio, A.G.; Colao, A.; Corsello, S.M.; Pivonello, R. ABC Study Group. The hypertension of Cushing’s syndrome: Controversies in the pathophysiology and focus on cardiovascular complications. J. Hypertens. 2015, 33, 44–60. [Google Scholar] [CrossRef]
  43. Dekkers, O.M.; Biermasz, N.R.; Pereira, A.M.; Roelfsema, F.; van Aken, M.O.; Voormolen, J.H.; Romijn, J.A. Mortality in patients treated for Cushing’s disease is increased, compared with patients treated for nonfunctioning pituitary macroadenoma. J. Clin. Endocrinol. Metab. 2007, 92, 976–981. [Google Scholar] [CrossRef] [PubMed]
  44. Lambert, J.K.; Goldberg, L.; Fayngold, S.; Kostadinov, J.; Post, K.D.; Geer, E.B. Predictors of mortality and long-term outcomes in treated Cushing’s disease: A study of 346 patients. J. Clin. Endocrinol. Metab. 2013, 98, 1022–1030. [Google Scholar] [CrossRef]
  45. Abel, E.D.; Litwin, S.E.; Sweeney, G. Cardiac remodeling in obesity. Physiol. Rev. 2008, 88, 389–419. [Google Scholar] [CrossRef]
  46. Hey, T.M.; Dahl, J.S.; Brix, T.H.; Søndergaard, E.V. Biventricular hypertrophy and heart failure as initial presentation of Cushing’s disease. BMJ Case Rep. 2013, bcr2013201307. [Google Scholar] [CrossRef] [PubMed]
  47. Toja, P.M.; Branzi, G.; Ciambellotti, F.; Radaelli, P.; De Martin, M.; Lonati, L.M.; Scacchi, M.; Parati, G.; Cavagnini, F.; Cavagnini, F. Clinical relevance of cardiac structure and function abnormalities in patients with Cushing’s syndrome before and after cure. Clin. Endocrinol. 2012, 76, 332–338. [Google Scholar] [CrossRef]
  48. You, K.H.; Marsan, N.A.; Delgado, V.; Biermasz, N.R.; Holman, E.R.; Smit, J.W.; Feelders, R.A.; Bax, J.J.; Pereira, A.M. Increased myocardial fibrosis and left ventricular dysfunction in Cushing’s syndrome. Eur. J. Endocrinol. 2012, 166, 27–34. [Google Scholar] [CrossRef]
  49. Baykan, M.; Erem, C.; Gedikli, O.; Hacihasanoglu, A.; Erdogan, T.; Kocak, M.; Kaplan, S.; Kiriş, A.; Orem, C.; Celik, S. Assessment of left ventricular diastolic function and Tei index by tissue Doppler imaging in patients with Cushing’s Syndrome. Echocardiography 2008, 25, 182–190. [Google Scholar] [CrossRef]
  50. Ainscough, J.F.; Drinkhill, M.J.; Sedo, A.; Turner, N.A.; Brooke, D.A.; Balmforth, A.J.; Ball, S.G. Angiotensin II type-1 receptor activation in the adult heart causes blood pressure-independent hypertrophy and cardiac dysfunction. Cardiovasc. Res. 2009, 81, 592–600. [Google Scholar] [CrossRef]
  51. Uziębło-Życzkowska, B.; Krzesinński, P.; Witek, P.; Zielinński, G.; Jurek, A.; Gielerak, G.; Skrobowski, A. Cushing’s Disease: Subclinical Left Ventricular Systolic and Diastolic Dysfunction Revealed by Speckle Tracking Echocardiography and Tissue Doppler Imaging. Front. Endocrinol. 2017, 8, 222. [Google Scholar] [CrossRef]
  52. Eschalier, R.; Rossignol, P.; Kearney-Schwartz, A.; Adamopoulos, C.; Karatzidou, K.; Fay, R.; Mandry, D.; Marie, P.Y.; Zannad, F. Features of cardiac remodeling, associated with blood pressure and fibrosis biomarkers, are frequent in subjects with abdominal obesity. Hypertension 2014, 63, 740–746. [Google Scholar] [CrossRef]
  53. Krzesiński, P.; Stańczyk, A.; Piotrowicz, K.; Gielerak, G.; Uziębło-Zyczkowska, B.; Skrobowski, A. Abdominal obesity and hypertension: A double burden to the heart. Hypertens. Res. 2016, 39, 349–355. [Google Scholar] [CrossRef] [PubMed]
  54. Wong, C.Y.; O’Moore-Sullivan, T.; Leano, R.; Byrne, N.; Beller, E.; Marwick, T.H. Alterations of left ventricular myocardial characteristics associated with obesity. Circulation 2004, 110, 3081–3087. [Google Scholar] [CrossRef] [PubMed]
  55. Parrinello, G.; Licata, A.; Colomba, D.; Di Chiara, T.; Argano, C.; Bologna, P.; Corrao, S.; Avellone, G.; Scaglione, R.; Licata, G. Left ventricular filling abnormalities and obesity-associated hypertension: Relationship with overproduction of circulating transforming growth factor beta1. J. Hum. Hypertens. 2005, 19, 543–550. [Google Scholar] [CrossRef] [PubMed]
  56. Wang, Q.; Gao, Y.; Tan, K.; Li, P. Subclinical impairment of left ventricular function in diabetic patients with or without obesity: A study based on three-dimensional speckle tracking echocardiography. Herz 2014, 40, 260–268. [Google Scholar] [CrossRef]
  57. Feraco, A.; Marzolla, V.; Scuteri, A.; Armani, A.; Caprio, M. Mineralocorticoid Receptors in Metabolic Syndrome: From Physiology to Disease. Trends Endocrinol. Metab. 2020, 31, 205–217. [Google Scholar] [CrossRef]
Disclaimer/Publisher’s Note: The statements, opinions and data contained in all publications are solely those of the individual author(s) and contributor(s) and not of MDPI and/or the editor(s). MDPI and/or the editor(s) disclaim responsibility for any injury to people or property resulting from any ideas, methods, instructions or products referred to in the content.

Epigenetic Mechanisms Modulated by Glucocorticoids With a Focus on Cushing Syndrome

Abstract

In Cushing syndrome (CS), prolonged exposure to high cortisol levels results in a wide range of devastating effects causing multisystem morbidity. Despite the efficacy of treatment leading to disease remission and clinical improvement, hypercortisolism-induced complications may persist. Since glucocorticoids use the epigenetic machinery as a mechanism of action to modulate gene expression, the persistence of some comorbidities may be mediated by hypercortisolism-induced long-lasting epigenetic changes. Additionally, glucocorticoids influence microRNA expression, which is an important epigenetic regulator as it modulates gene expression without changing the DNA sequence. Evidence suggests that chronically elevated glucocorticoid levels may induce aberrant microRNA expression which may impact several cellular processes resulting in cardiometabolic disorders.

The present article reviews the evidence on epigenetic changes induced by (long-term) glucocorticoid exposure. Key aspects of some glucocorticoid-target genes and their implications in the context of CS are described. Lastly, the effects of epigenetic drugs influencing glucocorticoid effects are discussed for their ability to be potentially used as adjunctive therapy in CS.

In Cushing syndrome (CS), adrenocorticotropic hormone (ACTH) hypersecretion by a pituitary adenoma or an ectopic source, or autonomous cortisol hypersecretion by an adrenal tumor, induces chronic endogenous hypercortisolism with loss of the cortisol circadian rhythm (1). CS is more prevalent in women than men and frequently occurs in the fourth to sixth decades of life (2).

Glucocorticoids (GC) have extensive physiological actions and regulate up to 20% of the expressed genome, mainly related to the immune system, metabolic homeostasis, and cognition. Therefore, the prolonged exposure to high cortisol levels results in a wide range of devastating effects, including major changes in body composition (obesity, muscle atrophy, osteoporosis), neuropsychiatric disturbances (impaired cognition, depression, sleep disturbances), the metabolic syndrome (obesity, hypertension, insulin resistance, and dyslipidemia), hypercoagulability, and immune suppression (34). The consequences of hypercortisolism lead to compromised quality of life and increased mortality rate (5). The mortality rate in patients with CS is 4 times higher than the healthy control population (6). Risk factors such as obesity, diabetes, and hypertension contribute to the increased risk of myocardial infarction, stroke, and cardiac insufficiency. As a result, cardiovascular disease is the leading cause of the premature death in CS (5). Infectious disease is also an important cause of death in CS (5). Therefore, prompt treatment to control hypercortisolism is imperative to prevent complications and an increased mortality rate.

Despite the efficacy of treatment leading to disease remission, the clinical burden of CS improves, but does not completely revert, in every patient (7). Indeed, obesity, neuropsychiatric disturbances, hypertension, diabetes, and osteoporosis persist in a substantial number of biochemically cured patients. For instance, in a study involving 118 CS patients in remission for about 7.8 years (median), resolution of comorbidities such as diabetes occurred in only 36% of cases, hypertension in 23% of cases, and depression in 52% of the cases (8). It has been proposed that epigenetic changes as a consequence of hypercortisolism is a mechanism of the persistence of some comorbidities (9-12).

Epigenetics is a reversible process that modifies gene expression without any alterations in DNA sequence; frequently it is mediated by histone modification and DNA methylation together with microRNAs (13-15). GCs use the epigenetic machinery as a mechanism of action to regulate gene expression in physiological circumstances, such as metabolic actions and stress response. Its networks involve DNA and histone modifying enzymes, such as DNA methyltransferases (DNMTs), histone acetyltransferases (HATs), and histone deacetylases (HDACs) (16). (Fig. 1) The DNA methylation process catalyzed by DNMTs is usually associated with downregulation of gene expression (17). Histone modifications catalyzed by HAT enzymes induce gene transcription, while those by HDAC enzymes induce transcriptional repression (17). Drugs interfering with these enzymes (so-called epigenetic drugs) may affect the GC genomic actions confirming the interaction between GC and the epigenetic system (1819). Furthermore, GC can modulate HDAC and DNMT expression and activity (161920). Based on these data it might be speculated that in CS, epigenetic modifications induced by long-term GC exposure plays a role in the development of the disease-specific morbidity (910).

Figure 1.

Glucocorticoid (GC) and its epigenetic machinery. GC through its receptor interacts with DNA and histone modifying enzymes, such as DNA methyltransferases (DNMTs), histone acetyl transferases (HATs), and histone deacetylases (HDAC) to modulate gene expression.

In this review we provide an overview of epigenetic aspects of GC action in physiological conditions and in the context of CS. We start with a detailed characterization of how GC, using the epigenetic system, can change chromatin structure in order to activate or silence gene expression. (Fig. 2) Subsequently, we describe the role of epigenetic mechanisms in the regulation of expression of several GC-target genes related to CS. Finally, we present the current evidence of epigenetic changes caused by the long-term of GC exposure and the potential use of epidrugs influencing GC actions.

Figure 2.

Epigenetic mechanisms of the glucocorticoid action to regulate gene expression. The GR is located in cytoplasm in a multi-protein complex; after GC binding, GR dissociates from the multi-protein complex, crosses the nuclear membrane, dimerizes, and binds to the GRE of the target gene. One of the mechanisms of action of GC is through the recruitment of co-regulators together with epigenetic enzymes, such as HAT, to change the chromatin structure, resulting in activation of gene transcription. Also, GR decreases gene expression by tethering other transcriptional factors and recruiting HDAC2, causing histone deacetylation, which leads to a repressed chromatin. GC can cause hypomethylation through downregulation in the expression of DNMT1. Abbreviations: Ac, acetylation; DNMT1, DNA methyltransferase 1; GC, glucocorticoid; GR, glucocorticoid receptor; GRE, glucocorticoid responsive elements; HAT, histone acetyltransferase; HDAC, histone deacetylases; Me: methylation.

Search Strategy

A search of the PubMed database was conducted using the advanced search builder tool for articles in the English language on the following terms “glucocorticoids,” “glucocorticoid receptor,” “Cushing,” “hypercortisolism,” “epigenetic,” “DNA methylation,” “histone deacetylase,” “histone acetyltransferase,” “microRNA” “fkbp5,” “clock genes,” and “POMC.” Moreover, references were identified directly from the articles included in this manuscript. The articles were selected by the authors after being carefully analyzed regarding their importance and impact.

Epigenetic Aspects of Genomic Action of Glucocorticoids

GCs regulate gene expression positively or negatively. GC-responsive genes include genes encoding for proteins associated with inflammation, metabolic processes, blood pressure and fluid homeostasis, apoptosis, cell cycle progression, circadian rhythm, and intracellular signaling (21).

The GC actions are cell type–specific (22). For instance, in an in vitro study, the comparison of GC-expressed genes between 2 cell lines, corticotroph (AtT20) and mammary (3134) cell lines, showed a different set of GC-regulated genes, revealing the cell type–specific nature of GC effects (23). GC function depends on the accessibility of glucocorticoid receptor (GR)-binding sites in the DNA of the target tissue, which in turn is mostly established during cell differentiation. Therefore, different chromatin organization explains the distinct GR-binding sites among different tissues (222425). The chromatin accessibility is determined by histone modifications such as acetylation, methylation, phosphorylation, and/or DNA methylation, processes that are both dynamic and reversible (26).

Furthermore, gene expression is regulated in a GC-concentration-dependent manner which is tissue-specific. Only a few genes can be upregulated or downregulated at low concentrations of GC. For example, a dose of dexamethasone (Dex) as low as 0.5 nM selectively activated PER1 (period 1, transcription factor related to circadian rhythm) expression in lung cancer (A549) cells (2127). Additionally, continuous GC exposure or pulsed GC (cortisol fluctuation during circadian rhythm) may cause different responses with respect to gene expression (2628). For example, constant treatment with corticosterone induced higher levels of PER1 clock gene mRNA expression compared with pulsatile treatment, as demonstrated in an in vitro study using 3134 cell line (28).

The time course for gene expression in response to Dex is fast, with repression occurring slightly slower compared to activation. Half of activated and repressed genes are detected within, respectively, about 40 minutes and 53 minutes following Dex exposure (21).

In short, the transcriptional output in response to GC depends on cell type, as well as on the duration and intensity of GC exposure (21242627). GCs act as a transcriptional regulatory factor resulting in activating or repressing the expression of genes. The GC exerts its function through binding to corticosteroid receptors, specifically, the mineralocorticoid receptor and the GR, members of the nuclear receptor superfamily (2930).

Glucocorticoid Receptor

The GR is located in the cytoplasm in a chaperone complex which includes heat-shock proteins (70 and 90) and immunophilins (such as FK506 binding protein [FKBP5]). Cortisol diffuses across the cell membrane and binds with high affinity to the GR. The activated GR bound to GC dissociates of the multi-protein complex and is transferred to the nucleus, where it ultimately regulates gene expression (2631).

GR is a transcription factor encoded by nuclear receptor subfamily 3, group C member 1 (NR3C1) gene, located in chromosome 5, and consisting of 9 exons. It is composed of 3 major functional domains, namely a DNA binding domain (DBD), the C-terminal ligand-binding domain (LBD) and the N-terminal domain (NTB). The LBD recognizes and joins the GC. NTB contains an activation function-1 (AF1) which connects with co-regulators and the members of the general transcription machinery to activate target genes. The DBD comprises 2 zinc fingers motifs that are able to identify and bind to glucocorticoid responsive elements (GREs) (3233).

GRα is the most expressed and functionally active GR. GRβ is another isoform which is the result of an alternative splicing in exon 9 of the GR transcript. The difference between the 2 isoforms is the distinct ligand-binding domain in GRβ. This variance prevents the GRβ from binding to GC. In fact, the GRβ counteracts GRα function by interfering with its binding to a GRE in the target gene, and GRβ expression is associated with GC resistance (32). In addition, GRβ has its own transcriptional activity which is independent and distinct from GRα (34).

Another splice variant of human GR, GRγ, is associated with GC resistance in lung cell carcinoma and childhood acute lymphoblastic leukemia (3335). There is an additional amino acid (arginine) in the DBD of the GRγ that reduces, by about half, the capacity to activate or suppress the transcription of the target gene, as compared with GRα (32). One study identified GRγ in a small series of corticotroph adenomas (36).

Glucocorticoid Mechanism of Action

The GR-GC complex induces or represses gene expression directly by binding to DNA, indirectly by tethering other transcription factors or yet in a composite manner that consists in binding DNA in association with binding to other co-regulators (3537).

The GR has the ability to reorganize the chromatin structure to become more or less accessible to the transcriptional machinery. In the classical mechanism of direct induction of gene expression, the GR dimerizes and binds to a GRE in DNA. The receptor recruits co-regulators, such as CREB binding protein, which has intrinsic histone acetyltransferase (HAT) activity that modifies the chromatin structure from an inactive to an active state. This model, called transactivation, upregulates the expression of some genes related to glucose, protein, and fat metabolism. Gene repression, on the other hand, is accomplished by GR binding to a negative GRE (nGRE) leading to the formation of a chromatin remodeling complex composed by co-repressor factors, such as NCOR1 and SMRT, and histone deacetylases (HDACs), that ultimately turn chromatin less accessible and suppress gene transcription. The gene repression through direct binding events occurs less frequently when compared to gene induction (253538).

Another mechanism of GC action is through binding to other transcription factors (tethering). In case of switching off inflammatory genes, GR binds to transcriptional co-activator molecules, such as CREB binding protein with intrinsic HAT activity, and subsequently recruits HDAC2 to reverse histone acetylation, thus resulting in a suppression of the activated inflammatory gene (39). In the same model, GC interacts with other cofactors, such as the STAT family, to induce chromatin modifications resulting in increased gene expression (26).

Furthermore, the transcriptional dynamics of some genes follow a composite manner. In this model, GR, in conjunction with binding to GRE, also interacts with cofactors in order to enhance or reduce gene expression (35).

GCs can also modulate gene expression by influencing the transcription of epigenetic modifiers. An experimental study demonstrated that GC mediated the upregulation of HDAC2 in rats exposed to chronic stress, which in turn decreased the transcription of histone methyltransferase (Ehmt2) that ultimately upregulated the expression of Nedd4. Nedd4 is a ubiquitin ligase, expression of which has been related to cognitive impairment (40). Additionally, GC was found to interact with another epigenetic eraser, namely JMJD3, a histone demethylase, suppressing its transcription in endothelial cells treated with TNFα that led to decreased expression of other genes related to the blood-brain barrier (41).

GCs have the ability to induce (de)methylation changes in DNA, ultimately affecting gene expression. The DNA methylation process triggered by GC involves the family of DNA methyltransferases (DNMT) and ten-eleven translocation (TET) protein (2042-44). The DNMT, DNMT1, DNMT3A, and DNMT3B are able to transfer a methyl group to a cytosine residue in DNA, forming 5-methylcytosine (5mC), which negatively impacts gene expression. In contrast, TET protein chemically modifies the 5mC to form 5-hydroxymethylcytosine (5hmC), which ultimately leads to unmethylated cytosine, positively influencing gene expression (45).

Glucocorticoids mainly induce loss of methylation events rather than gain of methylation across the genome (1146). The DNA demethylation process can be either active or passive. The active mechanism is linked to the upregulation of TET enzyme expression that follows GC treatment, which was described in retinal and osteocyte cell line model studies (4243). The passive demethylation event involves the downregulation (Fig. 2) or dysfunction of DNMT1. DNMT1 is responsible for maintaining the methylation process in dividing cells (45). In case of GC exposure, GC can cause hypomethylation through downregulation in the expression of DNMT1, a process described in the AtT20 corticotroph tumor cell model, or through GC hindering DNMT activity, particularly DNMT1, as demonstrated in the retinal cell (RPE) line (204244).

Glucocorticoid-Induced Epigenetic Changes

There are several molecular mechanisms connecting GR activation and epigenetic modifications ultimately affecting gene expression (Fig. 2). As described above, GC uses epigenetic machinery, such as DNA and histone modifying enzymes, to restructure the chromatin in order to induce or silence gene transcription (1647).

In an in vitro study using murine AtT20 corticotroph tumor and neuronal cell lines, after chronic GC exposure followed by a recovery period in the absence of GC, the cells retained an “epigenetic memory” with persistence of loss of methylation content in FKBP5 gene but with no increased gene expression at baseline. The functionality of this “epigenetic memory” only became evident in a second exposure to GC, when the cells responded sharply with a more robust expression of FKBP5 gene compared to the cells without previous exposure to GC (44). Another in vitro study, using a human fetal hippocampal cell line, confirmed long-lasting DNA methylation changes induced by GC. The cells were treated for 10 days with dexamethasone, during the proliferative and cell differentiation phases of the cell line, followed by 20 days without any treatment. The second exposure to GC resulted in an enhanced gene expression of a subset of GC-target genes (48). Additionally, using an animal model subjected to chronic stress, a distinct gene expression profile was demonstrated in response to acute GC challenge compared to those without chronic stress history. The proposed mechanism was that chronic stress resulted in GC-induced enduring epigenetic changes in target genes, altering the responsiveness to a subsequent GC exposure (49).

In general, it seems that the majority of differential methylation regions (DMRs) induced by GC are loss of methylation rather than gain of methylation. In an experimental study, an association between hypomethylation and GC exposure was demonstrated in mice previously exposed to high levels of GC. Further analysis demonstrated that the genes linked with DMR were mostly related to metabolism, the immune system, and neurodevelopment (11).

Human studies have also shown that excess of cortisol can induce modifications in DNA methylation. DNA methylation data obtained from whole blood samples from patients with chronic obstructive pulmonary disease (COPD) treated with GC revealed DMR at specific CpG dinucleotides across the genome. These DMR were confirmed by pyrosequencing and annotated to genes, such as SCNN1A, encoding the α subunit of the epithelial sodium channel, GPR97, encoding G protein coupled receptor 97, and LRP3, encoding low-density lipoprotein receptor-related protein 3 (50). Furthermore, it has been proposed that the negative impact of chronic GC exposure on the immune system, which increases the risk of opportunistically infections, may be epigenetically mediated (51). In a clinical study, using whole blood samples, an analysis of genome-wide DNA methylation was performed on patients before and after exposure to GC (51). Long-term GC exposure disrupts, through a persistent modification of the cytosine methylation pattern, the mTORC1 pathway which affects CD4+ T cell biology (51).

Taken together, these data clearly show the interplay between GC signaling and methylation and histone modifications processes suggesting that GC interferes in the epigenetic landscape modulating gene expression. It is possible that most of these GC-induced epigenetic events are dynamic and temporary, while others may persist leading to long-lasting disorders. Further research to provide insight into what makes some events reversible is warranted.

Epigenetic Changes as a Consequence of Long-Term Glucocorticoid Exposure in Cushing Syndrome

The comorbidities associated with CS are associated with increased mortality mainly due to cardiovascular events (52). GC-induced comorbidities in CS may be at least in part epigenetically mediated. Previous study using whole blood methylation profile demonstrated that specific hypomethylated CpG sites induced by GC were associated with Cushing comorbidities, such as hypertension and osteoporosis (46). The study identified a methylator predictor of GC excess which could be used as a biomarker to monitor GC status (46).

The long-term exposure to high cortisol levels may be crucial for the persistence of some morbidities in CS through epigenetic changes. Hypercortisolism-induced persistent changes in visceral adipose tissue gene expression through epigenetic modifications was investigated in a translational study (12). This study combined data from patients with active CS and data from an animal model of CS in active and remitted phase. Interestingly, the study demonstrated long-lasting changes in the transcriptome of adipose tissue that were associated with histone modifications induced by GC. Therefore, these epigenetic fingerprints observed even after the resolution of hypercortisolism may elucidate the mechanism of persistent modifications in gene expression in the visceral adipose tissue (12).

With regard to the persistence of GC-induced DMR, a genome-wide DNA methylation analysis showed a lower average of DNA methylation in patients in remission of CS compared to controls. Interestingly, the most common biologically relevant affected genes were retinoic acid receptors, thyroid hormone receptors, or hormone/nuclear receptors, important genes related to intracellular pathways and regulators of gene expression (9).

In summary, this large body of evidence supports the concept that prolonged GC exposure modulates the epigenetic landscape across the genome by inducing DMR and histone modifications. Some epigenetic modifications are persistent, and this may partially explain the incomplete reversibility of some of CS features following clinical remission.

Glucocorticoid-Target Genes in Cushing Syndrome

A detailed identification and characterization of GC-target genes may shed light in the understanding of the pathophysiology and treatment response in patients with CS. For instance, the GC regulation of pro-opiomelanocortin (POMC) expression as part of the physiologic GC negative feedback may be impaired in Cushing disease (CD), which is an important mechanism for the maintenance of high GC levels (53). Another example is the interaction between GC and clock genes, which may interfere in the loss of the GC circadian rhythm and may contribute to metabolic disorders in CS (54). Furthermore, the suppressive action of GC on drug targets, such as the somatostatin receptor (subtype 2), may influence the efficacy of first-generation somatostatin receptor ligands in normalizing cortisol levels in CD (55). Here we describe how GCs using epigenetic machinery influence the expression of important target genes and their implications in CS.

FKBP5

FK506 binding protein (FKBP5) plays an important role in the regulation of hypothalamic-pituitary-adrenal (HPA) system (56). As part of the GC negative feedback loop, GC binds to hypothalamic and pituitary GR. In the cytoplasm, GR is bound to a multi-protein complex including FKBP5. FKBP5 modulates GR action by decreasing GR binding affinity to GC and by preventing GR translocation from cytoplasm to nucleus (5758). In other words, an increase of FKBP5 expression is inversely correlated with GR activity and results in GC resistance leading to an impaired negative feedback regulation in the HPA axis (59).

FKBP5 is a GC-responsive gene; its upregulation by GC is part of an intracellular negative short-feedback loop (60). The mechanism by which GC regulates FKBP5 expression was shown to include inhibition of DNA methylation (44). In a model for CS, mice treated with corticosterone for 4 weeks had a reduced level of DNA methylation of FKBP5 in DNA extracted from whole blood, which was strongly correlated in a negative manner with GC concentration. Interestingly, a negative correlation was also observed between the degree of FKBP5 gene methylation measured at 4 weeks of GC exposure and the percentage of mice visceral fat (61). Accordingly, previous studies have provided compelling evidence of decreased methylation in the FKBP5 gene in patients with active CS compared to healthy control (1046). Even in patients with CS in remission, previous data have suggested a small decrease in FKBP5 methylation levels compared to healthy controls (910). In an in vitro study, it was demonstrated that, by decreasing DNMT1 expression, GC is able to reduce FKBP5 methylation levels and, therefore, increase its expression (44).

Likewise, FKBP5 mRNA is also sensitive to GC exposure. A time-dependent increase in blood FKBP5 mRNA after single-dose prednisone administration has been demonstrated in healthy humans (62). Accordingly, patients with ACTH-dependent CS had higher blood FKBP5 mRNA levels compared with healthy controls, and after a successful surgery, FKBP5 mRNA returned to baseline levels (63). Furthermore, in another study, blood FKBP5 mRNA was inversely correlated with FKBP5 promoter methylation and positively correlated with 24-hour urine free cortisol (UFC) levels in patients with CS (46). Taken together, this fine-tuning of FKBP5 DNA methylation and mRNA according to the level of GC suggests that FKBP5 can be used as a biomarker to infer the magnitude of GC exposure.

POMC and Corticotropin-Releasing Hormone

The partial resistance of the corticotroph adenoma to GC negative feedback is a hallmark of CD. Indeed, the lack of this inhibitory effect constitutes a method to diagnose CD, that is, with the dexamethasone suppression test. One of the mechanisms related to the insensitivity to GC can be attributed to GR mutations which are, however, rarely found in corticotrophinomas (64). Another mechanism that was uncovered in corticotroph adenomas is an overexpression of the HSP90 chaperone resulting in reduced affinity of GR to its ligand and consequently GR resistance (5365).

In addition, the loss of protein expression of either Brg1, ATPase component of the SWI/SNF chromatin remodeling complex, or HDAC2 has been linked to GC resistance in about 50% of some adenomas (66). The trans-repression process on POMC transcription achieved by GC involves both the histone deacetylation enzyme and Brg1. One mechanism of corticotropin-releasing hormone (CRH)-induced POMC expression is through an orphan nuclear receptor (NR) related to NGFI-B (Nur77). NGFI-B binds to the NurRE sequence in the promoter region of POMC gene and recruits a co-activator to mediate its transcription. In a tethering mechanism, the GR directly interacts with NGFI-B to form a trans-repression complex, which contains the GR itself, Brg1, the nuclear receptor, and HDAC2; the latter being essential to block the gene expression through chromatin remodeling process (5366).

In CD, hypercortisolism exerts a negative feedback at CRH secretion from the hypothalamus (67). The mechanism involved in GR-induced suppression of CRH expression is through direct binding to a nGRE in the promoter region of CRH gene and subsequent recruitment of repressor complexes. In a rat hypothalamic cell line, it was demonstrated that Dex-induced CRH repression occurs through coordinated actions of corepressors involving Methyl-CpG-binding protein 2 (MeCP2), HDAC1, and DNA methyltransferase 3B (DNMT3B). Possibly, GR bound to nGRE recruits DNMT3B to the promoter in order to methylate a specific region, subsequently binding MeCP2 on these methylated sites followed by the recruitment of chromatin modify corepressor HDAC1, ultimately resulting in CRH suppression. Another possibility is that 2 independent complexes, one consisting of GR with DNMT3 for the methylation and the other the MeCP2, bound to methylated region, interact with HDAC1 to induce repression (68).

Clock Genes

The clock system and the HPA axis are interconnected regulatory systems. Cortisol circadian rhythm is modulated by the interaction between a central pacemaker, located in the hypothalamic suprachiasmatic nuclei, and the HPA axis (69). At the molecular level, mediators of the clock system and cortisol also communicate with each other, both acting as transcription factors of many genes to influence cellular functions.

In CS, the impact of chronic GC exposure on clock genes expression was recently evaluated using peripheral blood samples from patients with active disease compared with healthy subjects. The circadian rhythm of peripheral clock gene expression (CLOCK, BMAL, PER1-3, and CRY1) was abolished as a result of hypercortisolism, and that may contribute to metabolic disorders observed in Cushing patients (70). Another study, which investigated persistent changes induced by hypercortisolism in visceral adipose tissue, found that the expression of clock genes, such as PER1, remained altered in association with persistent epigenetic changes in both H3K4me3 and H3K27ac induced by hypercortisolism even after the resolution of hypercortisolism (12). This suggests that chronic exposure to GC may induce sustained epigenetic changes that can influence clock genes expression. Nevertheless, further studies are warranted to better elucidate how long-term exposure to GC impacts clock genes expression using the epigenetic machinery.

Glucocorticoid Effects on MicroRNAs

Along with histone modification and DNA methylation, microRNAs (miRNAs) have emerged as an epigenetic mechanism capable of impacting gene expression without changing DNA sequence (15). Interestingly, miRNA expression itself is also under the influence of epigenetic modifications through promoter methylation like any other protein-encoding genes (71).

MicroRNAs are small (about 20-25 nucleotides in length) non-coding RNAs that are important in transcriptional silencing of messenger RNA (mRNA). By partially pairing with mRNA, miRNAs can either induce mRNA degradation or inhibit mRNA translation to protein. MiRNAs regulate the translation of about 50% of the transcriptome, allowing them to play an important role in a wide range of biological functions, such as cell differentiation, proliferation, metabolism, and apoptosis under normal physiological and pathological situations. Some miRNAs can be classified as oncogenes or tumor suppressing genes, and aberrant expression of miRNAs may be implicated in tumor pathogenesis (71-73).

Insight into the regulation of miRNA expression is, therefore, crucial for a better understanding of tumor development and other human diseases, including cardiac, metabolic, and neurological disorders (7374). There are different regulatory mechanisms involved in miRNA expression, including transcriptional factors such as GR-GC. GC may modulate miRNA expression through direct binding to GRE in the promoter region of the host gene, as observed in hemopoietic tumor cells (75). In addition to transcriptional activation, in vascular smooth muscle cells, Dex treatment induces downregulation of DNMT1 and DNMT3a protein levels and reduces the methylation of miRNA-29c promoter, resulting in an increased expression of miRNA-29c (76). Interestingly, it was demonstrated that the increased expression of miRNA-29 family (miRNA-29a, -29b, and -29c) associates with metabolic dysfunction, such as obesity and insulin resistance, which pertains to CS (7778). With regard to metabolic dysfunction, miRNA-379 expression was shown to be upregulated by GC and its overexpression in the liver resulted in elevated levels of serum triglycerides associated with very low-density lipoprotein (VLDL) fraction in mice (79). In obese patients, the level of hepatic miRNA-379 expression was higher compared to nonobese patients and positively correlated with serum cortisol and triglycerides (79). Hence, GC-responsive miRNA may be, at least in part, a mediator to GC-driven metabolic conditions in CS.

In pathological conditions, such as seen in CS, prolonged exposure to an elevated cortisol level results in a wide range of comorbidities. It can be hypothesized that the chronic and excessive glucocorticoid levels may induce an aberrant miRNA expression that might impact several cellular processes related to bone and cardiometabolic disorders. A recent study addressed the impact of hypercortisolism on bone miRNA of patients with active CD compared to patients with nonfunctional pituitary adenomas. Significant changes in bone miRNA expression levels were observed, suggesting that the disruption of miRNA may be partially responsible for reduced bone formation and osteoblastogenesis (80). Similarly, altered expression levels of selected miRNAs related to endothelial biology in patients with CS may point to a contribution to a high incidence of cardiovascular disorders in Cushing patients (81). Therefore, dysregulated miRNAs as a consequence of high cortisol levels may underpin the development and progression of comorbidities related to CS. To the best of our knowledge, it is currently not clear whether miRNA dysregulation persists after resolution of hypercortisolism, thus contributing to the persistence of some comorbidities. This hypothesis needs to be further investigated.

MicroRNA can also be used as a diagnostic tool in CS. A study was performed to identify circulating miRNA as a biomarker to differentiate patients with CS from patients with suspected CS who had failed diagnostic tests (the control group) (82). It was observed that miRNA182-5p was differentially expressed in the CS cohort compared to the control group; therefore, it may be used as a biomarker (82). However, a large cohort is necessary to validate this finding (82). In corticotroph tumors, downregulation of miRNA 16-1 expression was observed relative to normal pituitary tissue (83). In contrast, the plasma level of miRNA16-5p was found to be significantly higher in CD compared to ectopic Cushing (EAS) and healthy controls (84). This finding suggests that miRNA16-5p may be a biomarker capable to differentiate the 2 forms of ACTH-dependent Cushing (84).

Epidrugs and Glucocorticoid Action in Cushing’s Syndrome

The interest in understanding the epigenetic mechanism of GC action in the context of CS is based on reversibility of epi-marks, such as DNA methylation and histone modifications, using epidrugs (8586). The biological characteristics of epigenetic drugs and their target have been extensively explored. Their effectiveness as antitumor drugs have been tested on corticotroph tumors using in vitro studies (87-89). However, a limited number of studies have explored the role of epidrugs as a therapeutic tool in reversing the genomic action of GC in CS, particularly in comorbidities induced by hypercortisolism (9091).

The use of histone deacetylase inhibitors (HDACi) may reduce the genomic action of GC (90-92). It has been demonstrated that the use of the HDAC inhibitor valproic acid increases the acetylation level of GR, consequently attenuating the genomic action of GC. In an experimental Cushing model in rats, the use of valproic acid decreased expression of genes related to lipogenesis, gluconeogenesis, and ion regulators in the kidney that ultimately reduces hepatic steatosis, hyperglycemia, and hypertension in ACTH-infused rats (9091).

More studies evaluating the effects of epidrugs influencing the GC actions are warranted to further elucidate the underlying mechanisms and to explore potential treatment modalities to reverse long-lasting consequences of chronic corticoid exposure.

Conclusions

In physiologic conditions, GC are secreted in pulses following a circadian rhythm pattern, as opposed to a constant, chronic, and high GC exposure in CS. This pathological pattern may account for numerous devastating effects observed in CS (7). Yet, the expressed genome in response to chronic GC exposure may potentially be abnormal, leading to dysregulation in clock genes, among other effects.

GC levels may return to a normal circadian pattern in response to a successful treatment, but with incomplete reversibility of some CS features, which may in part be explained by epigenetic changes. The epigenetic machinery is used by GC to induce dynamic changes in chromatin to modulate gene expression. (Fig. 2) It seems that most of chromatin modifications are reversible, but some may persist resulting in long-term epigenetic changes. (Table 1)

Table 1.

Evidence of interaction between glucocorticoid and epigenetic machinery

Epigenetic changes/epigenetic enzymes Action
Histone acetylation (HAT)
  • Glucocorticoid receptors (GR) recruit co-regulators, such as CREB binding protein (CBP), which has intrinsic histone acetyltransferase (HAT) activity that modifies the chromatin structure from an inactive to an active state (253335).

Histone deacetylation (HDAC)
  • GR recruit histone deacetylases (HDACs) to turn chromatin less accessible and suppress gene transcription (2535).

  • The trans-repression process on POMC transcription achieved by glucocorticoids (GC) involves the histone deacetylation enzyme (HDAC2).

  • GC mediates the upregulation of HDAC2 in rats exposed to chronic stress (40).

Histone demethylase (JMJD3)
  • GC suppress transcription of JMJD3 in endothelial cells treated with TNFα (41).

Histone modifications
  • Using ChIP-seq, a study in mice treated for 5 weeks with corticosterone showed higher levels of histone modifications (H3K4me3, H3K27ac) compared to control mice. In mice after a 10-week washout period, persistence of this epigenetic fingerprint was observed, which was associated with long-lasting changes in gene expression (12).

DNA methylation (DNMT3B) and histone deacetylation (HDAC1)
  • GC mediates CRH downregulation through DNMT3B to the promoter in order to methylate a specific region and recruitment of chromatin modify corepressor HDAC (68).

DNA hypomethylation
  • GC induces downregulation of DNMT1 in AtT20 (mouse corticotroph adenoma cell line) (20).

  • GC induces upregulation of TET enzyme expression which was described in retinal and osteocyte cell line model (4243).

  • An experimental study in mice previously exposed to high levels of GC showed differentially methylated regions (DMR) induced by GC treatment, of which the majority was loss of the methylation (11).

  • Reduced DNA methylation in FKBP5 gene was found in patients in active disease and also in remission state of Cushing syndrome (CS) as compared to a healthy control group (10).

  • A genome-wide DNA methylation analysis showed a lower average of DNA methylation in patients in remission of CS compared to controls (9).

  • A study using whole blood methylation profile demonstrated an association between cortisol excess and DNA hypomethylation in patients with CS (46).

Further studies are needed to elucidate how chronic exposure to GC leads to incomplete reversibility of CS morbidities via sustained modulation of the epigenetic machinery and possibly other mechanisms. Subsequent identification of therapeutic targets may offer new perspective for treatments, for example, with epidrugs, aiming to reverse hypercortisolism-related comorbidities.

Funding

The authors received no financial support for this manuscript.

Disclosures

T.P., R.A.F., and L.J.H. have nothing to declare.

Data Availability

Data sharing is not applicable to this article, as no datasets were generated or analyzed during the current study.