Management of Diabetes Mellitus in Acromegaly and Cushing’s Disease with Focus on Pasireotide Therapy

Abstract: Patients suffering from acromegaly and Cushing’s Disease (CD) face the risk of several clinical complications. The onset of diabetes mellitus (DM) is among the most important: exposure to elevated growth hormone or cortisol levels is associated with insulin resistance (IR). DM contributes to increasing cardiovascular risk for these subjects, which is higher compared to healthy individuals. Hyperglycemia may also be caused by pasireotide, a second-generation somatostatin receptor ligand (SRLs), currently used for the treatment of these diseases. Accordingly, with 2014 medical expert recommendations, the management of hyperglycemia in patients with CD and treated with pasireotide is based on lifestyle changes, metformin, DPP-4 inhibitors (DPP-4i) and, subsequently, GLP-1 Receptor Agonists (GLP-1 RAs). There is no position for SGLT2-inhibitors (SGLT2-i). However, a very recent experts’ consensus regarding the management of pasireotide-induced hyperglycemia in patients with acromegaly suggests the use of GLP-1 RAs as first line treatment (in suitable patients) and the use of SGLT2-i as second line treatment in patients with high cardiovascular risk or renal disease. As a matter of fact, beyond the hypoglycemic effect of GLP1-RAs and SGLT2-i, there is increasing evidence regarding their role in the reduction of cardiovascular risk, commonly very high in acromegaly and CD and often tough to improve despite biochemical remission. So, an increasing use of GLP1-RAs and SGLT2-i to control hyperglycemia is desirable in these diseases. Obviously, all of that must be done with due attention in order to minimize the occurrence of adverse events. For this reason, large studies are needed to analyze the presence of potential limitations.

Keywords: acromegaly, Cushing’s disease, pasireotide, hyperglycemia, diabetes mellitus, cardiovascular risk

Introduction

Acromegaly and Cushing’s Disease (CD) are rare but weakening endocrine diseases.

Acromegaly is usually caused by a growth hormone (GH)-secreting pituitary adenoma, with subsequent excess of insulin-like growth factor (IGF-1).1 CD is characterized by hyperproduction of cortisol due to an adrenocorticotropic hormone (ACTH)-secreting pituitary adenoma.2 Impaired glucose metabolism and the onset of DM are common clinical conditions resulting from these diseases. The worsening of glycemic control might also be caused by treatment with somatostatin receptor analogs, more specifically with pasireotide.

Pasireotide, a second-generation somatostatin receptor ligand (SRLs), is currently used for the treatment of acromegaly and CD.3,4

In the management of acromegaly, long-acting pasireotide is recommended at a starting dose of 40 mg monthly (potentially up-titrated to 60 mg) in patients with poorly controlled or uncontrolled disease after failure with first generation SRLs. Several Randomized Control Trials (RCTs) have shown better outcomes in achieving biochemical control compared to octreotide and lanreotide, both in parallel arms as well as in a cross-over evaluation.5,6 In CD, pasireotide is approved for the treatment of persistent hypercortisolism after a surgical procedure or when surgery is not feasible or refused, at a start dose of 0.6 mg twice daily (potentially up titrated to 0.9 mg twice daily).7,8

Hyperglycemia and Increased Cardiovascular Risk in Acromegaly and CD

Impaired glucose metabolism is one of the comorbidities associated with acromegaly and CD, uniquely linked to the pathophysiology of the diseases. As a matter of fact, in acromegaly, the prevalence of altered basal glucose ranges between 7 and 22%, of altered glucose tolerance between 6 and 45%, and of diabetes between 19 and 56%.9 Additionally, disorders of carbohydrate metabolism occur in 14–74% of the patients among the various forms of hypercortisolism while the prevalence of diabetes varies between 21 and 47%.10

The pathogenesis of insulin resistance (IR) in acromegaly is due to multiple factors: GH exerts its effects both directly by inducing gluconeogenesis, glycogenolysis and lipolysis and promoting IR in the liver and peripheral tissues, as well as indirectly through IGF-1.11 GH stimulates the hydrolysis of triglycerides and the production of free fatty acids from adipose tissue, and this increased synthesis of free fatty acids leads to a decrease in insulin-mediated glucose uptake by inhibiting glucose transporters GLUT-1 and GLUT-4.12,13 Moreover, GH suppresses key insulin signaling pathways involved in stimulating glucose transport in muscle and adipose tissue and inhibiting glucose production in the liver.14

The effects of IR secondary to the excess of GH are initially compensated by the increased secretion of insulin from the pancreatic beta cells, which, however, diminishes over time, favoring the onset of prediabetes and diabetes.15,16 Once the beta cell function is affected, the glucose metabolism disorders persist even after the acromegaly is cured.17 Although physiologically IGF-1 improves glucose homeostasis, the chronic excess of GH in acromegaly that causes IR greatly exceeds the possible beneficial effects of IGF-1 on insulin sensitivity.18

Similar to the excess of GH, hypercortisolism affects carbohydrate metabolism mainly in liver, skeletal muscles, and adipose tissue.19 In the liver, excess glucocorticoids stimulate gluconeogenesis by activating numerous genes involved in the hepatic gluconeogenesis, stimulating lipolysis and proteolysis with increasing substrates for gluconeogenesis, potentiating the action of glucagon and inhibiting glycogenogenesis.20

In the muscle, hypercortisolism induces IR by interfering with different components of the insulin-signaling cascade, as well as by stimulating proteolysis and loss of muscle mass. All this reduces the capacity of the muscle to synthesize glycogen and uptake most of the postprandial glucose from circulation.21

Additionally, hypercortisolism causes an increase in visceral obesity and a relative reduction in peripheral adipose tissue, and this “shift” is closely associated with metabolic syndrome and worsens IR. Moreover, the excess of cortisol influences the synthesis and release of hormones from adipose tissue, mainly adipokines, further contributing to the development of IR.21

Glucocorticoids inhibit the synthesis and secretion of insulin. Also in CD, there is an initial transient phase characterized by the increase in insulin secretion as an adaptive mechanism to IR, but later the chronic exposure to higher levels of cortisol induces pancreatic beta cell apoptosis, loss of beta cell function and the subsequent development of diabetes.20,22

The involvement of the bone system in affecting glucose homeostasis has also been found: in fact, long-term exposure to glucocorticoids causes a reduction in circulating osteocalcin that can increase IR.23

Furthermore, two studies in humans24,25 suggested that secretion of incretins (glucagon-like peptide-1, GLP-1 and glucose dependent insulinotropic peptide, GIP) was unaffected by dexamethasone administration, but their insulinotropic effects of on beta-cells were reduced.

The worsening of glycemic control and the onset of DM are also important limitations in the management of some patients treated with pasireotide.26,27 This topic will be further explored in a subsequent paragraph.

As is well known, hyperglycemia contributes to increasing cardiovascular risk, which is already very high in patients with acromegaly or CD.28,29

Cardiovascular disease is the leading cause of death in 23–50% of patients with acromegaly in different studies.9 Hypertension affects about 33% of the patients, ranging from 11 to 54.7%,30 and it is strongly related with typical cardiac implications of acromegaly as valvulopathy, arrhythmias and cardiomyopathy.

In the large Liege Acromegaly Survey database of 3173 acromegalic patients from 10 European countries,31 left ventricular hypertrophy was present in 15.5% at time of diagnosis. The most common manifestations of cardiopathy are biventricular hypertrophy, diastolic-systolic dysfunction, and valvular regurgitation.32 Certainly, the severity of cardiac disease is correlated with age, duration of acromegaly, GH and IGF-1 levels (both vascular growth factors which stimulate collagen deposition) and long-standing hypertension.33 In the worst cases, hypertrophic cardiopathy can evolve into Left Ventricular Systolic Dysfunction (LVSD), the last stage of cardiac disease, with recurring hospitalizations and very high mortality rates.34 Acromegaly is also associated with sleep apnea (ranging from 45 to 80% of the cases).35

Similarly, in CD cardiovascular disease is the leading cause of death: a retrospective study involving 502 patients (83% in remission) with a median follow-up of 13 years36 demonstrated a standardized mortality ratio (SMR) of 3.3 (95% CI 2.6–4.3) for CV disease, in particular 3.6 (95% CI 2.5–5.1) for ischemic cardiac disease and 3.0 (95% CI 1.4–5.7) for stroke. SMR related cardiovascular disease remained higher also after biochemical remission (2.5, 95% CI 1.8–3.4).36 Cardiovascular remodeling caused by hypercortisolism is frequently irreversible: at 5 years post-remission, coronary artery plaques persisted in 27% of subjects vs 3% of control.37 As a result, the risk for ischemic events remains above that of the general population.38

Hypertension is highly prevalent in patients with hypercortisolism: the majority (80–85%) of patients have hypertension at diagnosis and 9% may have required hospital admission because of the hypertension crisis before the diagnosis of hypercortisolism.39 Also, after remission, hypertension results are highly prevalent, as shown in two different studies (50% and 40%, respectively).40,41 Up to 70% of the patients with active CD present abnormal left ventricular mass parameters, whereas systolic and diastolic function were usually normal. Rarely, patients present dilatative cardiopathy and severe HF.42 Moreover, greater incidence of hypokalemia exposes patients to fatal arrhythmias.

Finally, both obesity and dyslipidemia, frequently occurring in these diseases, do not normalize despite biochemical remission.

Mechanisms of Pasireotide-Induced Hyperglycemia

Pasireotide is a multi-receptor targeted SRL, with action on different somatostatin receptors (SSTR). Pasireotide binds with high affinity to SSTR-1, 3 and 5 and lower to SSTR-2 than first generation SSA. More specifically, the affinity for SSTR-5, several times greater than those of octreotide and lanreotide, explains the efficacy of pasireotide: this binding causes the suppression of ACTH and GH, accompanied by tumor volume reduction.43,44

However, this mechanism causes the alteration of glucose metabolism because the binding is not specific to pituitary cells. Stimulation of pancreatic SSTR-5, expressed more in Langerhans islet beta cells than alfa cells (87% vs 44%), suppresses insulin secretion much more than glucagon secretion.45

Pasireotide appears to inhibit the secretion of incretin hormones GIP (glucose-dependent insulinotropic polypeptide) and GLP-1 (glucagon-like peptide-1) in health volunteers after oral glucose tolerance test (OGTT),46 even if a recent study showed no differences in incretin levels and their response to mixed meal tolerance test (MMTT) in CD patients,47 suggesting a main role of direct inhibition of beta-cells activity. However, a reduced intra-islet paracrine effect of GLP-1 cannot be excluded whereas an increased IL-6 mediated GLP-1 secretion in CD may disguise pasireotide inhibitory effect.47,48 Furthermore, pasireotide has no effect on hepatic and peripheral insulin sensitivity.46

Pasireotide-induced hyperglycemia is less pronounced following multiple dosing, and it appears even reversible upon discontinuation of the drug,49 as shown in a pharmacokinetic analysis of single-dose administration, in which mean glucose levels increased to 200 mg/dL (11.1 mmol/L) and returned to euglycemia approximately 23 hours later.50

Not all patients treated with pasireotide develop impaired glucose tolerance or DM: the prevalence of these conditions in CD is respectively 21–64% and 20–47%,51 whereas in acromegaly it is 6–45% and 16–65%.9 This suggests that glycemic control prior to the treatment and a preceding DM, could be predictive of the extent of hyperglycemia.

In the PAOLA study6 a fasting blood glucose (FBG) > 100 mg/dL (5.5 mmol/L) at baseline correlated with higher FBG and higher HbA1c during treatment with pasireotide, while patients with acromegaly < 40 years of age were less likely to experience hyperglycemia than older patients.

Moreover, in acromegalic patients, the up-titration to a dose of 60 mg was associated with a 21–36% increased risk of hyperglycemia.52,53 Other factors that could increase the risk of hyperglycemia were a Body Mass Index > 30 kg/m², hypertension and dyslipidemia at baseline.54

Superimposable results were obtained in another Phase III study,55 always performed in subjects with acromegaly: it was reported that up to 45% of patients with baseline FBG between 100 (5.5 mmol/L) and 126 mg/dL (7.0 mmol/L) had FBG levels ≥126 mg/dL (7.0 mmol/L) after 26 months of pasireotide.55

Also, in CD, preexisting DM or impaired glucose tolerance increased the risk of hyperglycemia-related adverse events (AEs) with pasireotide, although severe AEs were not reported.7

A meta-analysis showed a lower frequency of hyperglycemia-related AEs in acromegalic patients treated with pasireotide monthly (57.3–67.0%) in comparison to those who received it twice daily for CD (68.4–73.0%).27 Also, the rate of discontinuation due to hyperglycemia was higher in CD trials (6.0% and 5.3%) than that in acromegaly trials (3.4% and 4.0%).5–7,56 The reasons for these findings are unknown.

On the other hand, it has been acknowledged that other drugs, commonly used for the treatment of acromegaly or CD, may affect glucose metabolism leading to clinical benefits, even during pasireotide therapy. In fact, in acromegalic subjects, cabergoline can improve glucose tolerance,57 whereas pegvisomant reduces fasting glucose levels and improves insulin sensitivity.58,59 Similar results have been highlighted for ketoconazole,60 metyrapone61 and osilodostrat62 in studies involving patients with CD.

Antidiabetic Drugs with Proven Cardiovascular Benefits

The evidence from Cardio Vascular Outcome Trials with GLP-1 RAs and SGLT2-i have revolutionized the management of Type 2 Diabetes Mellitus (T2DM). As reaffirmed in the recent American Diabetes Association-European Association for the Study of Diabetes (ADA-EASD) Consensus, the treatment approach must be holistic and person-centered, with four main areas of interest: glycemic control, weight loss, CV risk reduction and renal protection.63

In a network meta-analysis of 453 trials assessing glucose-lowering medications from nine drug classes, the greatest reductions in HbA1c were seen with GLP-1 RAs.64 Another meta-analysis comparing the effects of glucose-lowering drugs on body weight and blood pressure indicated the greatest efficacy for reducing body weight with GLP-1 RAs, whereas the greatest reduction in blood pressure is seen with the SGLT2-i.65

Among GLP-1 RAs, liraglutide (at a dose of 1.8 mg daily),66 dulaglutide (at a dose 1.5 mg weekly)67 and injectable semaglutide (at a dose of 0.5 and 1 mg weekly)68 reduced the incidence of three point-MACE (Major Adverse Cardiovascular Events) and the progression of CKD (Chronic Kidney Disease) through the reduction of albuminuria.

With regard to SGLT2-i, empagliflozin and canagliflozin reduced the incidence of three point-MACE.69,70 Empagliflozin, dapagliflozin and canagliflozin demonstrated improvement of CKD in trials with specific renal outcomes, and the first two also demonstrated this benefit in patients without T2DM.71–73 Another significant clinical benefit is the reduction of hospitalization for heart failure (HF), demonstrated also in patients without T2DM for empagliflozin and dapagliflozin, both with reduced ejection fraction (HFrEF)74,75 and preserved ejection fraction (HFpEF).76,77

The Current Management of Pasireotide-Induced Hyperglycemia

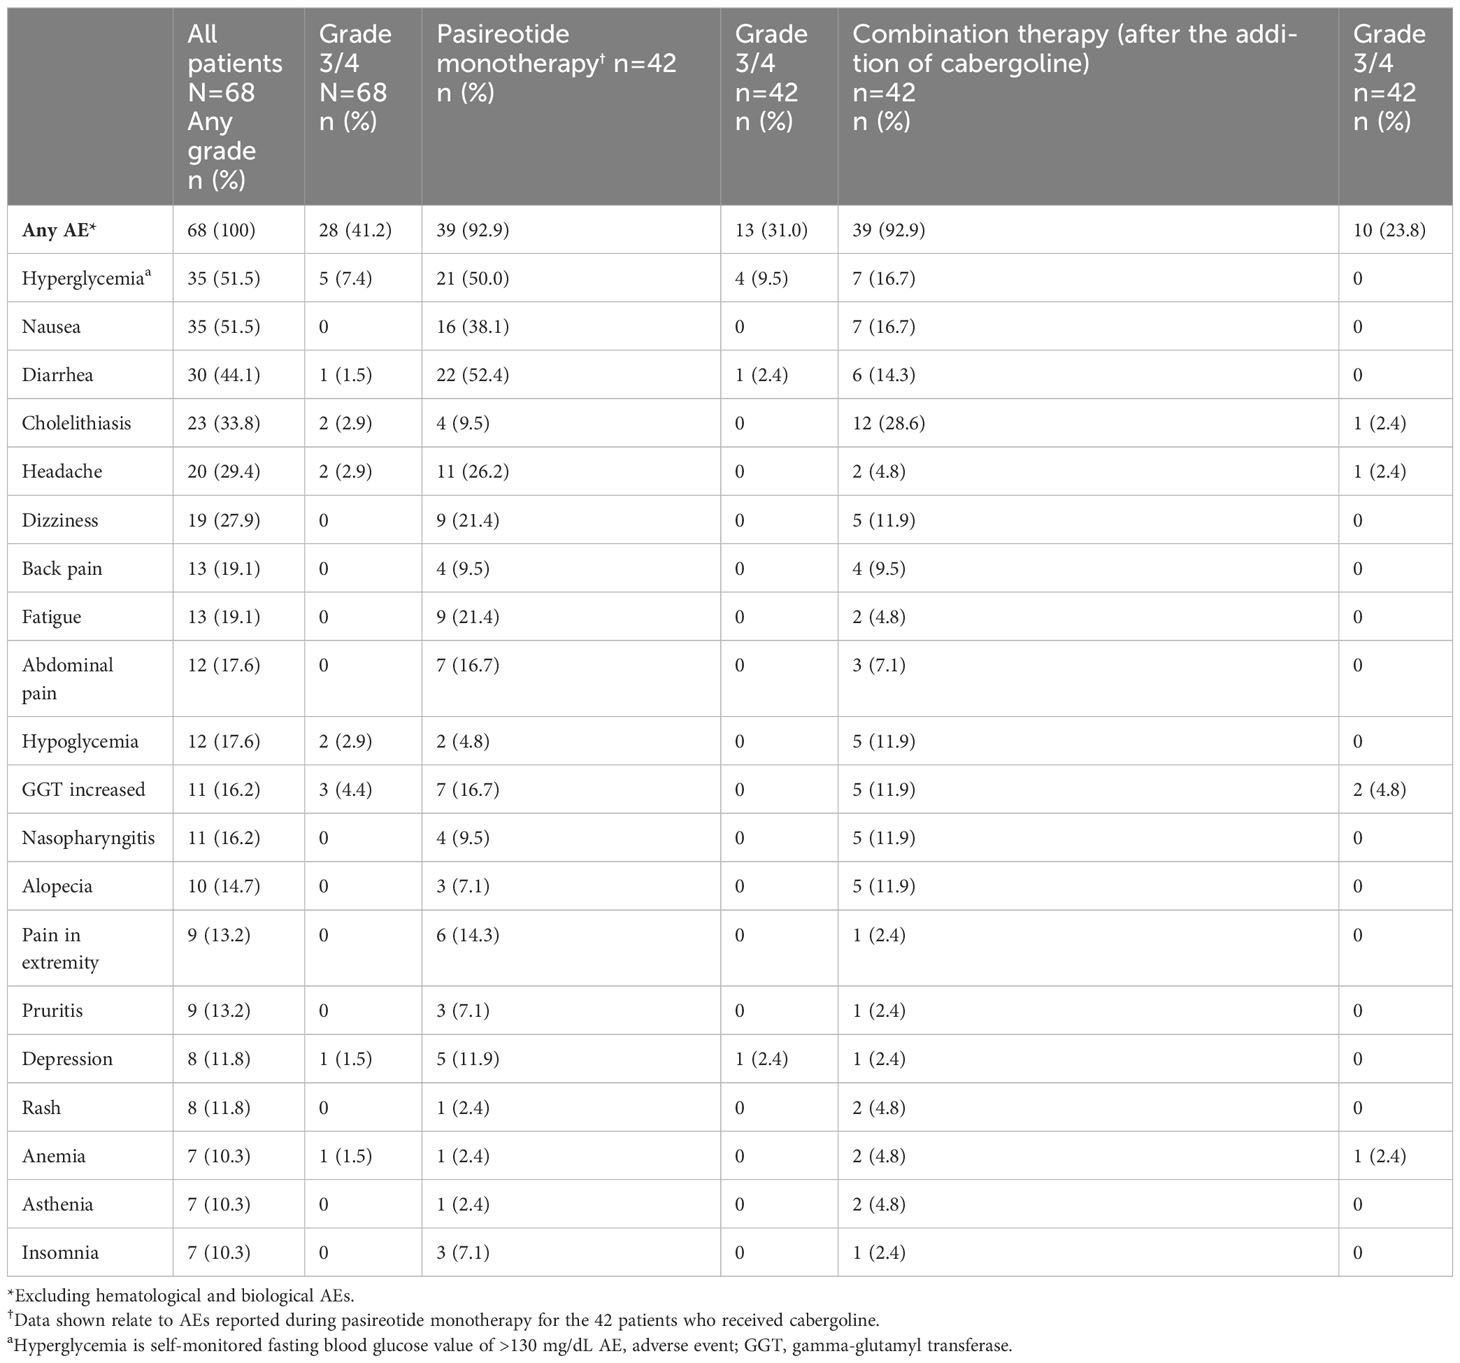
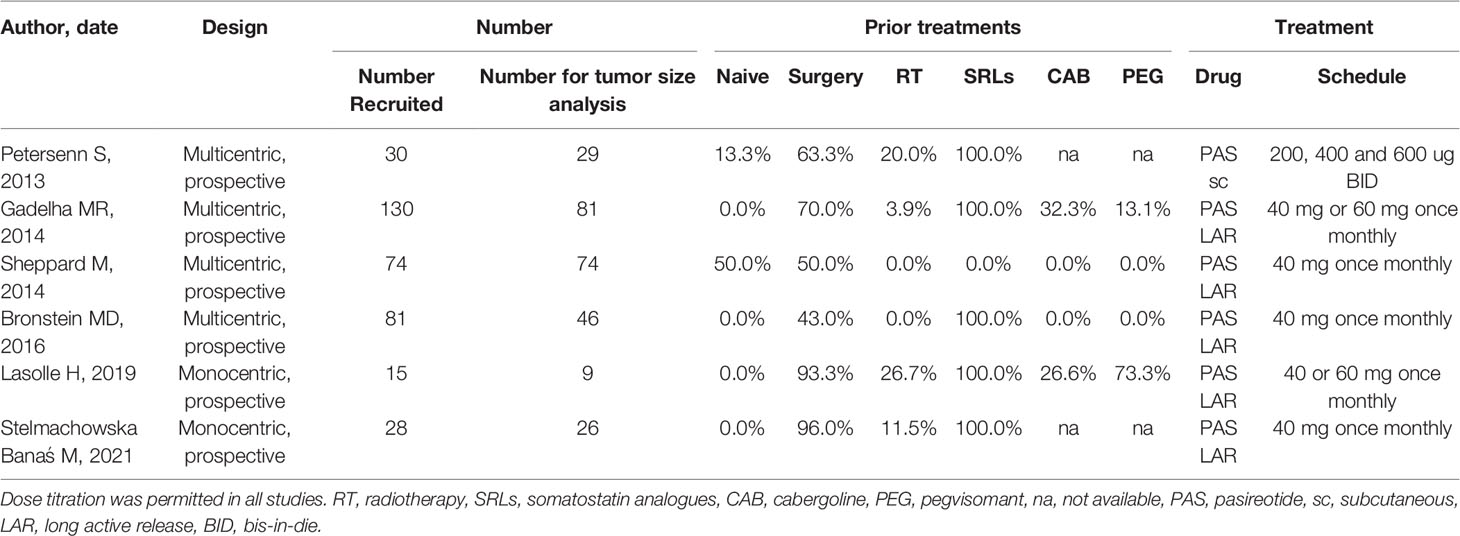
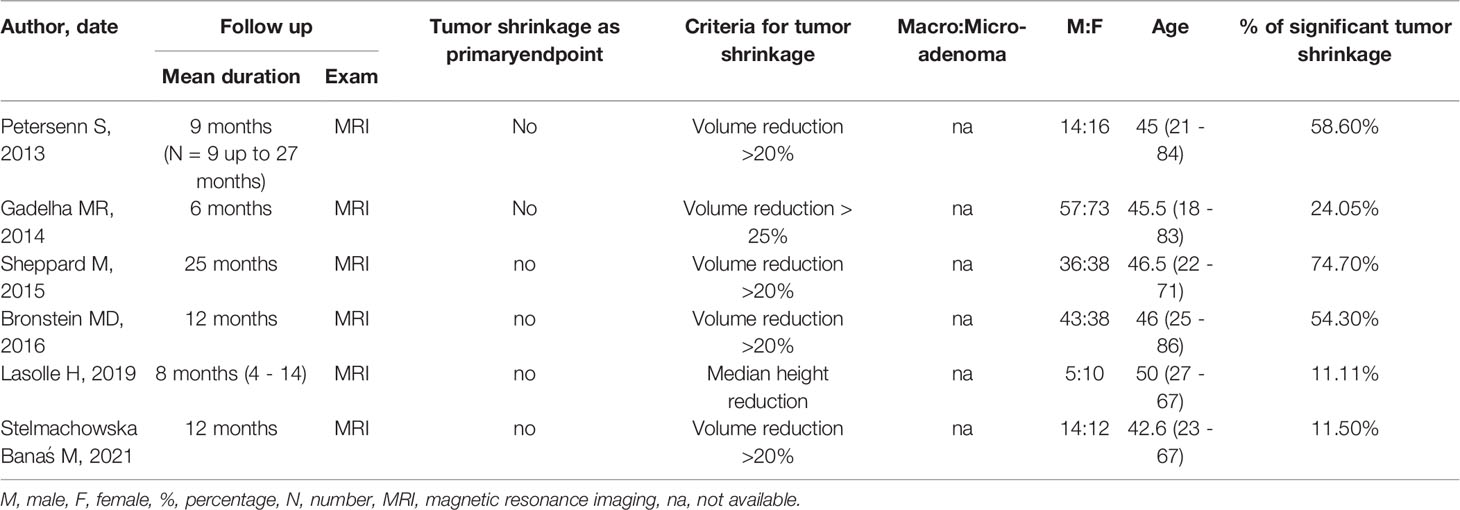
Several studies, performed with different designs, evaluated the impact of pasireotide on glucose metabolism. The principal results are summarized in Table 1.5–8,78–85

Table 1 Main Studies Regarding the Use of Pasireotide in Acromegaly and in Cushing’s Disease

It’s undeniable that impairment of glucose metabolism occurred: generally, in all studies the number of subjects with diabetes and prediabetes increased, HbA1c levels were higher and anti-hyperglycemic treatments were required. Metformin, DPP-4i and insulin were commonly used to treat hyperglycemia, whereas GLP-1 RAs and SGLT2-i were given only in a small number of cases.

Nevertheless, a recent randomized multicenter study involving 81 patients with acromegaly or CD receiving pasireotide86 and uncontrolled hyperglycemia with metformin or other oral antidiabetic medications (acarbose or sulfonylureas), evaluated the effects of two different regimens of treatment (incretin-based therapy vs insulin). All 38 patients randomized to an incretin-based therapy (acromegaly, n = 26; CD, n =12) received sitagliptin; 28 of them switched to liraglutide. Twelve patients (31.6% [CD, n = 6; acromegaly, n = 6]) randomized to incretin-based therapy received insulin as rescue therapy. The results have shown a trend for better control of HbA1c with incretin-based therapy. Furthermore, in the same study, 109 patients who received pasireotide did not develop hyperglycemia requiring antidiabetic treatment.86 These findings suggest that impaired glucose metabolism or onset of DM during pasireotide therapy are manageable in most patients, without the need for treatment discontinuation.

Accordingly, given the above-mentioned evidence, glycemia should be monitored in all patients treated with pasireotide in order to intercept an initial alteration of glucose metabolism which could be either prediabetes or DM, according to the indications of ADA.87 In patients treated with pasireotide, FBG and HbA1c levels tend to increase during the first 1–3 months of treatment and stabilize thereafter.88

Regarding CD, in 2014, a medical expert recommendation on pasireotide-induced hyperglycemia was published.89 In this, an HbA1c target value less than 7.0–7.5% (53–58 mmol/L) is established, avoiding as much as possible the risk of hypoglycemia. Patients in euglycemia prior to therapy must be monitored: they should self-check FBG and postprandial glucose (PPG) levels during the day, precisely twice in the first week and once weekly later. Instead, patients with prediabetes and DM must be monitored closely (after 1, 2 and 4 weeks), and they should self-check blood glucose values up to six times per day during the first week, and at least four times per day thereafter.26,89

Medical treatment should always include dietary modification and exercise. Metformin is the first line-therapy, unless contraindicated or not tolerated. If glycemic control is not reached or maintained with monotherapy, combination therapy with drugs targeting the incretinic axis is recommended:89 a Phase I study90 in 19 healthy volunteers randomized to pasireotide 600 μg sc bid alone or co-administered with antidiabetic drugs (metformin 500 mg bid, nateglinide 60 mg tid, vildagliptin 50 mg bid and liraglutide 0.6 daily) demonstrated greater effects of vildagliptin and liraglutide in minimizing hyperglycemia.

Therefore, therapy with a DDP-4i is suggested in a first step combination. Only in the case of failure to reach the HbA1c target, the replace of DDP-4i with a GLP-1 RAs is recommended. If pasireotide-induced hyperglycemia remains uncontrolled with combinations containing metformin and DPP-4i or GLP-1 RAs, experts’ recommendations suggest the beginning of basal insulin therapy. If the individual HbA1c targets are not achieved or the postprandial glucose levels remains elevated, prandial insulin can be added.89

Instead, in acromegaly, a very interesting experts’ consensus statement regarding the management of pasireotide-induced hyperglycemia has been recently published.91 It suggests monitoring blood glucose prior to initiation of pasireotide treatment, through the determination of HbA1c or FBG or the execution of OGTT. Patients are divided into three risk categories related to glycemic status: normal glucose tolerance (NGT) patients at low risk, NGT patients at high risk and prediabetic or diabetic patients. In low-risk patients with no worsening of glycemic control, self-measurement of blood glucose (FBG and PPG) once every week is considered sufficient. In high-risk patients who do not have elevated blood glucose levels, weekly self-monitoring (FBG and PPG) is recommended in the first three months. In patients with pre-existing hyperglycemia, daily self-monitoring in recommended with at least one FBG and one PPG, ideally as multiple-point profiles.91 Further, when possible and economically feasible, high-risk patients should temporarily be equipped with continuous glucose monitors (CGMs) to detect elevated blood glucose levels early and determine deviations from the time in range precisely. During treatment with pasireotide, HbA1c measurements should be routinely performed every three months and at least with each IGF-1measurement.91

For the treatment of hyperglycemia, this recent experts’ consensus statement represents an important leap forward from a conceptual point of view. As a matter of fact, glycemic targets are not strictly fixed but an individualized approach for each patient is suggested. Moreover, CV risk is introduced as a factor influencing the choice of antidiabetic drugs.

Obviously, lifestyle intervention (physical activity, healthy sleep, high-quality nutrition) is always suggested. Metformin is indicated as a first-line medication but, considering the high CV risk of acromegalic subjects, GLP-1 RAs with proven CV benefits could also be considered as a first-line treatment. DPP-4i are considered a viable alternative to GLP-1 RAs in case of gastrointestinal side-effects.91

However, studies demonstrated that 10–30% of acromegalic patients show a paradoxical increase in GH (PI-GH) during 75-g OGTT.3 This is probably due to the action of GIP, which is higher in acromegalic patients, particularly in those with hyperglycemia, and that is likely able to increase the secretion of GH.92,93 As is well known, DPP-4i reduce the incretin-degrading enzyme DPP-4 and thus increase the concentration of active incretins, including GIP. Accordingly, a recent study showed that sitagliptin, administered one hour before 75-g OGTT, increase GH in acromegalic patients, especially in those with PI-GH.94 For this reason, acromegalic patients should be carefully monitored for a potential worsening of the underlying disease during treatment with a DPP- 4i.

The use of SGLT2-i is recommended only as second-line treatment for patients with high CV risk and/or renal disease, despite their high prevalence in acromegaly.91 This is justified by the increased risk of diabetic ketoacidosis (DKA), a severe condition related to treatment with SGLT2-i, in acromegalic subjects.95–97 However, patients safely treated with pasireotide and SGLT2-i are reported.98

The addition of insulin may be considered, but it should ideally be used as an adjunct to metformin and at least one other therapeutic agent.

Obviously, in case of poor glycemic control despite treatment with several anti-hyperglycemic drugs, the dose reduction or even the discontinuation of pasireotide should be considered.

A Potential Change of Perspective and Open Issues

Considering the complex cardiovascular profile of patients with acromegaly and CD, a much greater use of GLP-1 RAs and SGLT2-i might be necessary if DM occurs. There are at least three important aspects that support this consideration: glycemic control, cardiovascular protection, and weight loss.

Accordingly, both in acromegaly and CD, the use of GLP-1 RAs contributes to the achievement of these three main goals, providing an important possibility to enhance the quality of life and to decrease the mortality of patients, with evident advantages compared to DDP-4i and insulin.86,91,99 In this regard, co-agonists of GLP-1 and GIP, such as tirzepatide, with their extraordinary impact in terms of HbA1c reduction and weight loss, represent a theoretically intriguing therapeutic option for the future, despite the current lack of data in acromegaly and CD.

SGLT2-i are not included in the expert recommendations for the patients with CD.89 Currently, there is not enough evidence to support their use, even if their impact on cardiorenal risk might be valuable.

The same reasoning could apply to the acromegalic subjects. In particular, the very favorable benefit of SGLT2-i on HF risk could be extremely crucial.

A proposal for an approach to contrasting hyperglycemia, also taking into account the higher cardio-renal risk, in acromegaly and CD is depicted in Figure 1.

Figure 1 Proposal for a new approach to treat hyperglycemia in patients with acromegaly or Cushing’s Disease, with or without pasireotide treatment. The restoration of euglycemia should be achieved with concomitant reduction in terms of weight and cardiovascular risk, improving quality of life and decreasing mortality.

Notes: The choice of anti-hyperglycemic drugs should be driven by high CV risk and not by the concomitant treatment for acromegaly and CD. In patients with dual therapy at baseline (Metformin + SGLT2-i or GLP-1 RAs) and glycemic control not achieved, follow the same indications reported in the figure. Consider DPP-4i in case of intolerance at SGLT2-i and GLP-1 Ras; Consider BASAL INSULIN as first therapy in case of severe glycometabolic state (HbA1c > 10%, FBG > 300 mg/dL, clinical signs of catabolism). In patients with high risk of ketoacidosis and positive anamnesis for recurrent genitourinary infections, SGLT2-i should be avoided.

Potential limits are higher costs and the risk of AEs. It is well known that the most common AEs of GLP-1 RAs are gastrointestinal (nausea, vomiting, and diarrhea) and tend to occur during initiation and dose escalation, diminishing over time.100 Same AEs are noted with pasireotide, even if described as non-severe.

Another AE common to both treatments (pasireotide and GLP-1 RAs) are cholelithiasis and gallbladder disease. Different meta-analysis of RCTs confirmed that GLP1-RAs are associated with an increased risk of cholelithiasis, in the absence of any relevant increase in the risk of pancreatitis and pancreatic cancer.101,102 It is notable that in the study which compared incretin-based and insulin therapy, patients in the latter group had a higher incidence of gallbladder or biliary-related AEs (23.3% vs 13.2%).86

Instead, as reported in the recent consensus about the management of hyperglycemia in acromegaly, a potential limit for the use of SGLT2-i is the risk of DKA, a condition characterized by hyperglycemia, metabolic acidosis and ketosis (pH ≤ 7.3, bicarbonate ≤ 15 mmol/L, anion gap > 12 mmol/L), fortunately rare in acromegaly, considering it concerns only 1% of all cases and it often occurs only in the initial disease manifestation.103 During treatment with SGLT2-i, DKA occurs in the absence of hyperglycemia, and so it also known as euglycemic diabetic ketoacidosis (EuDKA).104 The suggested mechanism behind the EuDKA is the reduction of insulin requirement in patient treated with SGLT2-i due to massive glycosuria, with concomitant increased gluconeogenesis (driven by an increase of glucagon), release of free fatty acid and subsequent propensity to ketone production.105

It is noteworthy that GH and cortisol themselves increase lipolysis, the lipid oxidation rate and so ketone bodies. Moreover, the shift in the insulin/glucagon ratio as observed in pasireotide treatment is thought to be especially prone to this metabolic complication, warranting greater caution.103

It’s essential to consider the higher risk of DKA or EuDKA during treatment with SGLT2-i, but it’s equally necessary to specify that their incidence appears significantly lower compared to that of a fatal cardiovascular event, both in acromegaly and CD. As a matter of fact, a multicenter retrospective study, during 2015–2020, in 9940 persons with T2DM treated with SGLT2-i has shown that the overall prevalence of DKA is around 0.43% (with 0.25% for EuDKA).106 Furthermore, even some real-life evaluations conducted in subjects with Type 1 Diabetes, a clinical condition with a well-known high risk of DKA and in which the use of SGLT2-i is actually contraindicated, have shown similar data: Stougard et al107 have observed an incidence of DKA equal to 0% in patients treated with SGLT2-i whereas Anson et al108 have observed a lower risk of DKA and associated hospitalization in subjects treated with SGLT-2i compared to those treated with GLP-1 RAs (obviously, as an adjunct to insulin therapy).

Additionally, in acromegalic subjects treated with pegvisomant, in monotherapy or in combination with pasireotide, the incidence of the EuDKA should be reduced. In fact, a reciprocal positive interaction could be achieved because SGLT2-i attenuate the hyperglycemic effect by decreased insulin secretion, meanwhile pasireotide in combination with pegvisomant mitigates the hyperglucagonemia induced by SGLT2-i. Also, pegvisomant decreases lipid oxidation via extrahepatic suppression of Growth Hormone Receptor in different tissues.109

Hence, it seems reasonable to encourage the use of SGLT2-i even in acromegalic patients treated with pasireotide, especially in those with well-controlled disease, modest hyperglycemia and undergoing combined treatment with pegvisomant. It should be helpful to advise them to discontinue therapy with SGLT2-i in case of intercurrent illnesses that may cause a reduction in carbohydrates intake and dehydration (eg, infections and gastroenteritis), and to not skip doses in the case of contextual insulin therapy. SGLT2-i should be avoided in patients with poorly controlled disease.

The same considerations could also be applied to patients with poorly controlled CD.

Another potential limit for the use of SGLT2-i, especially in CD patients for the overall increased risk of infection in this disease, is the higher prevalence of genitourinary infections, reported in both clinical trials and real world evidence. These infectious events are usually mild, and their prevalence is related to sex and a prior positive history of genital infections. In fact, the risk appears higher in females, and among them, in those with previous infections.110 Moreover, it is interesting to underline that in the study of McGovern et al110 the use of corticosteroids, a clinical condition similar to CD, higher values of HbA1c were not associated with significant additional infection risk in subjects treated with SGLT2-i.

Therefore, it is good clinical practice to suggest meticulous intimate hygiene to patients treated with SGLT-2i, avoiding the use of this class of drugs in those with positive anamnesis for genitourinary infections, especially for females.

It is also worth noting that neither GLP-1 RAs nor SGLT2-i cause hypoglycemia, another condition that significantly increases cardiovascular risk and mortality, as demonstrated in the ACCORD trial.111

Finally, a recent case report112 showed the positive effect of a combined therapy of GLP-1 RAs and SGLT2-i on pasireotide-induced hyperglycemia in a patient with CD. After the failure of metformin and DPP-4i, multiple daily insulin injections and, after two days, dulaglutide 0.75 mg were initiated. After improvement of glycemic control, 10 mg of empagliflozin was started and insulin discontinued. After 3 months, hypercortisolemia and glucose impairment were well-regulated, and the patient’s health improved overall.112

Despite several limits (not optimal use of insulin, short follow-up, lack of data regarding other parameters), this is an example of a treatment that is not glycemic-centered but focused to prevent and improve hypercortisolemia-related complications.

Needless to say, further investigations are needed to analyze the above-mentioned considerations and to overcome the limited findings available.

Ethics Statement

This article is based on previously conducted studies and does not contain any new studies with human participants or animals performed by any of the authors.

Author Contributions

All authors made a significant contribution to the work reported, whether that is in the conception, study design, execution and considerations, or in all these areas; took part in drafting, revising or critically reviewing the article; gave final approval of the version to be published; have agreed on the journal to which the article has been submitted; and agree to be accountable for all aspects of the work.

Funding

The authors did not receive support from any organization for the submitted work.

Disclosure

The authors declare that they have no competing interests in this work.

References

1. Sanno N, Teramoto A, Osamura RY, et al. Pathology of pituitary tumors. Neurosurg Clin N Am. 2003;14(1):25–39. doi:10.1016/s1042-3680(02)00035-9

2. Tritos NA, Miller KK. Diagnosis and management of pituitary adenomas: a review. JAMA. 2023;239(16):1386–1389. doi:10.1001/jama.2023.5444

3. Katznelson L, Laws ER, Helmed S, et al. Acromegaly: an Endocrine Society clinical practice guideline. J Clin Endocrinol Metab. 2014;99(11):3933–3951. doi:10.1210/jc.2014-2700

4. Nieman LK, Biller BMK, Findling JW, et al. Treatment of Cushing’s syndrome: an Endocrine Society clinical practice guidelines. J Clin Endocrinol Metab. 2015;100(8):2807–2831. doi:10.1210/jc.2015-1818

5. Colao A, Bronstein MD, Freda P, et al. Pasireotide versus octreotide in acromegaly: a head-to-head superiority study. J Clin Endocrinol Metab. 2014;99(3):791–799. doi:10.1210/jc.2013-2480

6. Gadelha MR, Bronstein MD, Brue T, et al. Pasireotide versus continued treatment with octreotide or lanreotide in patients with inadequately controlled acromegaly (PAOLA): a randomised, Phase 3 trial. Lancet Diabetes Endocrinol. 2014;2(11):875–884. doi:10.1016/S2213-8587(14)70169-X

7. Colao A, Petersenn S, Newell-Price J, et al. A 12-month Phase 3 study of pasireotide in Cushing’s disease. N Engl J Med. 2012;366(10):914–924. doi:10.1016/S2213-8587(14)70169-X

8. Lacroix A, Gu F, Gallardo W, et al. Efficacy and safety of once-monthly pasireotide in Cushing’s disease: a 12 month clinical trial. Lancet Diabetes Endocrinol. 2018;6(1):17–26. doi:10.1016/S2213-8587(17)30326-1

9. Pivonello R, Auriemma RS, Grasso LF, et al. Complications of acromegaly, cardiovascular, respiratory and metabolic comorbidities. Pituitary. 2017;20:46–62. doi:10.1007/s11102-017-0797-7

10. Li D, El Kawkgi OM, Henriquez AF, Bancos I. Cardiovascular risk and mortality in patients with active and treated hypercortisolism. Gland Surg. 2020;9(1):43–58. doi:10.21037/gs.2019.11.03

11. Ershadinia N, Tritos NA. Diagnosis and treatment of acromegaly: an update. Mayo Clin Proc. 2022;97:333–346. doi:10.1016/j.mayocp.2021.11.007

12. Ferraù F, Albani A, Ciresi A, Giordano C, Cannavò S. Diabetes secondary to acromegaly, physiopathology, clinical features and effects of treatment. Front Endocrinol. 2018;9:358. doi:10.3389/fendo.2018.00358

13. Dal J, List EO, Jørgensen JOL, Berryman DE. Glucose and fat metabolism in acromegaly: from mice models to patient care. Neuroendocrinology. 2015;103:96–105. doi:10.1159/000430819

14. Del Rincon JP, Iida K, Gaylinn BD, et al. Growth hormone regulation of p85α expression and phosphoinositide 3-kinase activity in adipose tissue. Diabetes. 2007;56:1638–1646. doi:10.2337/db06-0299

15. Moustaki M, Paschou SA, Xekouki P, et al. Secondary diabetes mellitus in acromegaly. Endocrine. 2023;81(1):1–15. doi:10.1007/s12020-023-03339-1

16. Kasayama S, Otsuki M, Takagi M, et al. Impaired β-cell function in the presence of reduced insulin sensitivity determines glucose tolerance status in acromegalic patients. Clin Endocrinol. 2000;52:549–555. doi:10.1046/j.1365-2265.2000.00986.x

17. Kinoshita Y, Fujii H, Takeshita A, et al. Impaired glucose metabolism in Japanese patients with acromegaly is restored after successful pituitary surgery if pancreatic β-cell function is preserved. Eur J Endocrinol. 2011;164:467–473. doi:10.1530/EJE-10-1096

18. Frara S, Maffezzoni F, Mazziotti G, Giustina A. Current and emerging aspects of diabetes mellitus in acromegaly. Trends Endocrinol Metab. 2016;27:470–483. doi:10.1016/j.tem.2016.04.014

19. Popovicu MS, Paduraru L, Nutas RM, et al. Diabetes mellitus secondary to endocrine diseases: an update of diagnostic and treatment particularities. Int J Mol Sci. 2023;24(16):12676. doi:10.3390/ijms241612676

20. Scaroni C, Zilio M, Foti M, Boscaro M. Glucose metabolism abnormalities in Cushing syndrome: from molecular basis to clinical management. Endocr Rev. 2017;38(3):189–219. doi:10.1210/er.2016-1105

21. Barbot M, Ceccato F, Scaroni C. Diabetes mellitus secondary to Cushing’s disease. Front Endocrinol. 2018;5(9):284. doi:10.3389/fendo.2018.00284

22. Pivonello R, De Leo M, Vitale P, et al. Pathophysiology of diabetes mellitus in Cushing’s syndrome. Neuroendocrinology. 2010;92(Suppl 1):77–81. doi:10.1159/000314319

23. Brennan-Speranza TC, Henneicke H, Gasparini SJ, et al. Osteoblasts mediate the adverse effects of glucocorticoids on fuel metabolism. J Clin Investig. 2012;122:4172–4189. doi:10.1172/JCI63377

24. Eriksen M, Jensen DH, Tribler S, Holst JJ, Madsbad S, Krarup T. Reduction of insulinotropic properties of GLP-1 and GIP after glucocorticoid-induced insulin resistance. Diabetologia. 2015;58(5):920–928. doi:10.1007/s00125-015-3522-y

25. Jensen DH, Aaboe K, Herniksen JE, et al. Steroid-induced insulin resistance and impaired glucose tolerance are both associated with a progressive decline of incretin effect in first-degree relatives of patients with type 2 diabetes mellitus. Diabetologia. 2012;55(5):1406–1416. doi:10.1007/s00125-012-2459-7

26. Vergès B. Effects of anti-somatostatin agents on glucose metabolism. Diabetes Metab. 2017;43(5):411–415. doi:10.1016/j.diabet.2017.05.003

27. Silvertstein JM. Hyperglycemia induced by Pasireotide in patients with Cushing’s disease or acromegaly. Pituitary. 2016;19:536–543. doi:10.1007/s11102-016-0734-1

28. Puglisi S, Ferraù F, Ragonese M, Spagnolo F, Cannavò S. Cardiometabolic risk in acromegaly: a review with a focus on pasireotide. Front Endocrinol. 2020;11:28. doi:10.3389/fendo.2020.00028

29. Coulden A, Hamblin R, Wass J, Karavitaki N. Cardiovascular health and mortality in Cushing’s disease. Pituitary. 2022;25(5):750–753. doi:10.1007/s11102-022-01258-4

30. Puglisi S, Terzolo M. Hypertension and acromegaly. Endocrinol Metab Clin North Am. 2019;48:779–793. doi:10.1016/j.ecl.2019.08.008

31. Petrossians P, Daly AF, Natchev E, et al. Acromegaly at diagnosis in 3173 patients from the Liege Acromegaly Survey (LAS) Database. Endocr Relat Cancer. 2017;24(10):505–518. doi:10.1530/ERC-17-0253

32. Sharma AN, Tan M, Amsterdam EA, Singh GD. Acromegalic cardiomyopathy: epidemiology, diagnosis and management. Clin Cardiol. 2018;41(3):419–425.

33. Colao A, Marzullo P, Di Somma C, Lombardi G. Growth hormone and the heart. Clin Endocrinol. 2001;54(2):137–154. doi:10.1046/j.1365-2265.2001.01218.x

34. Marstrand P, Han L, Day SM, et al. Hypertrophic cardiomyopathy with left ventricular systolic dysfunction: insights from the SHaRe Registry. Circulation. 2020;141(17):1371–1383. doi:10.1161/CIRCULATIONAHA.119.044366

35. Davì MV, Giustina A. Sleep apnea in acromegaly, a review on prevalence, pathogenetic aspects and treatment. Expert Rev Endocrinol Metab. 2012;7:55–62. doi:10.1586/eem.11.82

36. Ragnarsson O, Olsson DS, Papakokkinou E, et al. Overall and disease-specific mortality in patients with Cushing disease: a Swedish nationwide study. J Clin Endocrinol Metab. 2019;104(6):2375–2384. doi:10.1210/jc.2018-02524

37. Colao A, Pivonello R, Spiezia S, et al. Persistence of increased cardiovascular risk in patients with Cushing’s disease after five years of successful care. J Clin Endocrinol Metab. 1999;84(8):2664–2672. doi:10.1210/jcem.84.8.5896

38. Varlamov EV, Langlois F, Vila G, Fleseriu M. Management of endocrine disease: cardiovascular risk assessment, thromboembolism, and infection prevention in Cushing’s syndrome: a practical approach. Eur J Endocrinol. 2021;184(5):R207–R224. doi:10.1530/EJE-20-1309

39. Fallo F, Di Dalmazi G, Beuschlein F, et al. Diagnosis and management of hypertension in patients with Cushing’s syndrome: a position statement and consensus of the Working Group on Endocrine Hypertension of the European Society of Hypertension. J Hypertens. 2022;40(11):2085–2101. doi:10.1097/HJH.0000000000003252

40. Giordano R, Picu A, Marinazzo E, et al. Metabolic and cardiovascular outcomes in patients with Cushing’s syndrome of different aetiologies during active disease and 1 year after remission. Clin Endocrinol. 2011;75(3):354–360. doi:10.1111/j.1365-2265.2011.04055.x

41. Faggiano A, Pivonello R, Spiezia S, et al. Cardiovascular risk factors and common carotid artery caliber and stiffness in patients with Cushing’s disease during active disease and 1 year after disease remission. J Clin Endocrinol Metab. 2003;88(6):2527–2533. doi:10.1210/jc.2002-021558

42. Toja PM, Branzi G, Ciambellotti F, et al. Clinical relevance of cardiac structure and function abnormalities in patients with Cushing’s syndrome before and after cure. Clin Endocrinol. 2012;76(3):332–338. doi:10.1111/j.1365-2265.2011.04206.x

43. Bruns C, Lewis I, Briner U, Meno-Tetang G, Weckbecker G. SOM230: a novel somatostatin peptidomimetic with broad somatotropin release inhibiting factor (SRIF) receptor binding and a unique antisecretory profile. Eur J Endocrinol. 2002;146(5):707–716. doi:10.1530/eje.0.1460707

44. Moloney KJ, Mercado JU, Ludlam WH, Mayberg MR. Pasireotide (SOM230): a novel pituitary-targeted medical therapy for the treatment of patients with Cushing’s disease. Expert Rev Endocrinol Metab. 2012;7(5):491–502. doi:10.1586/eem.12.49

45. Singh V, Brendel MD, Zacharias S, et al. Characterization of somatostatin receptor subtype-specific regulation of insulin and glucagon secretion: an in vitro study on isolated human pancreatic islets. J Clin Endocrinol Metab. 2007;92:673–680. doi:10.1210/jc.2006-1578

46. Henry RR, Ciaraldi TP, Armstrong D, Burke P, Ligueros-Saylan M, Mudaliar S. Hyperglycaemia associated with pasireotide: results from a mechanistic study in healthy volunteers. J Clin Endocrinol Metab. 2013;98:3446–3453. doi:10.1210/jc.2013-1771

47. Barbot M, Mondin A, Regazzo D, et al. Incretin response to mixed meal challenge in active Cushing’s disease and after pasireotide therapy. Int J Mol Sci. 2022;23:5217. doi:10.3390/ijms23095217

48. Schmid AH, Brueggen J. Effects of somatostatin analogs on glucose homeostasis in rats. J Endocrinol. 2012;212:49–60. doi:10.1530/JOE-11-0224

49. MacKenzie Feder J, Bourdeau I, Vallette S, Beauregard H, Marie LG S, Lacroix A. Pasireotide monotherapy in Cushing’s disease: a single-centre experience with 5-year extension of phase III trial. Pituitary. 2014;17(6):519–529. doi:10.1007/s11102-013-0539-4

50. Golor G, Hu K, Ruffin M, et al. A first-in-man study to evaluate the safety, tolerability, and pharmacokinetics of pasireotide (SOM230), a multireceptor-targeted somatostatin analog, in healthy volunteers. Drug Des Devel Ther. 2012;6:71–79. doi:10.2147/DDDT.S29125

51. Feelders RA, Pulgar SJ, Kempel A, Pereira AM. The burden of Cushing’s disease: clinical and health-related quality of life aspects. Eur J Endocrinol. 2012;167(3):311–326. doi:10.1530/EJE-11-1095

52. Shen G, Darstein C, Hermosillo Resendiz K, Hu K. Pharmacokinetic and pharmacodynamic analyses of pasireotide LAR and octreotide LAR: randomized, double-blind, phase III study in patients with medically naïve acromegaly. Poster presented at: European congress of endocrinology; May 3–7; 2014; Wroclaw, Poland.

53. Shen G, Darstein C, Hermosillo Resendiz K, Hu K. Analysis of pharmacokinetic (PK) and pharmacodynamic (PD) data for efficacy and safety from a randomized phase III study of pasireotide LAR in patients with acromegaly inadequately controlled on first-generation somatostatin analogs (SSA). Poster presented at: Endocrine society annual meeting; March 5–8; 2015; San Diego, CA.

54. Gadelha MR, Gu F, Bronstein MD, et al. Risk factors and management of pasireotide-associated hyperglycemia in acromegaly. Endocr Connect. 2020;9(12):1178–1190. doi:10.1530/EC-20-0361

55. Sheppard M, Bronstein MD, Freda P, et al. Pasireotide LAR maintains inhibition of GH and IGF-1 in patients with acromegaly for up to 25 months: results from the blinded extension phase of a randomized, double- blind, multicenter, phase III study. Pituitary. 2015;18(3):385–394. doi:10.1007/s11102-014-0585-6

56. Boscaro M, Bertherat J, Findling J, et al. Extended treatment of Cushing’s disease with pasireotide: results from a 2-year, Phase II study. Pituitary. 2014;17(4):320–326. doi:10.1007/s11102-013-0503-3

57. Higham CE, Atkinson AB, Aylwin S, et al. Effective combination treatment with cabergoline and low-dose pegvisomant in active acromegaly: a prospective clinical trial. J Clin Endocrinol Metab. 2012;97:1187–1193. doi:10.1210/jc.2011-2603

58. van der Lely AJ, Hutson RK, Trainer PJ, et al. Long-term treatment of acromegaly with pegvisomant, a growth hormone receptor antagonist. Lancet. 2001;358:1754–1759. doi:10.1016/s0140-6736(01)06844-1

59. Schreiber I, Buchfelder M, Droste M, et al. Treatment of acromegaly with the GH receptor antagonist pegvisomant in clinical practice: safety and efficacy evaluation from the German Pegvisomant Observational Study. Eur J Endocrinol. 2007;156:75–82. doi:10.1530/eje.1.02312

60. Castinetti F, Guignat L, Giraud P, et al. Ketoconazole in Cushing’s disease: is it worth a try? J Clin Endocrinol Metab. 2014;99(5):1623–1630. doi:10.1210/jc.2013-3628

61. Valassi E, Crespo I, Gich I, Rodrìguez J, Webb SM. A reappraisal of the medical therapy with steroidogenesis inhibitors in Cushing’s syndrome. Clin Endocrinol. 2012;77:735–742. doi:10.1111/j.1365-2265.2012.04424.x

62. Gadelha M, Bex M, Feelders RA, et al. Randomized trial of osilodrostat for the treatment of Cushing’s disease. J Clin Endocrinol Metab. 2022;107(7):e2882–e2895. doi:10.1210/clinem/dgac178

63. Davies MJ, Aroda VR, Collins BS, et al. Management of hyperglycemia in type 2 diabetes. A consensus report by the American Diabetes Association (ADA) and the European Association for the Study of Diabetes (EASD). Diabetes Care. 2022;45(11):2753–2786. doi:10.2337/dci22-0034

64. Tsapas A, Avgerinos I, Karagiannis T, et al. Comparative effectiveness of glucose-lowering drugs for type 2 diabetes: a systematic review and network meta-analysis. Ann Intern Med. 2020;173:278–286. doi:10.7326/M20-0864

65. Tsapas A, Karagiannis T, Kakotrichi P, et al. Comparative efficacy of glucose-lowering medications on body weight and blood pressure in patients with type 2 diabetes: a systematic review and network meta-analysis. Diabetes Obes Metab. 2021;23:2116–2124. doi:10.1111/dom.14451

66. Marso SP, Daniels GH, Brown-Frandsen K, et al.; for the LEADER Steering Committe on behalf of the LEADER Trial Investigators. Liraglutide and cardiovascular outcomes in type 2 diabetes. N Engl J Med. 2016;375:311–322. doi:10.1056/NEJMoa1603827

67. Gerstein HC, Colhoun HM, Dagenais GR, et al.; for the REWIND Investigators. Dulaglutide and cardiovascular outcomes in type 2 diabetes (REWIND): a double-blind, randomised placebo-controlled trial. Lancet. 2019;394:121–130. doi:10.1016/S0140-6736(19)31149-3

68. Marso SP, Bain CS, Consoli A, et al.; for the SUSTAIN-6 Investigators. Semaglutide and cardiovascular outcomes in patients with type 2 diabetes. N Eng J Med. 2016;375:1834–1844. doi:10.1056/NEJMoa1607141

69. Zinman B, Wanner C, Lachin JM, et al.; for the EMPA-REG OUTCOME Investigators. Empagliflozin, cardiovascular outcomes, and mortality in type 2 diabetes. N Engl J Med. 2015;375:2117–2128. doi:10.1056/NEJMoa1504720

70. Neal B, Perkovic V, Mahaffey KW, et al.; for the CANVAS Program Collaborative group. Canagliflozin and cardiovascular and renal events in type 2 diabetes. N Engl J Med. 2017;377:644–657. doi:10.1056/NEJMc1712572

71. The EMPA-KIDNEY Collaborative group. Empagliflozin in patients with chronic kidney disease. N Engl J Med. 2023;388:117–127. doi:10.1056/NEJMoa2204233

72. Heerspink HJL, Stefánsson BV, Correa-Rotter R, et al.; for the DAPA-CKD Trial committees and investigators.. Dapagliflozin in patients with chronic kidney disease. N Engl J Med. 2020;383:1436–1446. doi:10.1056/NEJMoa2024816

73. Perkovic V, Jardine MJ, Neal B, et al.; for the CREDENCE Trial investigators. Canagliflozin and renal outcome in type 2 diabetes and nephropathy. N Engl J Med. 2019;380:2295–2306. doi:10.1056/NEJMoa1811744

74. Packer M, Anker SD, Butler J, et al.; for the EMPEROR-Reduced Trial investigators. Cardiovascular and renal outcomes with empagliflozin in heart failure. N Engl J Med. 2020;383:1413–1424. doi:10.1056/NEJMoa2022190

75. McCurray JJV, Solomon SD, Inzucchi SE, et al.; for the DAPA-HF Trial committees and investigators. Dapagliflozin in patients with heart failure and reduced ejection fraction. N Engl J Med. 2019;381:1995–2008. doi:10.1056/NEJMoa1911303

76. Anker SD, Butler J, Filippatos G, et al.; fort the EMPEROR-Preserved Trial investigators. Empagliflozin in heart failure with a preserved ejection fraction. N Engl J Med. 2021;385:1451–1461. doi:10.1056/NEJMoa2107038

77. Solomon SD, McMurray JJV, Clagget B, et al.; for the DELIVER Trial committees and investigators. Dapagliflozin in heart failure with mildly reduced of preserved ejection fraction. N Engl J Med. 2022;387:1089–1098. doi:10.1056/NEJMoa2206286

78. Fleseriu M, Rusch E, Geer EB; on behalf of the ACCESS Study Investigators. Safety and tolerability of pasireotide long-acting release in acromegaly-results from the acromegaly, open-label, multicenter, safety monitoring program for treating patients who have a need to receive medical therapy (ACCESS) study. Endocrine. 2017;55:247–255. doi:10.1007/s12020-016-1182-4

79. Lasolle H, Ferriere A, Vasilijevic A, Eimer S, Nunes ML, Tabarin A. Pasireotide-LAR in acromegaly patients treated with a combination therapy: a real-life study. Endocr Connect. 2019;8:1383–1394. doi:10.1530/EC-19-0332

80. Witek P, Bolanowski M, Szamotulska K, Wojciechowska-Luzniak A, Jawiarczyk-Przybylowska A, Kaluzny M. The effect of 6 month’s treatment with pasireotide LAR on glucose metabolism in patients with resistant acromegaly in Real-World clinical settings. Front Endocrinol. 2021;10(12):633944. doi:10.3389/fendo.2021.633944

81. Wolf P, Dormoy A, Maione L, et al. Impairment in insulin secretion without changes in insulin resistance explains hyperglycemia in patients with acromegaly treated with pasireotide LAR. Endocr Connect. 2022;11:e220296. doi:10.1530/EC-22-0296

82. Fleseriu M, Petersenn S, Biller BMK, et al. Long-term efficacy and safety of once-monthly pasireotide in Cushing’s disease: a phase III extension study. Clin Endocrinol. 2019;91:776–785. doi:10.1111/cen.14081

83. Pivonello R, Arnaldi G, Scaroni C, et al. The medical treatment with pasireotide in Cushing’s disease: an Italian multicentre experience based on “real-world experience”. Endocrine. 2019;64:657–672. doi:10.3389/fendo.2020.00648

84. Simeoli C, Ferrigno R, De Martino MC, et al. The treatment with pasireotide in Cushing’s disease: effect of long-term treatment on clinical picture and metabolic profile and management of adverse events in the experience of a single center. J Endocrinol Invest. 2020;43:57–73. doi:10.1007/s12020-015-0557-2

85. Sahin S, Karimova G, Özcan SG, Durcan E, Özkaya HM, Kadıoğlu P. Pasireotide treatment in Cushing’s Disease: a single tertiary center’s experience. Turk J Med Sci. 2022;52:467–476. doi:10.55730/1300-0144.5335

86. Samson SL, Gu F, Feldt-Rasmussen U, et al. Managing pasireotide-associated hyperglycemia: a randomized, open-label, Phase IV study. Pituitary. 2021;24:887–903. doi:10.1007/s11102-021-01161-4

87. ElSayed NA, Aleppo G, Aroda VR, et al. Classification and diagnosis of diabetes: standard of Care in Diabetes- 2023. Diabetes Care. 2023;46(Suppl.1):S19–S40. doi:10.2337/dc23-S002

88. Samson SL. Management of hyperglycemia in patients with acromegaly treated with pasireotide LAR. Drugs. 2016;76(13):1235–1243. doi:10.1007/s40265-016-0615-y

89. Colao A, De Block C, Gaztambide MS, Kumar S, Seufert J, Casanueva FF. Managing hyperglycemia in patients with Cushing’s disease treated with pasireotide: medical expert recommendations. Pituitary. 2014;17:180–186. doi:10.1007/s11102-013-0483-3

90. Breitschaft A, Hu K, Hermosillo Resendiz K, Darstein C, Golor G. Management of hyperglycemia associated with pasireotide (SOM230): healthy volunteer study. Diabet Res Clin Pract. 2014;103:458–465. doi:10.1016/j.diabres.2013.12.011

91. Störmann S, Meyhöfer SM, Groener JB, et al. Management of pasireotide-induced hyperglycemia in patients with acromegaly: an experts’ consensus statement. Front Endocrinol. 2024;15:1348990. doi:10.3389/fendo.2024.1348990

92. Peracchi M, Porretti S, Gebbia C, et al. Increased glucose-dependent insulinotropic polypeptide (GIP) secretion in acromegaly. Eur J Endocrinol. 2001;145:R1–R4. doi:10.1530/eje.0.145r001

93. Shekhawat VS, Bhansali S, Dutta P, et al. Glucose-dependent insulinotropic polypeptide (GIP) resistance and β-cell dysfunction contribute to hyperglycaemia in acromegaly. Sci Rep. 2019;9:5646. doi:10.1038/s41598-019-41887-7

94. Oba-Yamamoto C, Kameda H, Miyoshi H, et al. Acromegaly cases exhibiting increased Growth Hormone levels during oral glucose loading with preadministration of dipeptidyl peptidase-4 inhibitor. Intern Med. 2021;60(15):2375–2383. doi:10.2169/internalmedicine.4755-20

95. Quarella M, Walser D, Brandle M, Fournier JY, Bilz S. Rapid onset of diabetic ketoacidosis after SGLT2 inhibition in a patient with unrecognized acromegaly. J Clin Endocrinol Metab. 2017;102(5):1451–1453. doi:10.1210/jc.2017-00082

96. Yoshida N, Goto H, Suzuki H, et al. Ketoacidosis as the initial clinical condition in nine patients with acromegaly: a review of 860 cases at a single institute. Eur J Endocrinol. 2013;169(1):127–132. doi:10.1530/eje-13-0060

97. Prencipe N, Bioletto F, Bona C, Gatti F, Grottoli S. Diabetic ketoacidosis in acromegaly: a case study-somatostatin analogs adverse event or disease complication? Acta Diabetol. 2020;57(4):491–493. doi:10.1007/s00592-019-01437-z

98. Zaina A, Grober Y, Abid A, Arad E, Golden E, Badarny S. Sodium glucose cotransporter 2 inhibitors treatment in acromegalic patients with diabetes-a case series and literature review. Endocrine. 2021;73(1):65–70. doi:10.1007/s12020-021-02718-w

99. Mehlich A, Bolanowski M, Mehlich D, Witek P. Medical treatment of Cushing’s disease with concurrent diabetes mellitus. Front Endocrinol. 2023;14:1174119. doi:10.3389/fendo.2023.1174119

100. Wharton S, Davies M, Dicker D, et al. Managing the gastrointestinal side effects of GLP-1 receptor agonists in obesity: recommendations for clinical practice. Postgrad Med. 2022;134(1):14–19. doi:10.1080/00325481.2021.2002616

101. He L, Wang J, Ping F, et al. Association of Glucagon-Like Peptide-1 Receptor Agonist use with risk of gallbladder and biliary disease: a systematic review and meta-analysis of Randomized Clinical Trials. JAMA. 2022;182(5):513.519. doi:10.1001/jamainternmed.2022.0338

102. Monami M, Nreu B, Scatena A, et al. Safety issues with glucagon-like peptide-1 receptor agonists (pancreatitis, pancreatic cancer and cholelithiasis): data from Randomized Controlled Trials. Diabetes Obes Metab. 2017;19(9):1233–1241. doi:10.1111/dom.12926

103. Zaina A, Prencipe N, Golden E, et al. How to position sodium-glucose co-transporter 2 inhibitors in the management of diabetes in acromegaly patients. Endocrine. 2023;80(3):491–499. doi:10.1007/s12020-023-03352-4

104. Peteres AL, Buschur EO, Buse JB, Cohan P, Diner JC, Hirsch IB. Euglycemic Diabetic Ketoacidosis: a potential complication of treatment with Sodium-Glucose Cotransporter 2 Inhibition. Diabetes Care. 2015;38(9):1687–1693. doi:10.2337/dc15-0843

105. Sampani E, Sarafidis P, Papagianni A. Euglycaemic diabetic ketoacidosis as a complication of SGLT-2 inhibitors: epidemiology, pathophysiology, and treatment. Expert Opin Drug Saf. 2020;19(6):673–682. doi:10.1080/14740338.2020.1764532

106. Ata F, Yousaf Z, Khan AA, et al. SGLT-2 inhibitors associated euglycemic and hyperglycemic DKA in multicentric cohort. Sci Rep. 2021;11:10293. doi:10.1038/s41598-021-89752-w

107. Stougaard EB, Kristensen PL, Kielgast U, et al. Real life evaluation of sodium-glucose cotransporter 2 inhibition in type 1 diabetes and the risk of diabetic ketoacidosis. Diab Vasc Dis Res. 2022;19:14791641221130043.

108. Anson M, Zhao SS, Austin P, Ibarburu GH, Malik RA, Alam U. SGLT2i and GLP-1 RA therapy in type 1 diabetes and Reno-vascular outcomes: a real-world study. Diabetologia. 2023;66:1869–1881.

109. Adnan Z. Sodium Glucose Co-transporter Inhibitors in patients with acromegaly and diabetes. Trends Endocrinol Metab. 2019;30(2):77–79. doi:10.1016/j.tem.2018.11.007

110. McGovern AP, Hogg M, Shields BM, et al.; BM MASTERMIND consortium. Risk factors for genital infections in people initiating SGLT2 inhibitors and their impact on discontinuation. BMJ Open Diabetes Res Care. 2020;8(1):e001238. doi:10.1136/bmjdrc-2020-001238

111. The Action to Control Cardiovascular Risk in Diabetes Study Group. Effects of intensive glucose lowering in type 2 diabetes. N Engl J Med. 2008;358:2545–2559. doi:10.1056/NEJMoa0802743

112. Shikata M, Ashida K, Goto Y, et al. Pasireotide-induced hyperglycemia in a patient with Cushing’s disease: potential use of sodium-glucose cotransporter 2 inhibitor and glucagon-like peptide-1 receptor agonist for treatment. Clin Case Rep. 2020;8(12):2613–2618. doi:10.1002/ccr3.3230

Creative Commons License © 2024 The Author(s). This work is published and licensed by Dove Medical Press Limited. The full terms of this license are available at https://www.dovepress.com/terms.php and incorporate the Creative Commons Attribution – Non Commercial (unported, v3.0) License. By accessing the work you hereby accept the Terms. Non-commercial uses of the work are permitted without any further permission from Dove Medical Press Limited, provided the work is properly attributed. For permission for commercial use of this work, please see paragraphs 4.2 and 5 of our Terms.

Long-Term Efficacy and Safety of Subcutaneous Pasireotide Alone or In Combination With Cabergoline in Cushing’s Disease

Objective: This study evaluated short- and long-term efficacy and safety of the second-generation somatostatin receptor ligand pasireotide alone or in combination with dopamine agonist cabergoline in patients with Cushing’s disease (CD).

Study design: This is an open-label, multicenter, non-comparative, Phase II study comprising 35-week core phase and an optional extension phase. All patients started with pasireotide, and cabergoline was added if cortisol remained elevated. Eligible patients had active CD, with or without prior surgery, were pasireotide naïve at screening or had discontinued pasireotide for reasons other than safety. Primary endpoint was proportion of patients with a mean urinary free cortisol (mUFC) level not exceeding the upper limit of normal (ULN) at week 35 with missing data imputed using last available post-baseline assessments.

Results: Of 68 patients enrolled, 26 (38.2%) received pasireotide monotherapy and 42 (61.8%) received pasireotide plus cabergoline during the core phase. Thirty-four patients (50.0%; 95% CI 37.6–62.4) achieved the primary endpoint, of whom 17 (50.0%) received pasireotide monotherapy and 17 (50.0%) received combination therapy. Proportion of patients with mUFC control remained stable during the extension phase up to week 99. Treatment with either mono or combination therapy provided sustained improvements in clinical symptoms of hypercortisolism up to week 99. Hyperglycemia and nausea (51.5% each), diarrhea (44.1%) and cholelithiasis (33.8%) were the most frequent adverse events.

Conclusion: Addition of cabergoline in patients with persistently elevated mUFC on maximum tolerated doses of pasireotide is an effective and well-tolerated long-term strategy for enhancing control of hypercortisolism in some CD patients.

Clinical trial registration: https://clinicaltrials.gov/ct2/show/NCT01915303, identifier NCT01915303.

1 Introduction

Cushing’s disease (CD) is a rare condition arising from chronic overproduction of cortisol, secondary to an adrenocorticotropic hormone (ACTH)-secreting pituitary tumor (1). Untreated hypercortisolism results in substantial multisystem morbidity, impaired quality of life (QoL) and premature mortality (14).

Pasireotide is a second-generation, multireceptor-targeted somatostatin receptor ligand (SRLs), with affinity for 4 of the 5 known somatostatin receptor subtypes (SSTRs) (5) and is approved for the treatment of patients with CD for whom surgery has failed or is not an option (6). Phase III trials of pasireotide monotherapy have shown sustained biochemical and clinical benefits up to 5 years (69). These benefits are also reflected in real-world evidence (10).

Cabergoline, a potent dopamine agonist with high affinity for dopamine type 2 receptors (D2), is commonly used off-label for the treatment of CD (2). Small, retrospective, non-randomized studies have demonstrated long-term urinary free cortisol (UFC) control (24−;60 months) in 23−;40% of patients with CD, especially those with mild hypercortisolism (1113). A meta-analysis of individual patient data from six observational studies (n=124) reported normalization of mean UFC (mUFC) levels in 34% of patients (1415). However, a short prospective study on cabergoline monotherapy showed a limited value in controlling UFC, possibly linked to short duration (16). As most corticotropinomas co­express SSTR5 and D2, combining pasireotide and cabergoline in a stepwise approach could potentially improve efficacy with achieving more rapid biochemical control (17), a premise supported by results from an 80-day pilot study of 17 patients with CD treated with cabergoline- pasireotide combination, and low-dose ketoconazole (in case of lack of complete control with the two-drug combination) (18).

The current study aims to report the efficacy and safety of prolonged treatment with pasireotide alone or in combination with cabergoline from the largest prospective, multicentre study to date of a pituitary-targeting combination treatment regimen in patients with CD (NCT01915303).

2 Materials and methods

2.1 Patients

Adults (≥18 years) with a confirmed diagnosis of CD or de novo CD, if they were not candidates for surgery or refused surgery were enrolled. Cushing’s disease was defined by a mean 24-hour (24h) UFC level greater than the upper limit of normal (ULN, 137.95 nmol/24h), calculated from three 24h samples collected within 2 weeks; a morning plasma ACTH level within or above the normal range; and a confirmed pituitary source of Cushing’s syndrome, determined by MRI confirmation of pituitary adenoma >6mm or inferior petrosal sinus sampling (IPSS) gradient >3 after CRH stimulation (or >2 if IPSS without CRH stimulation) for those patients with a tumor ≤6mm. For patients who had prior pituitary surgery, histopathology confirming an ACTH staining adenoma was considered confirmatory of CD. Key exclusion criteria included optic chiasm compression requiring surgery, poorly controlled diabetes (glycated hemoglobin [HbA1c] >8%) and having risk factors for torsades de pointes (for further details, see the Supplementary Appendix).

2.2 Study design

This was a single-arm, open-label, multicenter, non-comparative, Phase II study. After 4 weeks of screening, patients were treated in a stepwise approach during the core phase. Patients received subcutaneous pasireotide 0.6 mg twice daily (bid) for 8 weeks. Patients with a mUFC level exceeding ULN after 8 weeks received pasireotide 0.9 mg bid for another 8 weeks. If mUFC level remained elevated with pasireotide 0.9 mg bid, oral cabergoline 0.5 mg once daily (qd) was added for 8 weeks and could be increased to 1.0 mg qd for another 8 weeks (Supplementary Figure S1). After 35 weeks of treatment in the core phase, patients could enter the extension phase of the trial. Addition or titration of cabergoline during the extension phase was at the discretion of investigators.

Collection of extension data commenced from week 43, and patients continued their current study treatment up to study end (4 September 2019; date of last patient visit), week 257. Data beyond week 99 are not reported here because of small patient numbers.

2.3 End points and assessments

The primary endpoint of the study was the proportion of patients with mUFC ≤ULN at week 35. Secondary endpoints (reported at 4-week intervals up to week 35 and 8-week intervals from week 43 to the date of the last patient visit) included changes from baseline in mUFC, plasma ACTH, serum cortisol, total cholesterol, and clinical signs (systolic/diastolic blood pressure, body mass index (BMI), weight, waist circumference, facial rubor, hirsutism, striae, supraclavicular and dorsal fat pads) and symptoms (CushingQoL). Treatment escape was defined as an increase in one UFC above the normal range during follow-up of complete responders (14). Cushing Quality of Life Questionnaire (CushingQoL) (19) scores were reported up to week 35 only. Details on the safety assessments are provided in the Supplementary Appendix.

2.4 Statistical analyses

No formal hypothesis testing was performed because of the exploratory design of the study. Efficacy analyses were conducted on full analysis set, i.e., all patients to whom study treatment was assigned. Safety analyses were conducted on all patients who received ≥1 dose of pasireotide per day during the study. For patients with missing mUFC value at week 35, including those who discontinued, the last available assessment was carried forward. Details on the post hoc analyses and sample size estimation is provided in the Supplementary Appendix. Enrolled patients, who were observed for failed inclusion or exclusion criteria during the monitoring visits, were classified under protocol deviation. However, patients with no safety concerns were allowed to continue in the study and included in the full analysis set as intention to treat – assessing the study outcome, while some patients were excluded from the per protocol analysis.

3 Results

3.1 Study population

A total of 68 patients were enrolled in the study. At baseline, 66 (97.1%) patients were pasireotide naïve, while 2 (2.9%) were treated with pasireotide previously with 4 weeks of washout period prior to screening (Table 1). Of 68 patients received treatment during the core phase, 26 (38.2%) received pasireotide monotherapy and 42 (61.8%) received combination therapy. Fifty-two (76.5%) patients completed the 35-week core phase while 16 (23.5%) discontinued (Figure 1). All 68 patients were included in the full analysis set based on the intention to treat (ITT) principle. One of the protocol deviations observed during the study, was inclusion of 3 patients with normal mUFC value at screening visit (baseline) and assigning a treatment. The deviation category for the 3 patients was ‘failed inclusion criteria’ with screening mUFC value ≤ULN (137.95 nmol/24h) or mUFC calculated using ❤ UFC values or 2 out of 3 UFC values ≤ULN. One of these patients (baseline mUFC 37.37 nmol/24h ≤ULN) was discontinued from the study at Week 2 and due to lack of post-baseline mUFC assessment, was classified ‘non-responder’ at Week 35 assessment. The 2nd patient’s baseline mUFC value of 135.20 nmol/24h was close to ULN (137.95 nmol/24h) and was rescreened. Based on the rescreened mUFC value 306.5 nmol/24h, this patient was included in study, and the mUFC at Week 35 was 192.30 nmol/24h (non-responder at Week 35 assessment). For all study assessments, the scheduled screening visit’s first mUFC value (≤ULN) was used as baseline value. The 3rd patient (baseline mUFC value 131.77 nmol/24h) was discontinued from the study at Week 26 and was also observed for non-compliant schedule visit and medication dosages. The mUFC value recorded at Week 26 (88.95 nmol/24h) was ≤ULN and this last observation was carried forward to Week 35. Hence, the patient was classified ‘responder’, leaving one patient included in the study as responder as a protocol deviation.

Table 1
www.frontiersin.orgTable 1 Patient demographics and baseline characteristics.

Figure 1
www.frontiersin.orgFigure 1 Patient disposition. *If the study drugs were locally available at the end of the core phase, patients could switch over to the commercial supply and exit the extension phase. Only in countries where the drug was not locally available were patients given the option to enter the extension phase. Percentage for patients not entering the extension phase was calculated from the total number of patients enrolled in the study.

Twenty-nine (42.6%) patients continued treatment in the extension phase; 10 (34.5%) received pasireotide monotherapy and 19 (65.5%) received combination therapy. Twelve (41.4%) patients completed the extension phase, while 17 (58.6%) discontinued treatment before study end, most commonly for unsatisfactory therapeutic effect (n=8). The most common reason for discontinuation was adverse events (AEs): 5 (17.2%) patients with pasireotide monotherapy and 2 (5.1%) patients with combination therapy.

3.2 Efficacy: biochemical response

Overall, 34/68 (50.0%; 95% CI 37.6–62.4) patients achieved the primary endpoint, of whom 17 (50.0%) were receiving pasireotide monotherapy and 17 (50.0%) were receiving combination therapy. Patients with mild hypercortisolism (mUFC 1.0–<2.0 x ULN) at baseline were more likely to respond to both pasireotide monotherapy and combination therapy (n=15; 22.1%, Figure 2). Seven of 17 patients in the pasireotide monotherapy group met the primary endpoint based on their last available assessment prior to week 35. Even if the 3 patients who had mUFC ≤ULN at baseline were excluded from the primary analysis, 33/65 (50.7%; 95% CI 38.1–63.4) patients would have achieved the primary endpoint. The results are similar to the original analysis (34/68 (50.0%; 95% CI 37.6–62.4) based on the full analysis set.

Figure 2
www.frontiersin.orgFigure 2 Patients achieving mUFC ≤ULN at week 35. At baseline there were 23 patients with mild, 30 with moderate and 12 with severe hypercortisolism. mUFC, mean urine free cortisol; ULN, upper limit of normal.

For the overall study population (n=68), mUFC rapidly decreased from 501.6 nmol/24h (3.6 x ULN; SD: 488.66 nmol/24h) to 242.1 nmol/24h (1.8 x ULN; SD: 203.47 nmol/24h) at week 4 and mUFC remained below baseline levels up to week 35 (184.8 nmol/24h; 1.3 x ULN; SD:140.13 nmol/24h). For patients who received pasireotide monotherapy (n=26), mUFC( ± SD) decreased from baseline (442.1± 557.13 nmol/24h [n=26]; 3.2 x ULN) to week 35 (136.6 ± 127.77 nmol/24h [n=14]; 1 x ULN) and at the end of the study (111.2 ± 40.39 nmol/24h [n=5]; 0.8 x ULN) using the last-observation-carried-forward (LOCF). For those who did not normalize on pasireotide monotherapy (n=42), mUFC ( ± SD) decreased from baseline, i.e., last observation before starting cabergoline (280.20 ± 129.03 nmol/24h [n=40]; 2.0 x ULN) to week 35 (206.6 ± 141.96 nmol/24h [n=31]; 1.5 x ULN) and at the end of the study (219.60 ± 83.78 nmol/24h [n=7]; 1.6 x ULN) using the LOCF. During the core phase, mean serum cortisol decreased from 738.6 nmol/L (1.3 x ULN) at baseline to 538.2 nmol/L (0.95 x ULN) and ACTH levels from 16.3 pmol/L (2.7 x ULN) to 11.0 pmol/L (1.8 x ULN) at week 35.

During the extension phase, 25 patients had a mUFC assessment; of whom 12 (48%) had a mUFC ≤ULN at the end of the extension phase. During the extension phase, mUFC levels decreased slightly and fluctuated above and below the ULN up to the week 139 (Figure 3A), while mean serum cortisol remained below ULN (404 nmol/L; Figure 3B) and ACTH levels fluctuated from 8.2 pmol/L to 11.5 pmol/L) and remained above the ULN value (Figure 3C).

Figure 3
www.frontiersin.orgFigure 3 Mean actual change over time in (A) mUFC (B) serum cortisol, and (C) ACTH. ACTH, adrenocorticotropic hormone; mUFC, mean urine free cortisol; ULN, upper limit of normal .

Twenty-one of 38 (55%) patients achieved control with combination therapy at some point during the core or extension study, of whom 13 (62%) experienced escape (at least one UFC >ULN after previous control). The time to achieve control after starting cabergoline ranged from 14−;343 days. Notably, one patient received pasireotide 0.6 mg bid initially, dose increased to 0.9 mg bid at Week 17, followed by addition of cabergoline 0.5 mg od at Week 31. The patient achieved biochemical control (mUFC value of 120.15 nmol/24h) on the same day of the start of combination therapy. Clinically it is highly unlikely that biochemical control was achieved with single dose of cabergoline administration. Therefore, it could be considered that normalization was achieved while receiving pasireotide monotherapy. Also, the physician might have prescribed combination therapy before receiving the mUFC value of the (urinary) sample delivered on the morning of combination therapy initiation (while the patient was still on monotherapy). The patient continued combination therapy and maintained biochemical control up to Week 35 and beyond. Furthermore, at Week 59 the cabergoline dose was increased to 1.0 mg/day due to mUFC >ULN at previous visit (Week 51). The patient remained on pasireotide 0.9 mg bid/cabergoline 1.0 mg od combination therapy until the study end.

The median time to escape after achieving control with the addition of cabergoline was 58 days (range 28−;344). 10/13patients regained biochemical control with combination therapy. No patients on pasireotide alone experienced escape, probably due to the short observation time.

3.3 Clinical signs and symptoms of CD

Relative to baseline, pasireotide monotherapy was accompanied by reductions in median blood pressure, weight, BMI, waist circumference, and total cholesterol. Overall improvement in clinical measures persisted over time (Supplementary Table S1). Clinical improvements were also seen following the addition of cabergoline, particularly for hirsutism (Supplementary Figures S2S3).

Mean( ± SD) standardized CushingQoL score was 41.6(± 20.2) at baseline and increased to 47.6(± 20.8) at week 35 (Supplementary Table S2), indicating improvements in patients’ QoL (19).

3.4 Safety and tolerability

Median duration of exposure to pasireotide was 35.0 weeks (range 0−;268), with a median dose of 1.53 mg/day (range 0.29−;1.80). Median duration of exposure to cabergoline was 16.9 weeks (range 1−;215), with a median dose of 0.50 mg/day (range 0.44−;0.97).

All patients (N=68) reported at least one AE and 28/68 (41.2%) patients had a grade 3/4 AE (Table 2). The most common AEs (≥30%) were hyperglycemia and nausea (51.5% each), diarrhea (44.1%) and cholelithiasis (33.8%). Treatment-related AEs (TRAEs) were reported in 66/68 (97.1%) patients; the most frequent TRAEs (≥30%) were hyperglycemia and nausea (47.1% each), diarrhea (39.7%), and cholelithiasis (32.4%). Fourteen (20.6%) patients had ≥1 AE leading to discontinuation.

Table 2
www.frontiersin.orgTable 2 Summary of adverse events (≥10%), overall and by treatment regimen.

The most common AEs leading to discontinuation were increased gamma-glutamyl transferase (GGT) and hyperglycemia (two patients each, 2.9%). Twenty-three (33.8%) patients had ≥1 AE leading to dose adjustment or interruption. Details on special safety assessments such as hyperglycemia-related AEs, blood glucose, HbA1c, IGF-1 as well as hematological and biochemical abnormalities are presented in the Supplementary Appendix.

Three (4.4%) patients died during the study, two (2.9%) during the core phase and one (1.5%) during the extension. All deaths were considered unrelated to study medication. The causes during the core phase were multi-organ dysfunction syndrome for one patient aged 79 years and unknown for the other aged 34 years. Uncontrolled hypertension was reported as the cause of death for the patient aged 47 during the extension phase.

4 Discussion

The severe morbidity and increased mortality with uncontrolled CD highlight the importance of identifying an effective medical strategy. This study explored the potential of a synergistic benefit of the addition of cabergoline to pasireotide treatment in patients with CD.

Complete normalization of cortisol production is required to reverse the risks of morbidity and mortality in patients with CD (1). Two small studies showed clinical improvement of normalized UFC when cabergoline and ketoconazole were combined (2021). Benefit has also been reported with triple therapy with pasireotide, cabergoline and ketoconazole (18) and triple therapy with ketoconazole, metyrapone and mitotane in severe CD (22). In the current study, 50% of patients achieved the primary endpoint of mUFC ≤ULN at week 35 and a similar proportion (48%) sustained biochemical control throughout the extension phase. Notably, combination treatment doubled the number of patients who attained mUFC ≤ULN from the core phase to the end of the extension phase. In particular, mUFC was rapidly reduced with treatment, i.e., in most patients within 2 months, while measures of patient-reported outcomes also improved including QoL. Twenty-three patients (33.8%) who completed the core phase did not enter the extension phase. This was because only patients from countries where a commercial supply was unavailable were given the option to enter the extension phase.

This study confirms previous reports that patients with mild hypercortisolism at baseline were more likely to achieve mUFC control with pasireotide monotherapy than patients with moderate or severe hypercortisolism (623). In addition, patients with moderate hypercortisolism at baseline were more likely to achieve mUFC control with the addition of cabergoline. This supports that a combination therapy can be effective for patients with a wider range of disease severity. Accordingly, in vitro data may indeed indicate synergism between SSTR and D2 that might increase therapeutic efficacy (2425).

Improvements in clinical signs and symptoms with pasireotide monotherapy were consistent with published data (610). In the core phase, an improvement of blood pressure and BMI was observed with pasireotide monotherapy and, to a lesser extent, with combination therapy which may related to the difference in duration of biochemical remission.

The overall safety profile was consistent with that expected for pasireotide, with most AEs being mild/moderate (2627). There were no new safety signals identified with the addition of cabergoline. Common AEs including nausea, headache, dizziness, and fatigue are suggestive of steroid withdrawal symptoms associated with the decrease in UFC, although direct drug effects cannot fully be excluded. Adrenal insufficiency was not reported as side effect. Rates of hyperglycemia-related AEs (68%) were consistent with those in previous reports of pasireotide monotherapy (610). FPG increased with pasireotide monotherapy during the first 8 weeks of treatment and stabilized for the remainder of the study, including following the addition of cabergoline. These data highlight the vital role of blood glucose monitoring in these patients.

Both pasireotide and cabergoline are pituitary-targeted agents that act directly on the source of the disease via inhibition of ACTH release by the corticotroph tumor, which may be an advantage over steroid synthesis inhibitors. This study further confirms previous data reporting the benefits of pasireotide in combination with cabergoline in patients with CD (18). While not entirely elucidated, down-regulation of dopamine D2 receptors (D2R) expression, and post-receptor desensitization and/or tumor regrowth of corticotroph tumor cell were suggested as possible mechanisms for treatment escape (15). Moreover, different dopamine receptor patterns and/or D2R isoforms also influence the response and eventually the treatment escape. Treatment escape has been observed in some studies after long-term (7−;12 months) treatment with cabergoline (13), however it is possible that use of concomitant SRLs could potentially reduce the rate of escape. In this study, a total of 13 patients experienced treatment escape. However, 10 of these patients regained biochemical control. For 7 of these 10 patients, there was up titration of doses to a maximum of 1.8 mg/day of pasireotide and 1 mg/day of cabergolineAlthough pasireotide and cabergoline have shown long-term reduction in IGF-1 levels in patients with acromegaly (2829), there is little evidence for this effect in patients with CD (430). One study (n=17) found significant decreases in IGF-1 after 28 days’ treatment with pasireotide that was independent of UFC reduction. One-third of patients had low IGF-1 (30). Our study showed that almost half of patients (47.6%) had IGF-1 levels either above ULN or below LLN prior to the addition of cabergoline, and IGF-1 levels decreased relative to the baseline, with majority of values within the normal range during the core and extension phases up to week 99. Baseline levels of IGF-1 may already be low because of the suppressive effect of excess cortisol on the somatotropic axis (31).

Although clinicians have several therapeutic options at their disposal to treat hypercortisolemia associated with CD, the optimal treatment approach should be based on the individual clinical situation and the benefit–risk considerations for each patient. In this study, 13 patients had history of pituitary radiation, with a duration of at least 2.6 years (median 3.3 years) between the last radiation treatment and the observed response date. However, only 7/13 patients achieved the therapeutic target. Although there was a gap of > 2 years, we cannot exclude the role of radiation in normalizing UFC. Contrastingly, 6/13 patients treated with radiation did not achieve mUFC ≤ULN (responders) at Week 35. The impact of the adjuvant radiation therapy remains unclear.

The strengths of this study are that this is the largest and longest prospective study with pituitary-directed pharmacotherapy, to date, evaluating the addition of cabergoline to pasireotide in patients with CD, and this stepwise approach reflects real-world clinical practice (18). The study is limited by the open-label design and the fact that it was not a head-to-head comparative study of pasireotide only versus pasireotide plus cabergoline. This may be of importance in interpreting patient-reported outcomes. Several patients continued treatment for almost 2 years; however, interpretation of long-term data should be made with caution because of the small patient numbers. Notably, the last available assessment was carried forward for patients with missing mUFC value at week 35 including those who discontinued and were considered for response analysis. It should also be noted that the definition of loss of response, also known as escape, used in this study (at least one UFC value >ULN after previously achieving UFC ≤ULN) may overestimate the rate of apparent escape as UFC values may have fluctuated about the ULN range or been marginally elevated. The definition of treatment escape differs across studies, and we have used a very stringent one in this study, requiring only a single high UFC to meet the classification as escape. Thus, it is likely that some loss of biochemical control interpreted as escape is actually fluctuation of cortisol around the upper limit of normal range.

Other limitations include protocol deviations in including 3 patients with normal UFC at baseline (one patient was uncontrolled at rescreen, and one was discontinued at 2 weeks – both classified as

non-responders), lack of data on impact of radiation therapy without study drug in patients who gained biochemical control with adjuvant radiation therapy, lack of pituitary magnetic resonance imaging to detect pituitary tumor changes, lack of data about effective cabergoline dose and absence of cardiac valve assessment for mild to moderate severity in the medium term. Both pasireotide and cabergoline can induce tumor shrinkage in CD (693235) and it would be interesting to examine the combined effect on tumor size. This study used the subcutaneous formulation of pasireotide, whereas the most common usage currently is the long-acting formulation. Efficacy of long-acting pasireotide (36) seems higher compared to the subcutaneous formulation (7) and the effect of combination of long-acting pasireotide with cabergoline should be evaluated in future studies. No formal assessments were made for impulsive control disorders, which have been associated with dopamine agonists, including cabergoline (32333738). The reason that several different terms were used for hyperglycemia-related AEs is that they were reported as per discretion of each investigator. No additional psychiatric AEs were reported, although they were not exhaustively searched.

5 Conclusions

This is the first study demonstrating that pituitary-targeted combination treatment with pasireotide and cabergoline doubled the number of patients who attained mUFC ≤ULN. Both short- and long-term safety profile are consistent with known data for pasireotide and cabergoline. The low rate of discontinuation due to AEs suggests that pasireotide alone or as combination treatment is generally well-tolerated if appropriately monitored, even with prolonged treatment. The addition of cabergoline to pasireotide treatment in patients with persistently elevated mUFC could be an effective long-term strategy for enhancing the control of CD in a subset of patients, with close monitoring for possible escape.

Data availability statement

The original contributions presented in the study are included in the article/Supplementary Material. Further inquiries can be directed to the corresponding author.

Ethics statement

The studies involving humans were approved by Hospital Britanico, Buenos Aires, Argentina; Ethische commissie University Hospitals Leuven, Leuven, Belgium; Universitair Ziekenhuis Gent, Gent, Belgium; Comite de Etica em Pesquisa Hospital Moinhos de Vento, Porto Alegre-RS, Brazil; Comitê de Ética em Pesquisa do Hospital de Clı́nicas, Universidade Federal do Paraná, Curitiba-PR, Brazil; Comissão de Ética para Análise de Projetos de Pesquisa, São Paulo – SP, Brazil; Ethics Committee for clinical trials, Sofia, Bulgaria; Comité Corporativo de Ética en Investigación, Bogotá DC, Colombia; Comite De Protection Des Personnes, Groupe Hospitalier Pellegrin – Bat, Bordeaux Cedex, France; Friedrich-Alexander Universitat Erlangen-Nurnberg, Medizinische Fakultat, Erlangen, Germany;National Ethics Committee, Cholargos, Athens, Greece; Ethics Committee for Clinical Pharmacology (ECCP), Budapest, Hungary; Institute Ethics Committee, New Delhi, India; Institutional Review Board (IRB) Ethics Committee Silver, Christian Medical College, Vellore, Tamil Nadu, India; Institute Ethics Committee, PGIMER, Chandigarh, India; Comitato Etico Dell’irccs Istituto Auxologico Italiano Di Milano, Milano, Italy; Comitato Etico Universita’ Federico Ii Di Napoli, Napoli, Italy; Jawatankuasa Etika & Penyelidikan Perubatan (Medical Research and Ethics Committee), d/a Institut Pengurusan Keshatan Jalan Rumah Sakit, Kuala Lumpur, Malaysia; Institutd Nacional De Neurologia Y Neurocirugia, Mexico City, Mexico; Clinica Bajio (CLINBA), Guanajuato, Mexico; Medische Ethische Toetsings Commissie, Rotterdam; Netherlands; CEIm Provincial de Málaga, Málaga, Spain; Istanbul University Cerrahpasa Medical Faculty, Istanbul, Turkey; WIRB, Puyallup, WA, USA; Research Integrity Office, Oregon Health & Science University Portland, OR USA. The studies were conducted in accordance with local legislations and institutional requirements. The participants provided their written informed consent to participate in this study.

Author contributions

All authors directly participated in the planning, execution, or analysis, and have had full control of complete primary data, and hold responsibility for data integrity and accuracy. All authors contributed to the article and approved the submitted version.

Acknowledgments

We thank Julie Brown, Mudskipper Business Ltd, and Manojkumar Patel and Sashi Kiran Goteti, Novartis Healthcare Private Limited, for medical editorial assistance with this manuscript. We would also like to thank all investigators, sub-investigators, study nurses and coordinators, and patients who have made this study possible.

Conflict of interest

HP and RM were Novartis employees and owned Novartis stocks. AMP was employed by Novartis and Recordati. AC is a Novartis employee and owns Novartis stocks. RF received research grants from Strongbridge and Corcept, consulting fee from Recordati, honoraria and financial support for meetings and/or travel from HRA Pharma and Recordati, and attended advisory boards for Recordati. MF has received research support to Oregon Health & Science University as a principal investigator from Recordati and Xeris Strongbridge and has performed occasional scientific consultancy for Recordati, HRA Pharma, Sparrow, and Xeris Strongbridge. PK attended advisory boards for Recordati. MB’s institution received consulting fee and attended advisory boards from Recordati. DG-D received research grants from Recordati Rare Disease and Bayer, consulting fee from Abbott-Lafrancol, Biotoscana, PTC lab, Glaxo/Helou, Recordati Rare Disease, and Bayer, honoraria from Valentech Pharma, Sanofi, and Bayer, travel grants from Recordati Rare Disease, advocacy groups and other leadership roles from Asociación Colombiana de Endocrinologia and Asociación Colombiana de Osteoporosis y Metabolismo, and other financial and non-financial interests include Asociacion Colombiana de Endocrinologia y Metabolismo, Hospital Universitario Fundación Santa Fé de Bogota, and Asociación Colombiana de Osteoporosis y Metabolismo. CB received research grants from Novartis and Recordati, and consulting and speaker fee from Novartis. BB served as the principal investigator for grants to Massachusetts General Hospital from Cortendo/Strongbridge Xeris, Millendo, and Novartis and has occasionally consulted for Cortendo/Strongbridge Xeris, HRA Pharma, Novartis Recordati, and Sparrow. RP and his institution received research grants and honoraria from Pfizer, Ipsen, Novartis, Merck Serono, IBSA Farmaceutici, Corcept, Shire, HRA Pharma, ICON, Covance, Neuroendocrine CAH, Camurus, Recordati, Janssen Cilag, and CMED Clinical Services, received consulting fee from Recordati Rare Disease, Organon Italia, Siunergos Pharma, Corcept, S&R Farmaceutici S.p.A., DAMOR Farmaceutici, and Pfizer, attended advisory boards from Crinetics Pharmaceuticals, Recordati Rare Disease, Pfizer, and HRA Pharma.

The remaining author declares that the research was conducted in the absence of any commercial or financial relationships that could be construed as a potential conflict of interest.

The authors declare that this study received funding from Novartis Pharma AG. Novartis was involved in the study design, analysis, interpretation of data, and providing financial support for medical editorial assistance of this article.

Publisher’s note

All claims expressed in this article are solely those of the authors and do not necessarily represent those of their affiliated organizations, or those of the publisher, the editors and the reviewers. Any product that may be evaluated in this article, or claim that may be made by its manufacturer, is not guaranteed or endorsed by the publisher.

Supplementary material

The Supplementary Material for this article can be found online at: https://www.frontiersin.org/articles/10.3389/fendo.2023.1165681/full#supplementary-material

References

1. Lacroix A, Feelders RA, Stratakis CA, Nieman LK. Cushing’s syndrome. Lancet (2015) 386(9996):913–27. doi: 10.1016/s0140-6736(14)61375-1

PubMed Abstract | CrossRef Full Text | Google Scholar

2. Feelders RA, Newell-Price J, Pivonello R, Nieman LK, Hofland LJ, Lacroix A. Advances in the medical treatment of Cushing’s syndrome. Lancet Diabetes Endocrinol (2019) 7(4):300–12. doi: 10.1016/s2213-8587(18)30155-4

PubMed Abstract | CrossRef Full Text | Google Scholar

3. Newell-Price J. Mortality in cushing disease. Nat Rev Endocrinol (2016) 12(9):502–3. doi: 10.1038/nrendo.2016.118

PubMed Abstract | CrossRef Full Text | Google Scholar

4. Fleseriu M, Auchus R, Bancos I, Ben-Shlomo A, Bertherat J, Biermasz NR, et al. Consensus on diagnosis and management of Cushing’s disease: a guideline update. Lancet Diabetes Endocrinol (2021) 9(12):847–75. doi: 10.1016/s2213-8587(21)00235-7

PubMed Abstract | CrossRef Full Text | Google Scholar

5. Schmid HA. Pasireotide (SOM230): Development, mechanism of action and potential applications. Mol Cell Endocrinol (2008) 286(1):69–74. doi: 10.1016/j.mce.2007.09.006

PubMed Abstract | CrossRef Full Text | Google Scholar

6. Colao A, Petersenn S, Newell-Price J, Findling JW, Gu F, Maldonado M, et al. A 12-month Phase 3 study of pasireotide in Cushing’s disease. N Engl J Med (2012) 366(10):914–24. doi: 10.1056/NEJMoa1105743

PubMed Abstract | CrossRef Full Text | Google Scholar

7. Lacroix A, Gu F, Gallardo W, Pivonello R, Yu Y, Witek P, et al. Efficacy and safety of once-monthly pasireotide in Cushing’s disease: a 12 month clinical trial. Lancet Diabetes Endocrinol (2018) 6(1):17–26. doi: 10.1016/s2213-8587(17)30326-1

PubMed Abstract | CrossRef Full Text | Google Scholar

8. Fleseriu M, Petersenn S, Biller BMK, Kadioglu P, De Block C, T’Sjoen G, et al. Long-term efficacy and safety of once-monthly pasireotide in Cushing’s disease: A Phase III extension study. Clin Endocrinol (2019) 91(6):776–85. doi: 10.1111/cen.14081

CrossRef Full Text | Google Scholar

9. Petersenn S, Salgado LR, Schopohl J, Portocarrero-Ortiz L, Arnaldi G, Lacroix A, et al. Long-term treatment of Cushing’s disease with pasireotide: 5-year results from an open-label extension study of a Phase III trial. Endocrine (2017) 57(1):156–65. doi: 10.1007/s12020-017-1316-3

PubMed Abstract | CrossRef Full Text | Google Scholar

10. Fleseriu M, Iweha C, Salgado L, Mazzuco TL, Campigotto F, Maamari R, et al. Safety and efficacy of subcutaneous pasireotide in patients with Cushing’s disease: results from an open-label, multicenter, single-arm, multinational, expanded-access study. Original Res Front Endocrinol (Lausanne) (2019) 10:436. doi: 10.3389/fendo.2019.00436

CrossRef Full Text | Google Scholar

11. Pivonello R, De Martino MC, Cappabianca P, De Leo M, Faggiano A, Lombardi G, et al. The medical treatment of Cushing’s disease: effectiveness of chronic treatment with the dopamine agonist cabergoline in patients unsuccessfully treated by surgery. J Clin Endocrinol Metab (2009) 94(1):223–30. doi: 10.1210/jc.2008-1533

PubMed Abstract | CrossRef Full Text | Google Scholar

12. Godbout A, Manavela M, Danilowicz K, Beauregard H, Bruno OD, Lacroix A. Cabergoline monotherapy in the long-term treatment of Cushing’s disease. Eur J Endocrinol (2010) 163(5):709–16. doi: 10.1530/eje-10-0382

PubMed Abstract | CrossRef Full Text | Google Scholar

13. Ferriere A, Cortet C, Chanson P, Delemer B, Caron P, Chabre O, et al. Cabergoline for Cushing’s disease: a large retrospective multicenter study. Eur J Endocrinol (2017) 176(3):305–14. doi: 10.1530/eje-16-0662

PubMed Abstract | CrossRef Full Text | Google Scholar

14. Palui R, Sahoo J, Kamalanathan S, Kar SS, Selvarajan S, Durgia H. Effect of cabergoline monotherapy in Cushing’s disease: an individual participant data meta-analysis. J Endocrinol Invest (2018) 41(12):1445–55. doi: 10.1007/s40618-018-0936-7

PubMed Abstract | CrossRef Full Text | Google Scholar

15. Palui R, Sahoo J, Kamalanathan S, Kar SS, Selvarajan S, Durgia H. Correction to: Palui R, Sahoo J, Kamalanathan S, Kar SS, Selvarajan S, Durgia H. Effect of cabergoline monotherapy in Cushing’ disease: an individual participant data meta-analysis. J Endocrinol Invest. 2018; 41(12):1445-1455. Doi: 10.1007/s40618-018-0936-7. J Endocrinol Invest (2022) 45(4):899–900. doi: 10.1007/s40618-021-01723-0

PubMed Abstract | CrossRef Full Text | Google Scholar

16. Burman P, Edén-Engström B, Ekman B, Karlsson FA, Schwarcz E, Wahlberg J. Limited value of cabergoline in Cushing’s disease: a prospective study of a 6-week treatment in 20 patients. Eur J Endocrinol (2016) 174(1):17–24. doi: 10.1530/eje-15-0807

PubMed Abstract | CrossRef Full Text | Google Scholar

17. Colao A, Filippella M, Pivonello R, Di Somma C, Faggiano A, Lombardi G. Combined therapy of somatostatin analogues and dopamine agonists in the treatment of pituitary tumours. Eur J Endocrinol (2007) 156:S57–63. doi: 10.1530/eje.1.02348

PubMed Abstract | CrossRef Full Text | Google Scholar

18. Feelders RA, de Bruin C, Pereira AM, Romijn JA, Netea-Maier RT, Hermus AR, et al. Pasireotide alone or with cabergoline and ketoconazole in Cushing’s disease. N Engl J Med (2010) 362(19):1846–8. doi: 10.1056/NEJMc1000094

PubMed Abstract | CrossRef Full Text | Google Scholar

19. Webb SM, Badia X, Barahona MJ, Colao A, Strasburger CJ, Tabarin A, et al. Evaluation of health-related quality of life in patients with Cushing’s syndrome with a new questionnaire. Eur J Endocrinol (2008) 158(5):623–30. doi: 10.1530/eje-07-0762

PubMed Abstract | CrossRef Full Text | Google Scholar

20. Barbot M, Albiger N, Ceccato F, Zilio M, Frigo AC, Denaro L, et al. Combination therapy for Cushing’s disease: effectiveness of two schedules of treatment: should we start with cabergoline or ketoconazole? . Pituitary (2014) 17(2):109–17. doi: 10.1007/s11102-013-0475-3

PubMed Abstract | CrossRef Full Text | Google Scholar

21. Vilar L, Naves LA, Azevedo MF, Arruda MJ, Arahata CM, Moura E, et al. Effectiveness of cabergoline in monotherapy and combined with ketoconazole in the management of Cushing’s disease. Pituitary (2010) 13(2):123–9. doi: 10.1007/s11102-009-0209-8

PubMed Abstract | CrossRef Full Text | Google Scholar

22. Kamenický P, Droumaguet C, Salenave S, Blanchard A, Jublanc C, Gautier JF, et al. Mitotane, metyrapone, and ketoconazole combination therapy as an alternative to rescue adrenalectomy for severe ACTH-dependent Cushing’s syndrome. J Clin Endocrinol Metab. (2011) 96(9):2796–804. doi: 10.1210/jc.2011-0536

PubMed Abstract | CrossRef Full Text | Google Scholar

23. Boscaro M, Ludlam WH, Atkinson B, Glusman JE, Petersenn S, Reincke M, et al. Treatment of pituitary-dependent Cushing’s disease with the multireceptor ligand somatostatin analog pasireotide (SOM230): a multicenter, Phase II trial. J Clin Endocrinol Metab (2009) 94(1):115–22. doi: 10.1210/jc.2008-1008

PubMed Abstract | CrossRef Full Text | Google Scholar

24. Rocheville M, Lange DC, Kumar U, Patel SC, Patel RC, Patel YC. Receptors for dopamine and somatostatin: formation of hetero-oligomers with enhanced functional activity. Science (2000) 288(5463):154–7. doi: 10.1126/science.288.5463.154

PubMed Abstract | CrossRef Full Text | Google Scholar

25. Baragli A, Alturaihi H, Watt HL, Abdallah A, Kumar U. Heterooligomerization of human dopamine receptor 2 and somatostatin receptor 2 Co-immunoprecipitation and fluorescence resonance energy transfer analysis. Cell Signal (2007) 19(11):2304–16. doi: 10.1016/j.cellsig.2007.07.007

PubMed Abstract | CrossRef Full Text | Google Scholar

26. Pivonello R, Ferrigno R, De Martino MC, Simeoli C, Di Paola N, Pivonello C, et al. Medical treatment of Cushing’s disease: an overview of the current and recent clinical trials. Front Endocrinol (Lausanne) (2020) 11:648. doi: 10.3389/fendo.2020.00648

CrossRef Full Text | Google Scholar

27. Capatina C, Hinojosa-Amaya JM, Poiana C, Fleseriu M. Management of patients with persistent or recurrent Cushing’s disease after initial pituitary surgery. Expert Rev Endocrinol Metab (2020) 15(5):321–39. doi: 10.1080/17446651.2020.1802243

PubMed Abstract | CrossRef Full Text | Google Scholar

28. Colao A, Bronstein MD, Brue T, De Marinis L, Fleseriu M, Guitelman M, et al. Pasireotide for acromegaly: long-term outcomes from an extension to the Phase III PAOLA study. Eur J Endocrinol (2020) 182(6):583. doi: 10.1530/EJE-19-0762

PubMed Abstract | CrossRef Full Text | Google Scholar

29. Marazuela M, Ramos-Leví A, Sampedro-Núñez M, Bernabeu I. Cabergoline treatment in acromegaly: pros. Endocrine (2014) 46(2):215–9. doi: 10.1007/s12020-014-0206-1

PubMed Abstract | CrossRef Full Text | Google Scholar

30. Varewijck AJ, Feelders RA, de Bruin C, Pereira AM, Netea-Maier RT, Zelissen PMJ, et al. P3-535, Pasireotide treatment in cushing disease: effects on the IGF-I system. Endocr Rev (2011) 32(Suppl 1):1–3095. doi: 10.1210/endo-meetings.2011.PART4.P5.P3-535

CrossRef Full Text | Google Scholar

31. Mazziotti G, Giustina A. Glucocorticoids and the regulation of growth hormone secretion. Nat Rev Endocrinol (2013) 9(5):265–76. doi: 10.1038/nrendo.2013.5

PubMed Abstract | CrossRef Full Text | Google Scholar

32. Batista RL, Musolino NRC, Cescato VAS, da Silva GO, Medeiros RSS, Herkenhoff CGB, et al. Cabergoline in the management of residual nonfunctioning pituitary adenoma: a single-center, open-label, 2-year randomized clinical trial. Am J Clin Oncol (2019) 42(2):221–7. doi: 10.1097/coc.0000000000000505

PubMed Abstract | CrossRef Full Text | Google Scholar

33. Lacroix A, Gu F, Schopohl J, Kandra A, Pedroncelli AM, Jin L, et al. Pasireotide treatment significantly reduces tumor volume in patients with Cushing’s disease: results from a Phase 3 study. Pituitary (2020) 23(3):203–11. doi: 10.1007/s11102-019-01021-2

PubMed Abstract | CrossRef Full Text | Google Scholar

34. Simeoli C, Auriemma RS, Tortora F, De Leo M, Iacuaniello D, Cozzolino A, et al. The treatment with pasireotide in Cushing’s disease: effects of long-term treatment on tumor mass in the experience of a single center. Endocrine (2015) 50(3):725–40. doi: 10.1007/s12020-015-0557-2

PubMed Abstract | CrossRef Full Text | Google Scholar

35. Manavela MP, Danilowicz K, Bruno OD. Macrocorticotropinoma shrinkage and control of hypercortisolism under long-term cabergoline therapy: case report. Pituitary (2012) 15:33–6. doi: 10.1007/s11102-011-0309-0

PubMed Abstract | CrossRef Full Text | Google Scholar

36. Lacroix A, Bronstein MD, Schopohl J, Delibasi T, Salvatori R, Li Y, et al. Long-acting pasireotide improves clinical signs and quality of life in Cushing’s disease: results from a phase III study. J Endocrinol Invest. (2020) 43(11):1613–22. doi: 10.1007/s40618-020-01246-0

PubMed Abstract | CrossRef Full Text | Google Scholar

37. Hinojosa-Amaya JM, Johnson N, González-Torres C, Varlamov EV, Yedinak CG, McCartney S, et al. Depression and impulsivity self-assessment tools to identify dopamine agonist side effects in patients with pituitary adenomas. Front Endocrinol (Lausanne) (2020) 11:579606. doi: 10.3389/fendo.2020.579606

PubMed Abstract | CrossRef Full Text | Google Scholar

38. Grall-Bronnec M, Victorri-Vigneau C, Donnio Y, Leboucher J, Rousselet M, Thiabaud E, et al. Dopamine agonists and impulse control disorders: a complex association. Drug Saf. (2018) 41(1):19–75. doi: 10.1007/s40264-017-0590-6

PubMed Abstract | CrossRef Full Text | Google Scholar

Keywords: somatostatin, pasireotide, cabergoline, Cushing’s disease, hypercortisolism

Citation: Feelders RA, Fleseriu M, Kadioglu P, Bex M, González-Devia D, Boguszewski CL, Yavuz DG, Patino H, Pedroncelli AM, Maamari R, Chattopadhyay A, Biller BMK and Pivonello R (2023) Long-term efficacy and safety of subcutaneous pasireotide alone or in combination with cabergoline in Cushing’s disease. Front. Endocrinol. 14:1165681. doi: 10.3389/fendo.2023.1165681

Received: 14 February 2023; Accepted: 11 August 2023;
Published: 09 October 2023.

Edited by:

Renato Cozzi, Endocrinology Unit Ospedale Niguarda, Italy

Reviewed by:

Przemyslaw Witek, Warsaw Medical University, Poland
Athanasios Fountas, General Hospital of Athens G. Genimatas, Greece

Copyright © 2023 Feelders, Fleseriu, Kadioglu, Bex, González-Devia, Boguszewski, Yavuz, Patino, Pedroncelli, Maamari, Chattopadhyay, Biller and Pivonello. This is an open-access article distributed under the terms of the Creative Commons Attribution License (CC BY). The use, distribution or reproduction in other forums is permitted, provided the original author(s) and the copyright owner(s) are credited and that the original publication in this journal is cited, in accordance with accepted academic practice. No use, distribution or reproduction is permitted which does not comply with these terms.

*Correspondence: Richard A. Feelders, r.feelders@erasmusmc.nl

Present addresses: Alberto M. Pedroncelli, Chief Medical Office, Camurus AB, Lund, SwedenRicardo Maamari, Global Medical Affairs, Mayne Pharma, Raleigh, NC, United States

These authors have contributed equally to this work

Disclaimer: All claims expressed in this article are solely those of the authors and do not necessarily represent those of their affiliated organizations, or those of the publisher, the editors and the reviewers. Any product that may be evaluated in this article or claim that may be made by its manufacturer is not guaranteed or endorsed by the publisher.

From https://www.frontiersin.org/articles/10.3389/fendo.2023.1165681/full

Complete and Sustained Remission of Hypercortisolism With Pasireotide Treatment of an Adrenocorticotropic Hormone (Acth)-Secreting Thoracic Neuroendocrine Tumour: an N-Of-1 Trial

Abstract

N-of-1 trials can serve as useful tools in managing rare disease. We describe a patient presenting with a typical clinical picture of Cushing’s Syndrome (CS).

Further testing was diagnostic of ectopic Adrenocorticotropic Hormone (ACTH) secretion, but its origin remained occult. The patient was offered treatment with daily pasireotide at very low doses (300 mg bid), which resulted in clinical and biochemical control for a period of 5 years, when a pulmonary typical carcinoid was diagnosed and dissected. During the pharmacological treatment period, pasireotide was tentatively discontinued twice, with immediate flare of symptoms and biochemical markers, followed by remission after drug reinitiation.

This is the first report of clinical and biochemical remission of an ectopic CS (ECS) with pasireotide used as first line treatment, in a low-grade lung carcinoid, for a prolonged period of 5 years. In conclusion, the burden of high morbidity caused by hypercortisolism can be effectively mitigated with appropriate pharmacological treatment, in patients with occult tumors. Pasireotide may lead to complete and sustained remission of hypercortisolism, until surgical therapy is feasible. The expression of SSTR2 from typical carcinoids may be critical in allowing the use of very low drug doses for achieving disease control, while minimizing the risk of adverse events.


Development of Human Pituitary Neuroendocrine Tumor Organoids to Facilitate Effective Targeted Treatments of Cushing’s Disease

Abstract

(1) Background: Cushing’s disease (CD) is a serious endocrine disorder caused by an adrenocorticotropic hormone (ACTH)-secreting pituitary neuroendocrine tumor (PitNET) that stimulates the adrenal glands to overproduce cortisol. Chronic exposure to excess cortisol has detrimental effects on health, including increased stroke rates, diabetes, obesity, cognitive impairment, anxiety, depression, and death. The first-line treatment for CD is pituitary surgery. Current surgical remission rates reported in only 56% of patients depending on several criteria. The lack of specificity, poor tolerability, and low efficacy of the subsequent second-line medical therapies make CD a medical therapeutic challenge. One major limitation that hinders the development of specific medical therapies is the lack of relevant human model systems that recapitulate the cellular composition of PitNET microenvironment.
(2) Methods: human pituitary tumor tissue was harvested during transsphenoidal surgery from CD patients to generate organoids (hPITOs).
(3) Results: hPITOs generated from corticotroph, lactotroph, gonadotroph, and somatotroph tumors exhibited morphological diversity among the organoid lines between individual patients and amongst subtypes. The similarity in cell lineages between the organoid line and the patient’s tumor was validated by comparing the neuropathology report to the expression pattern of PitNET specific markers, using spectral flow cytometry and exome sequencing. A high-throughput drug screen demonstrated patient-specific drug responses of hPITOs amongst each tumor subtype. Generation of induced pluripotent stem cells (iPSCs) from a CD patient carrying germline mutation CDH23 exhibited dysregulated cell lineage commitment.
(4) Conclusions: The human pituitary neuroendocrine tumor organoids represent a novel approach in how we model complex pathologies in CD patients, which will enable effective personalized medicine for these patients.

1. Introduction

Cushing’s disease (CD) is a serious endocrine disorder caused by an adrenocorticotropic hormone (ACTH)-secreting pituitary neuroendocrine tumor (PitNET) that stimulates the adrenal glands to overproduce cortisol [1,2,3,4]. The WHO renamed pituitary adenomas as PitNETs [5]. While PitNETs have been defined as benign, implying that these tumors cause a disease that is not life threatening or harmful to health, in fact chronic exposure to excess cortisol has wide-ranging and detrimental effects on health. Hypercortisolism causes increased stroke rates, diabetes, obesity, depression, anxiety, and a three-fold increase in the risk of death from cardiovascular disease and cancer [4,6,7,8].
The first-line treatment for CD is pituitary surgery, which is followed by disease recurrence in 50% of patients during the 10-year follow-up period after surgery in the hands of an experienced surgeon [9,10,11]. Studies have demonstrated that surgical failures and recurrences of CD are common, and despite multiple treatments, biochemical control is not achieved in approximately 30% of patients. This suggests that in routine clinical practice, initial and long-term disease remission is not achieved in a substantial number of CD patients [7,12]. Hence, medical therapy is often considered in the following situations: when surgery is contraindicated or fails to achieve remission, or when recurrence occurs after apparent surgical remission. While stereotactic radiosurgery treats incompletely resected or recurrent PitNETs, the main drawbacks include the longer time to remission (12–60 months) and the risk of hypopituitarism [3,13,14]. There is an inverse relationship between disease duration and reversibility of complications associated with the disease, thus emphasizing the importance of identifying an effective medical strategy to rapidly normalize cortisol production by targeting the pituitary adenoma [4,7,12]. Unfortunately, the lack of current standard of care treatments with low efficacy and tolerability makes CD a medical therapeutic challenge.
The overall goal of medical therapy for CD is to target the signaling mechanisms to lower cortisol levels in the body [15,16]. The drugs offered for treatment of CD vary in the mechanism of action, safety, tolerability, route of administration, and drug–drug interactions [15,16]. In the era of precision medicine [17], where it is imperative to identify effective therapies early, there is an urgent need to accelerate the identification of therapies targeted to the ACTH-secreting pituitary tumor which are tailored for each individual patient. The absence of preclinical models that replicate the complexity of the PitNET microenvironment has prevented us from acquiring the knowledge to advance clinical care by implementing therapies specifically targeting the tumor, which would have a higher efficacy and tolerability for CD patients. In this instance, organoids can replicate much of the complexity of an tumor. An “organoid” is defined as a three-dimensional cell structure, grown from primary cells of dissociated pituitary tumors in Matrigel matrix, which proliferate, and differentiate in three dimensions, eventually replicating key biological properties of the tissue [18]. While pituitary cell lines predominantly represent hormonal lineages, these cultures do not reproduce the primary pituitary tissue because of the tumor transformation and non-physiological 2D culture conditions [19,20,21]. Pituitary tissue-derived organoids have been generated from mouse models [22,23]. While several human and rat pituitary spheroid/aggregate/tumoroid models have been reported, these cultures consist of poorly differentiated cells with high replicative potential which can affect drug response and produce data that poorly translate to the clinic [24,25]. In this study, we developed an organoid model derived from human PitNETs that replicated much of the cellular complexity and function of the patient’s tumor. Organoids derived from corticotroph PitNETs retained the genetic alterations of the patient’s primary tissue.

2. Materials and Methods

2.1. Generation and Culture of Human Pituitary Neuroendocrine Tumor (PitNET) Organoids

Patients with planned transsphenoidal surgery for pituitary tumors were identified in the outpatient neurosurgery clinics. Tissues were collected under the St. Joseph’s Hospital and Barrow Neurological Institute Biobank collection protocol PHXA-05TS038 and collection of outcomes data protocol PHXA-0004-72-29, with the approval of the Institutional Review Board (IRB) and patient consent. Samples were de-identified and shipped to the Zavros laboratory (University of Arizona) for processing.
Pituitary tumor tissue was collected in Serum-Free Defined Medium (SFDM) supplemented with ROCK inhibitor (Y27632, 10 µM), L-glutamine (2 mM), A83-01 (activin receptor-like kinase (Alk) 4/5/7 inhibitor, 0.5 mM), penicillin/streptavidin (1%), kanamycin (1%), amphotericin/gentamycin (0.2%), CHIR-98014 (4 mM), and thiazovivin (TZV, 2.5 mM). Tissues that contained red blood cells were incubated with Red Blood Cell (RBC) Lysis Buffer according to the manufacturer’s protocol (Thermo Fisher Scientific, San Fransisco, CA, USA). Tissues were dissected into small pieces, transferred to digestion buffer (DMEM/F12 supplemented with 0.4% collagenase 2, 0.1% hyaluronic acid, 0.03% trypsin-EDTA) and incubated for 5–10 min at 37 °C with gentle shaking. Tissue was further incubated with Accutase™ (Thermo Fisher Scientific) for 5 min at 37 °C. Enzymatically dissociated cells were pelleted and washed in DPBS supplemented with antibiotics at a 400 relative centrifugal force (RCF) for 5 min. Dissociated adenoma cells were resuspended in Matrigel™, and Matrigel™ domes containing the cells were then plated in culture dishes and overlaid with pituitary growth media (Supplemental Table S1). The culture was maintained at 37 °C at a relative humidity of 95% and 5% CO2. Organoid growth medium was replenished every 3–4 days and passaged after 15 days in culture.

2.2. Generation of Induced Pluripotent Stem Cells (iPSCs)

Induced pluripotent stem cell lines (iPSC lines) were generated from control individuals (no reported disease) or CD patients according to published protocols by the University of Arizona iPSC Core [26]. All human iPSC lines were tested and found to be negative for mycoplasma contamination using the Mycoalert Mycoplasma testing kits (LT07-318, Lonza), and no karyotype abnormalities were found (KaryoStat+, Thermo).

2.3. Pituitary Organoids Generated from iPSCs

Six well culture plates were coated with 2 mL/well 0.67% Matrigel (diluted in E8 media, UA iPSC core, 151169-01) and incubated at 37 °C at a relative humidity of 95% and 5% CO2 overnight. The iPSC lines were reprogrammed from the blood of either a healthy donor (JCAZ001) or a CD patient (iPSC7 and iPSC1063) at the University of Arizona iPSC Core. Passage 12 iPSCs were plated onto the coated plates and incubated at 37 °C at a relative humidity of 95% and 5% CO2. At 70% confluency, cells were passaged to freshly coated 24 well plates at a ratio of 1:8 and grown to 85–90% confluency before beginning the directed differentiation schedule. From days 0 to 3, cells were cultured in E6 media supplemented with 1% penicillin/streptomycin, 10 μM SB431542, and 5 ng/mL BMP4. BMP4 was withdrawn from the culture at day 3. Starting on day 4, the cells were cultured in E6 media, supplemented with 10 μM SB431542, 30 ng/mL human recombinant SHH, 100 ng/mL FGF8b, 10 ng/mL FGF18, and 50 ng/mL FGF10. Fifteen days after culture, the cells were harvested in cold E6 media by pipetting and resuspended in Matrigel™ (20,000 cells/50 mL Matrigel™). Matrigel™ domes containing the cells were plated in culture dishes and overlaid with differentiation media containing E6 media which was supplemented with 10 μM Y-27632, 30 ng/mL human recombinant SHH, 100 ng/mL FGF8b, 10 ng/mL FGF18, and 50 ng/mL FGF10 (Supplemental Table S2). Organoids were cultured for a further 15 days at 37 °C at a relative humidity of 95% and 5% CO2.

2.4. Spectral Flow Cytometry (Cytek™ Aurora)

The multicolor flow cytometry panel was designed using the Cytek® Full Spectrum Viewer online tool to calculate the similarity index (Supplemental Figure S1). The organoids were harvested in cold SFDM media and centrifuged at 400× g for 5 min. Supernatant was discarded and organoids were dissociated to single cells using Accutase® (Thermo Fisher Scientific 00-4555-56). The enzymatic reaction was stopped using prewarmed DPBS, and cells were then centrifuged at 400× g for 5 min and incubated with fluorochrome-conjugated/unconjugated primary surface or cytoplasmic antibodies (Supplemental Figure S1) at 4 °C for 30 min. Cells were then washed with Cell Staining Buffer (BioLegend # 420-201) and incubated with secondary antibodies (Supplemental Figure S1) at 4 °C for 30 min. Cells were fixed using Cytofix/Cytoperm™ Fixation/Permeabilization Solution (BD Biosciences # 554714) at 4 °C for 20 min, followed by washing with Fixation/Permeabilization wash buffer. Cells were labeled with fluorochrome-conjugated/unconjugated intracellular primary antibodies (Supplemental Figure S1) at 4 °C for 30 min, then washed and incubated with secondary antibodies at 4 °C for 30 min. Cells were resuspended in cell staining buffer and fluorescence and measured using the Cytek Aurora 5 Laser Spectral Flow Cytometer. An unstained cell sample was fixed and used as a reference control. UltraComp eBeads™, Compensation Beads (Thermo Fisher Scientific # 01-2222-42) were stained with the individual antibodies and used as single stain controls for compensation and gating. Data were acquired using the Cytek™ Aurora and analyzed using Cytobank software (Beckman Coulter, Indianapolis, IN, USA).

2.5. Whole Mount Immunofluorescence

Organoids were immunostained using published protocols by our laboratory [27,28,29]. Proliferation was measured by using 5-ethynyl-2′-deoxyuridine (EdU) incorporation according to the Manufacturer’s protocol (Click-IT EdU Alexa Fluor 555 Imaging Kit, Thermo Fisher Scientific C10338). Co-staining was performed by blocking fixed organoids with 2% donkey serum (Jackson Immuno Research, # 017-000-121) diluted in 0.01% PBST for 1hr at room temperature. Organoids were then incubated overnight at 4 °C with primary antibodies, followed by secondary antibodies and Hoechst (Thermo Fisher Scientific H1399, 1:1000 in 0.01% PBST) for 1 h at room temperature. Human specific primary antibodies used included: rabbit anti-ACTH (Thermo Fisher Scientific 701293, 1:250), rabbit anti-Synaptophysin (Thermo Fisher Scientific PA5-27286, 1:100), species PIT1 (Thermo Fisher Scientific PA5-98650, 1:50), rabbit anti-LH (Thermo Fisher Scientific PA5-102674, 1:100), mouse anti-FSH (Thermo Fisher Scientific MIF2709, 1:100), mouse anti-PRL (Thermo Fisher Scientific CF500720, 1:100), Alexa Flour conjugated GH (NB500-364AF647, 1:100), and mouse anti-CAM5.2 (SIGMA 452M-95, 1:250). The secondary antibodies used included Alexa Fluor 488 Donkey Anti Rabbit IgG (H+L) (Thermo Fisher Scientific A21206, 1:100) or Alexa Fluor 647 Donkey Anti Mouse IgG (H+L) (Thermo Fisher Scientific A31571, 1:100). Organoids were visualized and images were acquired by confocal microscopy using the Nikon CrestV2 Spinning Disk (Nikon, Melville, NY, USA). Fluorescence intensity and percentage of EdU positive cells of total cells, were calculated using Nikon Elements Software (Version 5.21.05, Nikon, Melville, NY, USA).

2.6. Nuclear Morphometric Analysis (NMA)

Nuclear Morphometric Analysis (NMA) using treated organoids was performed based on a published protocol that measures cell viability based on the changes in nuclear morphology of the cells, using nuclear stain Hoechst or DAPI [30]. Images of organoid nuclei were analyzed using the ImageJ Nuclear Irregularity Index (NII) plugin for key parameters, which included cell area, radius ratio, area box, aspect, and roundness. Using the published spreadsheet template [30], the NII of each cell was calculated with the following formula: NII = Aspect − Area Box + Radius Ratio + Roundness. The area vs. NII of vehicle-treated cells were plotted as a scatter plot using the template, and was considered as the normal cell nuclei. The same plots were generated for each condition, and the NII and area of treated cells were compared to the normal nuclei, and classified as one of the following NMA populations: Normal (N; similar area and NII), Mitotic (S; similar area, slightly higher NII), Irregular (I; similar area, high NII), Small Regular (SR; apoptotic, low area and NII), Senescent (LR; high area, low NII), Small Irregular (SI; low area, high NII), or Large Irregular (LI; high area, high NII). Cells classified as SR exhibited early stages of apoptosis, and cells classified as either I, SI, or LI exhibited significant nuclear damage. The percentage of cells in each NII classification category were calculated and plotted as a histogram using GraphPad Prism.

2.7. ELISA

Concentration of secreted ACTH in conditioned media that was collected from organoid cultures was measured using the Human ACTH ELISA Kit (Novus Biologicals, NBP2-66401), according to the manufacturer’s protocol. The enzyme–substrate reaction was measured spectrophotometrically (BioTek Gen5 Micro Plate Reader Version 3.11, Santa Clara, CA, USA) at a wavelength of 450 nm, and the ACTH concentration (pg/mL) was interpolated by a standard curve with a 4-parameter logistic regression analysis, using GraphPad Prism (Version 9.2.0, San Diego, CA, USA).

2.8. Drug Assay

Patient adenoma-derived pituitary organoids were grown in 96-well plates and treated with 147 small molecules taken from the NCI AOD9 compound library for 72 h. (https://dtp.cancer.gov/organization/dscb/obtaining/available_plates.html (accessed on 22 August 2021)). Drugs were diluted from 10 mM DMSO stock plates into 100 M DMSO working stocks with a final concentration of 1μM. All vehicle controls were treated with 0.1% DMSO. Organoid proliferation was measured using a CellTiter 96® AQueous One Solution Cell Proliferation Assay kit (MTS, Promega, G3582, Madison, WI, USA) according to the manufacturer’s instruction. Organoid death was calculated based on the absorbance readings at 490 nm, collected from the MTS assay relative to the vehicle controls. Drug screens were performed with biological replicates in the same screen. Drugs were selected based on their ability to target key signaling pathways as well as clinical relevance to the treatment. Drug sensitivity is represented by cell viability, and is significant at <0.5 suppressive effect of the drugs. The percent of cell viability relative to the vehicle control was calculated. Correlation coefficients across each organoid were calculated using the Pearson method to assess confidence in replication. The variance component was detected for each drug across all organoids. A random effect model was run with a single random factor for each drug, and estimated variance was calculated by rejecting the null hypothesis that variation was not present among samples. The drug responses were grouped by variance factor, into large (vc > 100), median (100 > vc > 50), and small (vc < 50). A heatmap was used to display the differential responses in cell viability for the drugs.
Drugs that clustered together and showed response within corticotrophs were investigated further based on their mode of action. Pathways (Kegg and Reactome) and gene ontology mapping were conducted for the genes that were being targeted by the drugs, in order to evaluate the key responses in cellular processes. A network was constructed in Cytoscape v 3.8.2 (San Diego, CA, USA) for the purpose of association between the drugs and genes.

2.9. Drug Dose Responses

Organoids were grown in Matrigel™ domes within 96-well round-bottom culture plates. Recombinant human SHH was removed from the pituitary organoid growth media, 24 h prior to drug treatment. Organoids were treated with either vehicle (DMSO), cabergoline (Selleckchem S5842), ketoconazole (Selleckchem S1353), roscovitine (Selleckchem S1153), GANT61 (Stemcell Technologies 73692), pasireotide (TargetMol TP2207), mifeprostone (Selleckchem S2606), etomidate (Selleckchem S1329), mitotane (Selleckchem S1732), metyropane (Selleckchem S5416), or osilodrostat (Selleckchem S7456) at concentrations of 0, 1, 10, 100, 1000, and 10,000 nM, for 72 h. The percentage of cell viability was measured using an MTS assay (Promega G3580). Absorbance was measured at 490 nm and normalized to the vehicle. Concentrations were plotted in a logarithmic scale, and a nonlinear dose response curve regression was calculated using GraphPad Prism. An IC50 value for each drug treatment was determined based on the dose response curve, using GraphPad Prism analysis software.

2.10. Calculation of Area under the Curve (AUC)

AUC (area under the curve) was determined by plotting the normalized % cell viability versus transformed concentration of the drugs, using a trapezoidal approximation for the area [31]. The formula was based on splitting the curve into trapezoids with bases equal to the % viability (V) and height equal to the interval length (difference in concentrations (C), and then summing the areas of each trapezoid:

n0(Vn+Vn1)2(CnCn1)

2.11. Quantitative RT PCR (qRT-PCR)

RNA was collected from patient-derived organoid cultures using the RNeasy Mini Kit (Qiagen). cDNA was generated from the extracted RNA, and then pre-amplified using TaqMan PreAmp Master Mix (Thermo Fisher Scientific 391128). The primers used were human-specific GAPDH (Thermo Fisher Scientific, Applied Biosystems Hs02786624_g1), NR5A1 (SF1) (Thermo Fisher Scientific, Hs00610436_m1), PIT1 (Thermo Fisher Scientific, Hs00230821_m1), TPit (Thermo Fisher Scientific, Hs00193027), and POMC (Thermo Fisher Scientific, Hs01596743_m1). Each PCR reaction was performed using a final volume of 20 µL, composed of 20X TaqMan Expression Assay primers, 2X TaqMan Universal Master Mix (Applied Biosystems, TaqMan® Gene Expression Systems), and a cDNA template. Amplification of each PCR reaction was conducted in a StepOne™ Real-Time PCR System (Applied Biosystems, Foster City, CA, USA), using the following PCR conditions: 2 min at 50 °C, 10 min at 95 °C, denaturing for 15 s at 95 °C, and annealing/extending for 1 min at 60 °C, for a total of 40 cycles. Relative fold change was calculated using the 2 − ∆∆Ct method [32], where CT = threshold cycle. Results were analyzed as the average fold change in gene expression compared to the control, and GAPDH served as an internal control.

2.12. Whole Exome Sequencing

WES was performed by the University of Arizona Center for Applied Genetics and Genomic Medicine. Isolated DNA from patient adenoma tissue will be quantified using the Qubit quantitation system with standard curve, as per the supplier protocol (Thermo Fisher Scientific). All samples were further tested for quality using the Fragment Analyzer (Advanced Analytical), following the manufacturer-recommended protocols. Whole exome sequencing (WES) was performed by array capture and approximately 60 Mb of exome target sequence, using the SureSelectXT Human All Exon V6 enrichment (Agilent) or equivalent (which one was used). All exome library builds were quantified via qPCR and subsequently sequenced to a minimum 20X coverage, using paired-end chemistry on the Illumina NovaSeq platform. Whole exome sequencing (WES) was performed by hybridization capture of approx. 35 Mb of the exome target sequence, using the Swift Exome Hyb Panel (Swift Biosciences 83216). All exome library builds were quantified via qPCR and subsequently sequenced to a minimum 20X coverage, using paired-end chemistry on the Illumina NextSeq500 or NovaSeq platform (Illumina). DNA reads were trimmed, filtered by quality scores and aligned to the human genome (hg38) with Burrows–Wheeler Aligner with default parameters. Picard (http://broadinstitute.github.io/picard (accessed on 22 December 2021)) was used to mark duplicates. Germline single nucleotide variants (SNV) were called using the Genome Analysis Tool Kit (GATK), using the given guidelines. Mutations were annotated using ANNOVAR for coding sequences. Variants that passed the quality filter were further investigated for similarity. Concordance between tissue and organoids was calculated using Jaccard similarity index (Jij = Mij/(Mi + Mj − Mij) where Mi is the number of variants in tissues, Mj is the number of variants in organoids, and Mij is the number of identical variants in both tissue and organoid.

2.13. Single Cell RNA Sequencing (scRNA-Seq)

Cultures were collected on day 15 of the pituitary directed differentiation schedule, and cells were dissociated into a single-cell suspension using Cell Dissociation Buffer (Thermo Fisher Scientific 13151014). Cells (15,000 cells/sample) were resuspended in the sample buffer (BD Biosciences 65000062), filtered using cell strainer (40 microns), and loaded into a BD Rhapsody cartridge (BD Biosciences 400000847) for single-cell transcriptome isolation. Based on the BD Rhapsody system whole-transcriptome analysis for single-cell whole-transcriptome analysis, microbead-captured single-cell transcriptomes were used to prepare a cDNA library. Briefly, double-stranded cDNA was first generated from the microbead-captured single-cell transcriptome in several steps, including reverse transcription, second-strand synthesis, end preparation, adapter ligation, and whole-transcriptome amplification (WTA). Then, the final cDNA library was generated from double-stranded full-length cDNA by random priming amplification using a BD Rhapsody cDNA Kit (BD Biosciences, 633773), as well as the BD Rhapsody Targeted mRNA and WTA Amplification Kit (BD Biosciences, 633801). The library was sequenced in PE150 mode (paired-end with 150-bp reads) on NovaSeq6000 System (Illumina). A total of 80,000 reads were demultiplexed, trimmed, mapped to the GRCh38 annotation, and quantified using the whole transcriptome analysis pipeline (BD Rhapsody™ WTA Analysis Pipeline v1.10 rev6, San Jose, CA, USA) on the Seven Bridges Genomics platform (https://igor.sbgenomics.com (accessed on 4 April 2022)), prior to clustering analysis in Seurat. For QC and filtration, read counting and unique molecular identifier (UMI) counting were the principal gene expression quantification schemes used in this single-cell RNA-sequencing (scRNA-seq) analysis. The low-quality cells, empty droplets, cell doublets, or multiplets were excluded based on unique feature count (less than 200 or larger than 2500), as they may often exhibit either an aberrantly high gene count or very few genes. Additionally, the mitochondrial QC metrics were calculated, and the cells with >5% mitochondrial counts were filtered out, as the percentage of counts originating from a set of low-quality or dying cells often exhibit extensive mitochondrial contamination. After the removal of unwanted cells from the single cell dataset, the global-scaling normalization method LogNormalize was employed. This method normalizes the feature expression measurements for each cell by the total expression, multiplies this by a scale factor (10,000), and log-transforms the result. The molecules per gene per cell, based on RSEC error correction (RSEC_MolsPerCell file) matrix files from iPSCctrl and iPSCCDH23 samples, were imported into Seurat v4, merged, and processed (as stated above) for UMAP reduction, cluster identification, and differential marker assessment using the FindAllMarkers function within Seurat.

2.14. Statistical Analyses

Sample size was based on assessment of power analysis using SigmaStat software. Data collected from each study from at least 4 in vitro technical replicates were analyzed by obtaining the mean ± standard error of the mean (SEM), unless otherwise stated. The significance of the results was then tested using commercially available software (GraphPad Prism, GraphPad software, San Diego, CA, USA).

3. Results

3.1. Generation and Validation of Human PitNET Tissue Derived Organoids

Human PitNET tissue was harvested during endoscopic transsphenoidal pituitary surgery from 35 patients in order to generate organoids. These cultures are referred to as human PitNET tissue derived organoids (hPITOs). Supplementary Table S3 summarizes the neuropathology reports and clinical diagnosis from these cases. In summary, 12 corticotroph (functional, CD), and 3 silent corticotroph tumors (nonfunctional tumors), 9 gonadotroph tumors, 8 lactotroph tumors, and 3 somatotroph tumors (acromegaly) were used to generate hPITOs (Supplementary Table S3).
Bright-field microscopy images of hPITOs that were generated from corticotroph adenomas from patients diagnosed with CD (Figure 1a–e). Silent/nonfunctioning tumors (Figure 1f,g) revealed morphological diversity among the organoid lines between individual patients and amongst subtypes. Confocal microscopy was used to capture a z-stack through the hPITO38, immunofluorescently stained for CAM5.2 (red), ACTH (green), and Hoechst (nuclear staining, blue) and emphasizes the 3D cellular structure of the hPITOs (Supplemental Video S1). Lactotroph, gonadotroph, and somatotroph adenomas were used to generate hPITOs, and showed the same morphological divergence amongst subtypes and between each patient line (Supplemental Figure S2). Proliferation was measured within the cultures using 5-ethynyl-2′-deoxyuridine (EdU) uptake and showed that the percentage of EdU+ve cells/total Hoechst+ve nuclei directly correlated with the pathology MIB-1 (Ki67) score (red, R2 = 0.9256) (Figure 1a–g, Supplemental Figure S2). ACTH concentration, which was measured by ELISA using organoid conditioned culture media collected from each hPITO line, showed the highest expression in the corticotroph adenoma organoids generated from CD patients (Figure 1h).
Cells 11 03344 g001 550
Figure 1. Morphology and function of corticotroph hPITOs. (ag) Brightfield images, immunofluorescence staining using antibodies specific for CAM5.2 (red), ACTH (green), and EdU (magenta, inset) of organoid cultures generated from patients with Cushing’s disease (hPITOs 1, 7, 10, 33, 35) or nonfunctional corticotroph adenomas (hPITO8, 12). Quantification of %EdU positive cells/total cell number is shown and compared to the Ki67 score given in the pathology report (Supplemental Table S3). An ELISA was performed using conditioned media collected from (h) corticotroph hPITO cultures and (i) lactotroph, somatotroph, and gonadotroph hPITO cultures for the measurement of ACTH secretion (pg/mL).

3.2. Characterization of Cell Lineages in Pituitary Adenoma-Derived Organoids by Spectral Cytek™ Aurora Analysis

In order to validate the similarity in cell lineages identified between the organoid line and the patient’s tumor, we compared the immunohistochemistry from the neuropathology report (Supplemental Table S3) to the expression pattern of pituitary adenoma-specific markers, which were measured using Cytek™ Aurora spectral flow cytometry (Figure 2). The location of cells that are found in each cluster based on the highly expressed antigens are shown in the representative tSNE (viSNE) maps (Figure 2a). Compared to nonfunctional adenoma-derived hPITOs, organoids derived from corticotroph adenomas of CD patients highly expressed proliferating (Ki67+) T-Pit+ ACTH cells (Figure 2a). Interestingly, there was an increase in SOX2+ cells within the total cell population, associated with Crooke’s cell adenoma hPITOs (Figure 2a). Within the total cell population, cell clusters expressing CD45 and vimentin were also measured (Figure 2a). Data for the analysis of corticotroph hPITOs, derived from CD patients and individuals with nonfunctional adenomas, were summarized in a heatmap for each subtype organoid line based on quantified cell abundance (percent of total cells) using spectral flow cytometry (Figure 2b).
Cells 11 03344 g002 550
Figure 2. Cell heterogeneity of corticotroph hPITOs. (a) viSNE maps define spatially distinct cell populations using pituitary specific cell lineage, stem cell, and transcription factor markers. Cell populations were quantified in organoids generated from CD patients with corticotroph adenomas (sparsely granulated and Crooke’s cell adenoma) or patients with nonfunctional corticotroph adenomas. (b) Quantification of the abundance of cells expressing pituitary specific markers as a percent total. viSNE maps define spatially distinct cell populations in organoid cultures generated from CD patient with (c) corticotroph adenoma (hPITO37, Crooke’s cell adenoma) and adjacent normal tissue (hPITO37N), or (d) sparsely granulated corticotroph adenomas (hPITO38) and adjacent normal tissue (hPITO38N).
Organoid cultures derived from pituitary adenomas (hPITO37 and hPITO38) were compared to organoids derived from adjacent normal pituitary tissue (hPITO37N and hPITO38N) (Figure 2c,d). While Pit1 lineages including cells expressing GH and PRL, as well as SF1 lineages expressing FSH and LH, were detected in the hPITO37N and hPITO38N organoid cultures, these cell populations were significantly reduced within the patient’s matched adenoma tissue (Figure 2c,d). Overall, hPITOs derived from CD patients expressed increased stem and progenitor cell markers, including CXCR4, SOX2, and CD133 (Figure 2). Collectively, our findings of the characterization of the hPITO cultures support our prediction that this in vitro model recapitulates much of the patient’s adenoma pathophysiology.

3.3. Inherent Patient Differences to Drug Response Is Reflected in the Organoid Culture

Tumor recurrence can occur in as many as 30–50% of CD patients after successful surgical treatment [10,33,34]. Unfortunately, bilateral adrenalectomy is the chosen surgical treatment for patients with persistent CD [35]. Bilateral adrenalectomy leads to the increased risk for development of Nelson’s syndrome (progressive hyperpigmentation due to ACTH secretion and expansion of the residual pituitary tumor). Although the risk of developing Nelson’s syndrome following adrenalectomy can be reduced by 50% with stereotactic radiotherapy [35], there is a need to develop medical therapies that directly target the pituitary adenoma. Thus, we established a high-throughput drug screening assay using patient-derived PitNET organoids. After 72 h of treatment, cell viability was measured using an MTS assay, and data were represented as a heatmap whereby blue indicated higher cell death, and red suggested higher cell viability. The replicates behaved consistently with the drug response, with correlation scores of >0.8 for these samples (Figure 3a). We estimated the variance component for each drug across all organoids. Variation among samples was found to be significant (p ≤ 0.05) for each of the 83 drugs. The drug responses were grouped by variance factor into large, median, and small. The larger the variance, the more variable the drug response was across the organoids. We noted a set of drugs that showed a significant differential response across the functional corticotroph organoids. Unsupervised clustering of drug responses across organoids shows a pattern that relates to our statistically calculated results (Figure 3a,c), and the replicates for each independent organoid cluster together. The drugs with higher variance components across all the functional corticotrophs cluster together as a group (Figure 3a). These drugs show cell viability of 10% to 60% across different organoids. Analyzing the pattern more closely, we observe that, within a pathologically defined group, there was a differential organoid response to drugs as well as inherent patient differences to drugs within this group. Figure 3 demonstrates a variation in drug responsiveness amongst the organoid lines generated from individual patients. Importantly, there was further divergence in drug responsiveness amongst the individual organoid lines within each pathologically defined corticotroph subtype. These data clearly demonstrate that the inherent patient difference to drug response which is often observed among CD patients is reflected in the organoid culture.
Cells 11 03344 g003 550
Figure 3. Drug screen using hPITOs generated from CD patients. (a) High-throughput drug screening of hPITOs reveals sensitivities to a range of therapeutic agents. Cell viability with high values (indicating resistance) are depicted in red, and low values (indicating sensitivity) are in blue in the clustered heatmap. (b,c) Clusters showing response to therapeutic agents with the most variance across the organoids. (d) Network of drugs from the clusters b and c and their gene targets, showing their participation in signaling pathways and cellular processes.
Drugs that clustered together and showed correlated responses were investigated further for their mode of action based on target genes (Figure 3d). The genes were analyzed for their associations in cellular pathways and gene ontology functional processes. Identified drug–gene pairs were interconnected by cellular pathways that are known to regulate cell cycle, WNT signaling, hedgehog signaling, and neuroactive ligand-receptor interaction signaling pathways (Figure 3d). These identified genes are also known to be influenced by multiple cellular functions, such as cytokine–cytokine receptor interactions and Notch signaling. Proteosome 20S subunit genes PSMAs/PSMBs and the HDAC gene family are involved in many cellular functions. The ephrin receptors (EPHs), adrenoceptor alpha receptors (ADRs), dopamine receptors (DRDs), and the 5-hydroxytryptamine serotonin receptors (HTRs) gene families influence neuronal functions and are targeted by multiple drugs in our focused cluster. These data reveal potential therapeutic pathways for CD patients.
Divergent half maximal inhibitory concentration (IC50) values, as documented by an MTS cell viability assay, were observed in response to drug treatment among hPITOs lines 28, 33, 34, 35, and 37. Note that a shift of the curve to the right indicates a higher IC50 (i.e., more resistant to that drug). Cell viability assays were normalized to vehicle-treated controls in order to ensure that toxicity was specific to the drug effects (Figure 4). Dose response curves for organoid 33 and organoid 34 showed better responses at lower doses for cabergoline compared to Metyrapone and osilodrostat, but different for organoid 35, where Metyrapone and osilodrostat gave better responses than Cabergoline (Figure 4a–h). For the drugs mifepristone and GANT61, 33 and 34 had the same level of response to both the drugs. However, when the two organoid responses were compared, 34 had a better response than 33 (Figure 4a–h). Similar divergent drug responses were observed in hPITO lines 37 and 38 (Figure 4i,k). However, organoids generated from adjacent normal pituitary tissue from patients 37 and 38 were nonresponsive to the same standard of care of investigational drugs for CD (Figure 4j,l). These data were consistent with observation made in the drug screen (Figure 3a–c), and demonstrate that there was an inherent difference to drug response within the organoid cultures of the same corticotroph subtype.
Cells 11 03344 g004 550
Figure 4. Drug dose responses by hPITOs generated from CD patients. Dose responses to mifepristone, GANT61, cabergoline, and osilodrostat. (a,e) hPITO28, (b,f) hPITO33, (c,g) hPITO34, and (d,h) hPITO35. Dose responses to cabergoline, ketoconazole, roscovitine, GANT61, pasireotide, mifepristone, etomidate, mitotane, metyrapone, and osilodrostat in (i) hPITO37, (j) organoids generated from adjacent normal pituitary tissue (hPITO37N), (k) hPITO38, (l) hPITO38N, and (m) hPITO39. (n) IC50 and integrated area under the curve in response to mifepristone, ketoconazole, and pasireotide using hPITO39 cultures. Nuclear morphometric analysis of hPITO39 cultures in response to (o,p) vehicle, (q,r) mifepristone, (s,t) pasireotide, and (u,v) ketoconazole. Morphometric classification of NII was based on the normal (N), small (S), small regular (SR), short irregular (SI), large regular (LR), large irregular (LI), and irregular (I) nuclear morphology. Representative Hoechst staining of organoids in response to drug treatments for the calculation of the nuclear irregularity index (NII) are shown in the insets in (p,r,t,v).
In addition to cell viability, Nuclear Morphometric Analysis (NMA) using treated organoids was performed based on a published protocol that measures cell viability according to the changes in nuclear morphology of the cells, using nuclear stain Hoechst or DAPI [30]. Nuclear Irregularity Index (NII) was measured based on the quantification of the morphometric changes in the nuclei in response to the standard-of-care drugs mifepristone, pasireotide, and ketoconazole in hPITO39 (Figure 4o–v). The area vs. NII of vehicle-treated cells were plotted as a scatter plot using the template, and considered as the normal cell nuclei (Figure 4o). The same plots were generated for mifepristone (Figure 4q), pasireotide (Figure 4s), and ketoconazole (Figure 4u). The NII and area of treated cells were compared to those of the normal nuclei, and classified as one of the following NMA populations: Normal (N; similar area and NII), Mitotic (S; similar area, slightly higher NII), Irregular (I; similar area, high NII), Small Regular (SR; apoptotic, low area and NII), Senescent (LR; high area, low NII), Small Irregular (SI; low area, high NII), or Large Irregular (LI; high area, high NII) (Figure 4p,r,t,v). Cells classified as SR exhibited early stages of apoptosis, and cells classified as either I, SI, or LI exhibited significant nuclear damage. Data showed that mifepristone induced significant apoptosis in hPITO39 cultures (Figure 4r), compared to responses to pasireotide (Figure 4t) and ketoconazole (Figure 4v). These responses were consistent with the IC50 and the total area under the curve in response to drugs (Figure 4m,n). Measurement of NII is an approach which may be used to confirm potential drug targets identified from the drug screen.

3.4. Organoid Responsiveness to Pasireotide Correlates with SSTR2 and SSTR5 Expression

Organoid lines hPITO28, 31, 33, 34, and 35 exhibited divergent IC50 values in response to SSTR agonist pasireotide (Figure 5a). hPITO34 was the most responsive to pasireotide, with a low IC50 value of 6.1 nM (Figure 5a). Organoid lines hPITO33 and hPITO35 were the least responsive, with IC50 values of 1.2 µM and 1 µM, respectively, in response to pasireotide (Figure 5a). The expression of SSTR subtypes 1–5 among the different organoid lines were measured by qRT-PCR and IHC (Figure 5b). One of the least responsive organoid lines, hPITO28, exhibited lower differential expression in SSTR2 and SSTR5 compared to the highly responsive hPITO34 line (Figure 5a,b). Gene expression levels of SSTR2 and SSTR5 within hPITO28 and 34 correlated with protein levels within the patient’s tumor tissue (Figure 5c–f). Given the greater binding affinity for SSTR5 compared to SSTR2 by pasireotide, these data were consistent with greater responsiveness to the drug by hPITO34 in comparison to hPITO28 (Figure 5a,c–f). The expression of SSTR subtypes 2 and 5 within the organoid cultures correlated with the expression patterns of the patient’s tumor tissues (Figure 5a,c–f).
Cells 11 03344 g005 550
Figure 5. SSTR1-5 expression in hPITOs and patient’s PitNET tissue. (a) Dose response of hPITO28, 31, 33, 34, and 35 lines to pasireotide. (b) Differential expression of SSTR subtypes 1–5 (SSTR1, SSTR2, SSTR3, SSTR4, SSTR5) in hPITO28, hPITO31, hPITO33, hPITO34, and hPITO35. Immunohistochemistry of (c,e) SSTR2 and (d,f) SSTR5 expression in patient PitNET tissue (Pt28 and Pt34), from which hPITO28 and 34 were generated.

3.5. Organoids Derived from Pituitary Corticotroph Adenomas Retain the Genetic Alterations of the Patient’s Primary Tumor

In order to identify the genetic features of the organoids derived from pituitary adenomas of CD patients, we performed whole-exome sequencing (WES) of hPITOs and the corresponding primary adenoma tissues. We performed WES analysis of each hPITO line, and compared the results with those for the corresponding primary adenoma tissues. We showed the concordance rate of exonic variants between the primary tumor tissues obtained from CD patients and the corresponding organoid line. We identified, on average, approximately 5000 mutations across each of the 14 paired samples of organoids and tissues. For the variants detected, all seven pairs showed a Jaccard index ranging from 0.5 to 0.8. Out of seven pairs, five (hPITO24, 25, 28 and 35) pairs had a Jaccard score of 0.8, while hPITO33 and 34 pairs had 0.7, and hPITO1 had 0.5. In order to investigate the similarity across the SNV (single nucleotide variation) sites, we calculated the Jaccard index of exon sites for synonymous and non-synonymous events, and found scores for all pairs ranging from 0.8 to 0.9. Furthermore, for only non-synonymous events, Jaccard scores also ranged from 0.8 to 0.9, except for hPITO1, which showed overall lower concordance, and had a score of 0.4 to 0.5. Figure 6 shows non-synonymous mutations found in organoid and tissue pairs for some of the key genes that are known to be involved in pituitary adenoma disease. Concordance indices between organoids and the matched patient’s adenoma tissues is reported in Figure 6. Therefore, WES data demonstrated that organoids derived from pituitary corticotroph adenomas retained the genetic alterations of the patient’s primary tumor tissue.
Cells 11 03344 g006 550
Figure 6. Genomic landscape of hPITOs recapitulates genetic alterations commonly found PitNETs. Overview of single nucleotide variation events detected in hPITOs in genes commonly altered in PitNETs. The mutation frequency across the organoid population is depicted on the right. Color coding of the figure shows that organoid lines are derived from the same patient tumor tissue. ORG: organoid line, TIS: matched patient’s PitNET tissue.

3.6. IPSC Pituitary Organoids Generated from a CD Patients Expressing Familial Mutations Reveal Corticotroph Adenoma Pathology In Vitro

Extensive research has revealed the role of somatic and germline mutations in the development of CD adenomas [36,37]. Pituitary organoids were developed from iPSCs generated from the PBMCs of CD patients and carrying germline mutations that were identified by WES (Supplemental Figure S4). Chromosomal aberrations were not found when comparing against the reference dataset in the iPSCs generated from the CD patients (Supplemental Figure S3a,b). PBMCs isolated from patients diagnosed with CD were analyzed by WES in order to determine the expression of germline mutations. WES revealed the expression of a more recently identified gene predisposing patients to CD, namely cadherin-related 23 [38] (Supplemental Figure S5).
Pituitary organoids were then developed from iPSCs which were generated from the PBMCs of patients with CD (iPSCCDH23 and iPSCMEN1) and a healthy individual (iPSCctrl). Expression of PIT1 (pituitary-specific positive transcription factor 1), ACTH (adrenocorticotropic hormone), GH (growth hormone), FSH (follicle-stimulating hormone), LH (luteinizing hormone), PRL (prolactin), and synaptophysin (synaptophysin) with co-stain Hoechst (nuclei, blue) was measured by immunofluorescence, using chamber slides collected at 15 of the differentiation schedules (Supplemental Figure S6). While pituitary tissue that was differentiated from iPSCctrl expressed all major hormone-producing cell lineages (Supplemental Figure S6a), there was a significant increase in the expression of ACTH and synaptophysin, with a concomitant loss of PIT1, GH, FSH, LH, and PRL in iPSCsMEN1 (Supplemental Figure S6b,c). Interestingly, iPSCCDH23 cultures exhibited a significant increase in the expression of ACTH, GH, LH, and synaptophysin, with a concomitant loss of PIT1, FSH, and PRL (Supplemental Figure S6b,c). Immunofluorescence of iPSCs collected on the fourth day of the differentiation schedule revealed no expression of PIT1, ACTH, GH, FSH, LH, or PRL in (data not shown). Compared to control lines, iPSC lines expressing mutated CDH23 secreted significantly greater concentrations of ACTH earlier in the differentiation schedule (Supplemental Figure S7a). The upregulated expression of pituitary corticotroph adenoma-specific markers in iPSCCDH23 and iPSCMEN1 demonstrates that the iPSC-derived organoids represented the pathology of corticotroph adenomas in vitro.

3.7. ScRNA-seq Reveals the Existence of Unique Proliferative Cell Populations in iPSCCDH23 Cultures When Compared to iPSCsctrl

Using Seurat to identify cell clusters, as well as Uniform Manifold Approximation and Projection 9UMAP, clustering analysis identified 16 distinct cell populations/clusters consisting of known marker genes. Clusters 1, 5, and 7 of the iPSCsCDH23 were distinct from the iPSCctrl cultures (Figure 7a,b). Pituitary stem cells were characterized in iPSCctrl and iPSCCDH23 cultures (Figure 7b). Clusters 1 and 5 expressed markers consistent with the corticotroph subtype cell lineage (Figure 5c). Markers of dysregulated cell cycles and increased proliferation were identified in cell cluster 7 (Figure 7c). Expression of the E2 factor (E2F) family of transcription factors, which are downstream effectors of the retinoblastoma (RB) protein pathway and play a crucial role in cell division control, were identified in distinct cell cluster 7, which was identified within the iPSCCDH23 cultures (Figure 7c). Stem cell markers were also upregulated in cell cluster 7, and identified within the iPSCCDH23 cultures (Figure 7c). Using Cytobank software to analyze organoids collected 30 days post-differentiation, cells were gated on live CK20 positive singlets, and 9000 events per sample were analyzed by the viSNE algorithm. ViSNE plots are shown in two dimensions with axes identified by tSNE- 1 and tSNE-2, and each dot representing a single cell positioned in the multidimensional space (Figure 7d). Individual flow cytometry standard files were concatenated into single flow cytometry standard files, from which 12 spatially distinct populations were identified (Figure 7e). Overlaying cell populations identified by traditional gating strategies onto viSNE plots identified unique cell populations within the iPSCCDH23 cultures (Figure 7e). There were distinct cell populations between the iPSCctrl and iPSCCDH23 organoids, in addition to expression of hormone and cell lineage markers such as ACTH, TPit, PRL, and PIT1 (Figure 7e). The cell populations that exhibited high expression of Ki67 within the iPSCctrl organoid cultures included SOX2+ and PIT1+ populations (Figure 7f). The highly proliferating cell populations within the iPSCCDH23 organoid cultures included those that expressed CD90+/VIM+/CXCR4+ (mesenchymal stem cells), CXCR4+/SOX2+ (stem cells), TPit+ (corticotroph cell lineage), CD133+/CD31+ (endothelial progenitor cells), and CK20+/VIM+/CXCR4+ (hybrid epithelial-mesenchymal stem cells) (Figure 7f). Overall, the iPSCCDH23 organoids were significantly more proliferative compared to the iPSCctrl cultures (Figure 7f). Immunofluorescence staining of iPSCCDH23 organoids revealed increased mRNA expression of TPit and POMC, which correlated with increased ACTH protein compared to iPSCsctrl (Supplemental Figure S6). As shown in Supplemental Figure S6b,c, iPSCCDH23 cultures also exhibited a significant increase in the expression of GH and LH (Supplemental Figure S6b,c).
Cells 11 03344 g007 550
Figure 7. Single cell analysis of iPSCctrl and iPSCCDH23 cultures 15 and 30 days post-directed differentiation. (a) UMAP plots showing identified cell clusters 0–16 in iPSCctrl and iPSCCDH23 cultures 15 days post-directed differentiation. (b) Violin plots of representative identified markers of the corticotroph cell lineage, where 2 subpopulations were observed among iPSCctrl and iPSCCDH23 cultures. Arrows highlight clusters 1, 5, and 7. (c) Violin plots showing expression of genes representative of stem cells, Wnt, NOTCH, Hh and SST signaling, anterior pituitary (corticotroph) cell lineage, and cell cycle in clusters 1, 5, and 7 of iPSCCDH23 cultures. Plot width: cell number, plot height: gene expression. (d) viSNE maps showing concatenated flow cytometry standard files for both samples and iPSCctrl and iPSCCDH23 organoids 30 days post-directed differentiation. (e) Overlay of manually gated cell populations onto viSNE plots. (f) Fluorescent intensity of Ki67 of viSNE maps for both samples and iPSCctrl and iPSCCDH23 organoids. iPSCctrl = 22518 events; iPSCCDH23 = 17542 events.
Collectively, Figure 7 demonstrates that the development of pituitary organoids generated from iPSCs of CD patients may reveal the existence of cell populations which, potentially, contribute to the support of adenoma growth and progression, as well as an expansion of stem and progenitor cells that may be the targets for tumor recurrence.

4. Discussion

Our studies demonstrate the development of organoids generated from human PitNETs (hPITOs) can potentially be used to screen for the sensitivity and efficacy of responses to targeted therapies for CD patients that either fail to achieve remission or exhibit recurrence of disease after surgery. In addition, we have documented that induced pluripotent stem cells (iPSCs) generated from a CD patient expressing germline mutation CDH23 (iPSCCDH23) reveals the disease pathogenesis under directed differentiation. Many early in vitro experiments have used pituitary cell lines, spheroids, aggregates, and/or tumoroids that do not replicate the primary PitNET microenvironment [19,20,21], and lack a multicellular identity [39,40]. The development of PitNET tissue-generated organoids is limited to the use of transgenic mouse models as the source [22,23,41]. The recent organoid cultures reported by Nys et al. [42] have been generated from single stem cells isolated from PitNET tissue, and are claimed to be true organoids due to their clonality. However, multicellular complexity was not validated by the protein expression or hormone secretion from pituitary cell lineages in these cultures [42]. According to the National Cancer Institute (NCI, NIH), an ‘organoid’ is defined as “a tiny, 3-dimensional mass of tissue that is made by growing stem cells (cells from which other types of cells develop) in the laboratory” [43]. The hPITOs reported here begin from single and/or 3–4 cell clusters dissociated from the PitNET tissue that harbors the stem cells. Supplemental Video S2 demonstrates a process of ‘budding,’ as well as lumen formation as organoids grow and differentiate. We document differentiation and function by comprehensive spectral flow cytometry, ELISA, and response to standard of care drugs. The growth of PitNET organoids reported in the current study is consistent with that of gastrointestinal tissue derived cultures that begin from cell clusters, crypts, or glands [27,44,45].
Our studies report a PitNET tissue organoid culture with a multicellular identity consisting of differentiated cell lineages, stem/progenitor cells, and immune and stromal cell compartments, which replicates much of the patient’s own adenoma pathology, functionality, and complexity. We have also demonstrated that iPSCs, derived from the blood of a CD patient, can be directly differentiated into pituitary organoids that resemble similar characteristics to the tumor tissue. Many investigators have proposed the use of organoids in personalized medicine, but have focused these efforts on targeted treatment of cancers [27,46,47,48]. The findings reported in these studies are the first to implement this approach for the potential treatment of PitNETs. Collectively, we have developed a relevant human in vitro approach to potentially advance our knowledge as well as our approach to studies in the field of pituitary tumor research. Both the hPITOs and the iPSCCDH23 may be implemented in studies that strive to (1) define the molecular and cellular events that are crucial for the development of PitNETs leading to CD, and (2) accelerate the identification of effective targeted therapies for patients with CD.
While published studies have advanced our understanding of the molecular mechanisms of the pathogenesis of corticotroph adenomas and elucidated candidate therapeutic targets for CD, these reports fall short of directly informing clinical decisions for patient treatment. Using organoids to screen potential drugs and compounds can potentially improve therapeutic accuracy. Figure 3 demonstrated a variation in drug responsiveness amongst the organoid lines generated from individual patients. Importantly, there was further divergence in drug responsiveness amongst the individual organoid lines within each pathologically defined corticotroph subtype. For example, hPITOs generated from patients with sparsely granulated corticotroph adenomas (hPIT0s 10, 25, 34, 35) and Crooke’s cell adenomas (hPITOs 7, 33) showed variable responses regardless of similar pathologically defined subtypes. In addition, the response of the tumor cells within the organoids to the standard of care drugs that directly target the pituitary in the body, including mifepristone and cabergoline, was only 50% in hPITO34 and hPITO35, and almost 0% in the other lines, including hPITO7, 10, and 25. These data clearly demonstrate that the inherent patient difference to drug response that is often observed among CD patients is reflected in the organoid culture. This culture system may be an approach that will provide functional data revealing actionable treatment options for each patient. Patient-derived organoids from several tumors have served as a platform for testing the efficacy of anticancer drugs and predicting responses to targeted therapies in individual patients [27,46,48,49,50]. An example of the use of organoids in identifying drug responsiveness within an endocrine gland is that of papillary thyroid cancer [51]. Organoids developed from PTC patients were used as a preclinical model for studying responsiveness to anticancer drugs in a personalized approach [51]. However, our study is the first report of the use of hPITOs for drug screening. Connecting genetic and drug sensitivity data will further categorize corticotroph subtypes associated with CD. WES analysis of each hPITO line was compared to the results for the corresponding primary adenoma tissues. We showed the concordance rate of exonic variants between the primary tumor tissues obtained from CD patients and the corresponding organoid line. On average, approximately 80% of the variants observed in the CD patients’ adenoma tissues were retained in the corresponding hPITOs.
Pituitary organoids were also developed from iPSCs generated from PBMCs of a CD patient expressing a germline genetic alteration in cadherin-related 23 CDH23 (iPSCCDH23), a CD patient expressing an MEN1 mutation (iPSCMEN1), and a healthy individual (iPSCctrl). Foundational studies performed by investigators at the genome level have revealed significant knowledge regarding the pathophysiology of CD [36,37,52,53]. In some instances, CD is a manifestation of genetic mutation syndromes that include multiple endocrine neoplasia type 1 (MEN1), familial isolated pituitary adenoma (FIPA), and Carney complex [54,55]. CDH23 syndrome is clinically associated with the development of Usher syndrome, deafness, and vestibular dysfunction [56]. Several mutations in CDH23 are associated with inherited hearing loss and blindness [57]. However, none of the variants found in this study were linked to any symptoms of deafness or blindness. A possible explanation is that deafness-related CDH23 mutations are caused by either homozygous or compound heterozygous mutations [57]. In a study that linked mutations in CDH23 with familial and sporadic pituitary adenomas, it was suggested that these genetic alterations could play important roles in the pathogenesis of CD [38]. Genomic screening in a total of 12 families with familial PitNETs, 125 individuals with sporadic pituitary tumors, and 260 control individuals showed that 33% of the families with familial pituitary tumors and 12% of individuals with sporadic pituitary tumors expressed functional or pathogenic CDH23 variants [38]. Consistent with the expected pathology and function of a PitNET from a patient with CD, iPSCCDH23 organoids exhibited hypersecretion of ACTH, and expression of transcription factors and cell markers were reported in the pathology report for corticotroph PitNETs. Collectively, these findings warrant further investigation to determine whether carriers of CDH23 mutations are at a high risk of developing CD and/or hearing loss. Specifically, clinical investigation is required to determine whether pituitary MRI scans should be adopted in the screening of CDH23-related diseases, including Usher syndrome and age-related hearing loss.
Pituitary organoids generated from iPSCs of a CD patient revealed the existence of cell populations that potentially contribute to the support of PitNET growth and disease progression, as well as an expansion of stem and progenitor cells that may be the targets for tumor recurrence. Organoids derived from both pituitary adenomas and iPSCs exhibited increased expression of stem cell and progenitor markers at both the protein and transcriptomic levels. Unique clusters that were proliferative in the iPSCCDH23 organoids expressed a hybrid pituitary cell population which was in an epithelial/mesenchymal state (CK20+/VIM+/CXCR4+/Ki67+). In support of our findings, a similar report of a hybrid epithelial/mesenchymal pituitary cell has been made as part of the normal developmental stages of the human fetal pituitary [58]. Previous studies have suggested that pituitary stem cells undergo an EMT-like process during cell migration and differentiation [59,60,61]. Consistent with our findings are extensive studies using single cells isolated from human pituitary adenomas to show increased expression of stem cell markers SOX2 and CXCR4 [22,23,41,62,63]. Within the clusters identified in the iPSCCDH23 culture were cell populations expressing stem cell markers, including SOX2, NESTIN, CXCR4, KLF4, and CD34. The same iPSCCDH23 cell clusters, 4, 8, 9, and 11, co-expressed upregulated genes of NOTCH, Hedgehog, WNT, and TGFβ signaling, which are pivotal not only in pituitary tumorigenesis and pituitary embryonic development, but also in ‘tumor stemness’ [22,23,41,62,63,64]. We also noted that clusters of cell populations 5 and 14 unique within the iPSCCDH23 cultures expressed upregulated genes which were indicative of high proliferation. We observed upregulated expression of the E2F family of transcription factors (E2Fs) E2F1 and E2F7. These findings are of significance, given that there is evidence to show that upregulation of E2Fs is fundamental for tumorigenesis, metastasis, drug resistance, and recurrence [65]. Within the pituitary adenoma microenvironment, whether these stem cells directly differentiate into pituitary tumors or support the growth of the adenoma is largely unknown. In addition, whether pituitary stem cell populations become activated in response to injury is also understudied. Although the role of stem cells has been identified using a mouse model through implantation of the cells within the right forebrain [66], the identification of pituitary tumor-initiating stem cells using in vivo orthotopic transplantation models is impossible in mice. Pituitary tumors harboring the stem cells may require engraftment within the environment from which the cells are derived in order to enable growth and differentiation of the tumor. However, it is technically impossible to implant cells orthotopically in the murine pituitary. The pituitary tumor organoid cultures presented in these studies may offer an approach by which isolation, identification, and characterization of this stem cell population is possible. Therefore, we would gain knowledge on the mechanisms of pituitary tumor pathogenesis and reveal potential novel targets for therapeutic interventions by using the iPSC generated pituitary organoid culture.
PitNETs associated with the development of CD cause serious morbidity due to chronic cortisol exposure that dysregulates almost every organ system in the body. Overall, existing medical therapies remain suboptimal, with negative impact on health and quality of life, including considerable risk of therapy resistance and tumor recurrence. To date, little is known about the pathogenesis of PitNETs. Here, we present a human organoid-based approach that will allow us to acquire knowledge of the mechanisms underlying pituitary tumorigenesis. Such an approach is essential to identify targeted treatments and improve clinical management of patients with CD.

5. Conclusions

Cushing’s disease (CD) is a serious endocrine disorder caused by an adrenocorticotropic hormone (ACTH)-secreting pituitary neuroendocrine tumor (PitNET), which stimulates the adrenal glands to overproduce cortisol. The absence of preclinical models that replicate the PitNET microenvironment has prevented us from acquiring the knowledge to identify therapies that can be targeted to the tumor with a higher efficacy and tolerability for patients. Our studies demonstrate the development of organoids generated from human PitNETs or induced pluripotent stem cells as an essential approach to identifying targeted therapy methods for CD patients.

Supplementary Materials

The following supporting information can be downloaded at: https://www.mdpi.com/article/10.3390/cells11213344/s1, Figure S1: Antibodies used and Cytek® Full Spectrum Viewer showing calculated similarity indices; Figure S2: Morphology and proliferation of lactotroph, somatotroph, and gonadotroph hPITOs; Table S1: Pituitary Growth Media; Table S2: Components used for pituitary organoids generated from iPSCs; Table S3: clinical characteristics of pituitary adenoma samples used for the generation of organoids; Table S4: Average correlation of replicates reported in Figure 3; Table S5: pituitary cell lineage or stem cell markers used in the scRNA-seq analysis; Video S1: hPITO38 EdU ACTH 3.

Author Contributions

Conceptualization, Y.Z.; methodology, J.C., Y.Z., J.M.C., B.N.S., S.M. and K.W.P.; software, J.C., Y.Z., J.M.C., S.M., Y.C., P.M. and R.P.; validation, Y.Z., J.C., J.M.C., A.S.L., K.C.J.Y. and R.P.; formal analysis, J.C., Y.Z., J.M.C., R.P., Y.C., S.M. and P.M.; investigation, Y.Z.; resources, Y.Z., J.C., J.E., C.A.T., B.H. and A.S.L.; data curation, J.C., Y.Z., J.M.C., R.P. and S.M.; writing—original draft preparation, Y.Z., J.C, S.M., J.M.C., Y.C., B.H. and R.P.; writing—review and editing, Y.Z., J.C., J.M.C., A.S.L., K.C.J.Y., S.M., J.E., C.A.T., K.W.P., B.H., Y.C., P.M., B.N.S. and R.P.; visualization, Y.Z., J.C., J.M.C., A.S.L., K.C.J.Y. and R.P.; supervision, Y.Z.; project administration, Y.Z.; funding acquisition, Y.Z. All authors have read and agreed to the published version of the manuscript.

Funding

This research was supported by the Department of Cellular and Molecular Medicine (University of Arizona College of Medicine) startup funds (Zavros). This research study was also partly supported by the National Cancer Institute of the National Institutes of Health under award number P30 CA023074 (Sweasy).

Institutional Review Board Statement

The study was conducted in accordance with the Declaration of Helsinki and approved by the Institutional Review Board of St. Joseph’s Hospital and Barrow Neurological Institute Biobank collection protocol PHXA-05TS038, and collection of outcomes data protocol PHXA-0004-72-29, and patient consent (protocol date of approval).

Informed Consent Statement

Written informed consent was obtained from all subjects involved in the study.

Data Availability Statement

The datasets generated during the analysis of the present study are available in the ReDATA repository, https://doi.org/10.25422/azu.data.19755244.v1. The datasets generated in the current study are also available from the corresponding author on reasonable request. All data generated or analyzed during this study are included in this published article (and its Supplementary Information Files).

Acknowledgments

We acknowledge the technical support of Maga Sanchez in the Tissue Acquisition and Cellular/Molecular Analysis Shared Resource (TACMASR University of Arizona Cancer Center) for assistance with embedding and sectioning of organoids. We would also like to acknowledge Patty Jansma (Marley Imaging Core, University Arizona) and, Douglas W Cromey (TACMASR imaging, University of Arizona Cancer Center) for assistance in microscopy. The authors thank the patients who consented to donate pituitary tumor tissues and blood for the development of the organoids. Without their willingness to participate in the study, this work would not be possible.

Conflicts of Interest

The authors declare no conflict of interest.

References

  1. Cushing, H. Posterior Pituitary Activity from an Anatomical Standpoint. Am. J. Pathol. 1933, 9, 539–548.19. [Google Scholar] [PubMed]
  2. Cushing, H. The basophil adenomas of the pituitary body and their clinical manifestations (pituitary basophilism) 1932. Obes. Res. 1994, 2, 486–508. [Google Scholar] [CrossRef] [PubMed]
  3. Ironside, N.; Chen, C.J.; Lee, C.C.; Trifiletti, D.M.; Vance, M.L.; Sheehan, J.P. Outcomes of Pituitary Radiation for Cushing’s Disease. Endocrinol. Metab. Clin. N. Am. 2018, 47, 349–365. [Google Scholar] [CrossRef]
  4. Loriaux, D.L. Diagnosis and Differential Diagnosis of Cushing’s Syndrome. N. Engl. J. Med. 2017, 377, e3. [Google Scholar] [CrossRef]
  5. Asa, S.L.; Mete, O.; Perry, A.; Osamura, R.Y. Overview of the 2022 WHO Classification of Pituitary Tumors. Endocr. Pathol. 2022, 33, 6–26. [Google Scholar] [CrossRef]
  6. Nishioka, H.; Yamada, S. Cushing’s Disease. J. Clin. Med. 2019, 8, 1951. [Google Scholar] [CrossRef] [PubMed]
  7. Feelders, R.A.; Hofland, L.J. Medical treatment of Cushing’s disease. J. Clin. Endocrinol. Metab. 2013, 98, 425–438. [Google Scholar] [CrossRef]
  8. Limumpornpetch, P.; Morgan, A.W.; Tiganescu, A.; Baxter, P.D.; Nyawira Nyaga, V.; Pujades-Rodriguez, M.; Stewart, P.M. The Effect of Endogenous Cushing Syndrome on All-cause and Cause-specific Mortality. J. Clin. Endocrinol. Metab. 2022, 107, 2377–2388. [Google Scholar] [CrossRef]
  9. Ciric, I.; Zhao, J.C.; Du, H.; Findling, J.W.; Molitch, M.E.; Weiss, R.E.; Refetoff, S.; Kerr, W.D.; Meyer, J. Transsphenoidal surgery for Cushing disease: Experience with 136 patients. Neurosurgery 2012, 70, 70–80; discussion 71–80. [Google Scholar] [CrossRef]
  10. Alexandraki, K.I.; Kaltsas, G.A.; Isidori, A.M.; Storr, H.L.; Afshar, F.; Sabin, I.; Akker, S.A.; Chew, S.L.; Drake, W.M.; Monson, J.P.; et al. Long-term remission and recurrence rates in Cushing’s disease: Predictive factors in a single-centre study. Eur. J. Endocrinol. 2013, 168, 639–648. [Google Scholar] [CrossRef]
  11. Sonino, N.; Zielezny, M.; Fava, G.A.; Fallo, F.; Boscaro, M. Risk factors and long-term outcome in pituitary-dependent Cushing’s disease. J. Clin. Endocrinol. Metab. 1996, 81, 2647–2652. [Google Scholar] [CrossRef] [PubMed]
  12. Van der Pas, R.; Feelders, R.A.; Gatto, F.; De Bruin, C.; Pereira, A.M.; Van Koetsveld, P.M.; Sprij-Mooij, D.M.; Waaijers, A.M.; Dogan, F.; Schulz, S.; et al. Preoperative normalization of cortisol levels in Cushing’s disease after medical treatment: Consequences for somatostatin and dopamine receptor subtype expression and in vitro response to somatostatin analogs and dopamine agonists. J. Clin. Endocrinol. Metab. 2013, 98, E1880–E1890. [Google Scholar] [CrossRef]
  13. Kondziolka, D. Cushing’s disease and stereotactic radiosurgery. J. Neurosurg. 2013, 119, 1484–1485; discussion 1485. [Google Scholar] [CrossRef] [PubMed]
  14. Mehta, G.U.; Sheehan, J.P.; Vance, M.L. Effect of stereotactic radiosurgery before bilateral adrenalectomy for Cushing’s disease on the incidence of Nelson’s syndrome. J. Neurosurg. 2013, 119, 1493–1497. [Google Scholar] [CrossRef] [PubMed]
  15. Tritos, N.A. Adrenally Directed Medical Therapies for Cushing Syndrome. J. Clin. Endocrinol. Metab. 2021, 106, 16–25. [Google Scholar] [CrossRef] [PubMed]
  16. Gheorghiu, M.L.; Negreanu, F.; Fleseriu, M. Updates in the Medical Treatment of Pituitary Adenomas. Horm. Metab. Res. 2020, 52, 8–24. [Google Scholar] [CrossRef]
  17. Kaiser, U.B. Cushing’s disease: Towards precision medicine. Cell. Res. 2015, 25, 649–650. [Google Scholar] [CrossRef]
  18. Bissell, M.S.a.M.J. Organoids: A historical perspective of thinking in three dimensions. J. Cell Biol. 2017, 216, 31–40. [Google Scholar] [CrossRef]
  19. Danila, D.C.; Zhang, X.; Zhou, Y.; Dickersin, G.R.; Fletcher, J.A.; Hedley-Whyte, E.T.; Selig, M.K.; Johnson, S.R.; Klibanski, A. A human pituitary tumor-derived folliculostellate cell line. J. Clin. Endocrinol. Metab. 2000, 85, 1180–1187. [Google Scholar] [CrossRef]
  20. Bjoro, T.; Torjesen, P.A.; Ostberg, B.C.; Sand, O.; Iversen, J.G.; Gautvik, K.M.; Haug, E. Bombesin stimulates prolactin secretion from cultured rat pituitary tumour cells (GH4C1) via activation of phospholipase C. Regul. Pept. 1987, 19, 169–182. [Google Scholar] [CrossRef]
  21. Bjoro, T.; Sand, O.; Ostberg, B.C.; Gordeladze, J.O.; Torjesen, P.; Gautvik, K.M.; Haug, E. The mechanisms by which vasoactive intestinal peptide (VIP) and thyrotropin releasing hormone (TRH) stimulate prolactin release from pituitary cells. Biosci. Rep. 1990, 10, 189–199. [Google Scholar] [CrossRef] [PubMed]
  22. Cox, B.; Laporte, E.; Vennekens, A.; Kobayashi, H.; Nys, C.; Van Zundert, I.; Uji, I.H.; Vercauteren Drubbel, A.; Beck, B.; Roose, H.; et al. Organoids from pituitary as a novel research model toward pituitary stem cell exploration. J. Endocrinol. 2019, 240, 287–308. [Google Scholar] [CrossRef] [PubMed]
  23. Vennekens, A.; Laporte, E.; Hermans, F.; Cox, B.; Modave, E.; Janiszewski, A.; Nys, C.; Kobayashi, H.; Malengier-Devlies, B.; Chappell, J.; et al. Interleukin-6 is an activator of pituitary stem cells upon local damage, a competence quenched in the aging gland. Proc. Natl. Acad. Sci. USA 2021, 118, e2100052118. [Google Scholar] [CrossRef] [PubMed]
  24. Zhang, D.; Hugo, W.; Redublo, P.; Miao, H.; Bergsneider, M.; Wang, M.B.; Kim, W.; Yong, W.H.; Heaney, A.P. A human ACTH-secreting corticotroph tumoroid model: Novel Human ACTH-Secreting Tumor Cell in vitro Model. EBioMedicine 2021, 66, 103294. [Google Scholar] [CrossRef] [PubMed]
  25. Tsukada, T.; Kouki, T.; Fujiwara, K.; Ramadhani, D.; Horiguchi, K.; Kikuchi, M.; Yashiro, T. Reassembly of anterior pituitary organization by hanging drop three-dimensional cell culture. Acta. Histochem. Cytochem. 2013, 46, 121–127. [Google Scholar] [CrossRef] [PubMed]
  26. Narsinh, K.H.; Jia, F.; Robbins, R.C.; Kay, M.A.; Longaker, M.T.; Wu, J.C. Generation of adult human induced pluripotent stem cells using nonviral minicircle DNA vectors. Nat. Protoc. 2011, 6, 78–88. [Google Scholar] [CrossRef]
  27. Steele, N.G.; Chakrabarti, J.; Wang, J.; Biesiada, J.; Holokai, L.; Chang, J.; Nowacki, L.M.; Hawkins, J.; Mahe, M.; Sundaram, N.; et al. An Organoid-Based Preclinical Model of Human Gastric Cancer. Cell. Mol. Gastroenterol. Hepatol. 2019, 7, 161–184. [Google Scholar] [CrossRef]
  28. Bertaux-Skeirik, N.; Feng, R.; Schumacher, M.A.; Li, J.; Mahe, M.M.; Engevik, A.C.; Javier, J.E.; Peek, R.M.J.; Ottemann, K.; Orian-Rousseau, V.; et al. CD44 plays a functional role in Helicobacter pylori-induced epithelial cell proliferation. PLoS Pathog. 2015, 11, e1004663. [Google Scholar] [CrossRef]
  29. Feng, R.; Aihara, E.; Kenny, S.; Yang, L.; Li, J.; Varro, A.; Montrose, M.H.; Shroyer, N.F.; Wang, T.C.; Shivdasani, R.A.; et al. Indian Hedgehog mediates gastrin-induced proliferation in stomach of adult mice. Gastroenterology 2014, 147, 655–666.e9. [Google Scholar] [CrossRef]
  30. Filippi-Chiela, E.C.; Oliveira, M.M.; Jurkovski, B.; Callegari-Jacques, S.M.; da Silva, V.D.; Lenz, G. Nuclear morphometric analysis (NMA): Screening of senescence, apoptosis and nuclear irregularities. PLoS ONE 2012, 7, e42522. [Google Scholar] [CrossRef]
  31. Gagnon, R.C.; Peterson, J.J. Estimation of confidence intervals for area under the curve from destructively obtained pharmacokinetic data. J. Pharm. Biopharm. 1998, 26, 87–102. [Google Scholar] [CrossRef] [PubMed]
  32. Livak, K.; Schmittgen, T. Analysis of relative gene expression data using real-time quantitative PCR and the 2(-Delta Delta C(T)) Method. Methods 2001, 25, 402–408. [Google Scholar] [CrossRef] [PubMed]
  33. Hinojosa-Amaya, J.M.; Varlamov, E.V.; McCartney, S.; Fleseriu, M. Hypercortisolemia Recurrence in Cushing’s Disease; a Diagnostic Challenge. Front. Endocrinol. 2019, 10, 740. [Google Scholar] [CrossRef] [PubMed]
  34. Patil, C.G.; Prevedello, D.M.; Lad, S.P.; Vance, M.L.; Thorner, M.O.; Katznelson, L.; Laws, E.R., Jr. Late recurrences of Cushing’s disease after initial successful transsphenoidal surgery. J. Clin. Endocrinol. Metab. 2008, 93, 358–362. [Google Scholar] [CrossRef]
  35. Katznelson, L. Bilateral adrenalectomy for Cushing’s disease. Pituitary 2015, 18, 269–273. [Google Scholar] [CrossRef]
  36. Reincke, M.; Sbiera, S.; Hayakawa, A.; Theodoropoulou, M.; Osswald, A.; Beuschlein, F.; Meitinger, T.; Mizuno-Yamasaki, E.; Kawaguchi, K.; Saeki, Y.; et al. Mutations in the deubiquitinase gene USP8 cause Cushing’s disease. Nat. Genet. 2015, 47, 31–38. [Google Scholar] [CrossRef]
  37. Chen, J.; Jian, X.; Deng, S.; Ma, Z.; Shou, X.; Shen, Y.; Zhang, Q.; Song, Z.; Li, Z.; Peng, H.; et al. Identification of recurrent USP48 and BRAF mutations in Cushing’s disease. Nat. Commun. 2018, 9, 3171. [Google Scholar] [CrossRef]
  38. Zhang, Q.; Peng, C.; Song, J.; Zhang, Y.; Chen, J.; Song, Z.; Shou, X.; Ma, Z.; Peng, H.; Jian, X.; et al. Germline Mutations in CDH23, Encoding Cadherin-Related 23, Are Associated with Both Familial and Sporadic Pituitary Adenomas. Am. J. Hum. Genet. 2017, 100, 817–823. [Google Scholar] [CrossRef]
  39. Ikeda, H.; Mitsuhashi, T.; Kubota, K.; Kuzuya, N.; Uchimura, H. Epidermal growth factor stimulates growth hormone secretion from superfused rat adenohypophyseal fragments. Endocrinology 1984, 115, 556–558. [Google Scholar] [CrossRef]
  40. Baek, N.; Seo, O.W.; Kim, M.; Hulme, J.; An, S.S. Monitoring the effects of doxorubicin on 3D-spheroid tumor cells in real-time. Onco. Targets 2016, 9, 7207–7218. [Google Scholar] [CrossRef]
  41. Laporte, E.; Nys, C.; Vankelecom, H. Development of Organoids from Mouse Pituitary as In Vitro Model to Explore Pituitary Stem Cell Biology. J. Vis. Exp. 2022. [Google Scholar] [CrossRef] [PubMed]
  42. Nys, C.; Lee, Y.L.; Roose, H.; Mertens, F.; De Pauw, E.; Kobayashi, H.; Sciot, R.; Bex, M.; Versyck, G.; De Vleeschouwer, S.; et al. Exploring stem cell biology in pituitary tumors and derived organoids. Endocr. Relat. Cancer 2022, 29, 427–450. [Google Scholar] [CrossRef]
  43. Available online: https://www.cancer.gov/publications/dictionaries/cancer-terms/def/organoid (accessed on 20 September 2022).
  44. Mahe, M.M.; Aihara, E.; Schumacher, M.A.; Zavros, Y.; Montrose, M.H.; Helmrath, M.A.; Sato, T.; Shroyer, N.F. Establishment of Gastrointestinal Epithelial Organoids. Curr. Protoc. Mouse Biol. 2013, 3, 217–240. [Google Scholar] [CrossRef] [PubMed]
  45. Schumacher, M.A.; Aihara, E.; Feng, R.; Engevik, A.; Shroyer, N.F.; Ottemann, K.M.; Worrell, R.T.; Montrose, M.H.; Shivdasani, R.A.; Zavros, Y. The use of murine-derived fundic organoids in studies of gastric physiology. J. Physiol. 2015, 593, 1809–1827. [Google Scholar] [CrossRef] [PubMed]
  46. Holokai, L.; Chakrabarti, J.; Lundy, J.; Croagh, D.; Adhikary, P.; Richards, S.S.; Woodson, C.; Steele, N.; Kuester, R.; Scott, A.; et al. Murine- and Human-Derived Autologous Organoid/Immune Cell Co-Cultures as Pre-Clinical Models of Pancreatic Ductal Adenocarcinoma. Cancers 2020, 12, 3816. [Google Scholar] [CrossRef] [PubMed]
  47. Boj, S.F.; Hwang, C.I.; Baker, L.A.; Chio, I.I.C.; Engle, D.D.; Corbo, V.; Jager, M.; Ponz-Sarvise, M.; Tiriac, H.; Spector, M.S.; et al. Organoid models of human and mouse ductal pancreatic cancer. Cell 2015, 160, 324–338. [Google Scholar] [CrossRef]
  48. Tiriac, H.; Belleau, P.; Engle, D.D.; Plenker, D.; Deschenes, A.; Somerville, T.D.D.; Froeling, F.E.M.; Burkhart, R.A.; Denroche, R.E.; Jang, G.H.; et al. Organoid Profiling Identifies Common Responders to Chemotherapy in Pancreatic Cancer. Cancer Discov. 2018, 8, 1112–1129. [Google Scholar] [CrossRef]
  49. Driehuis, E.; van Hoeck, A.; Moore, K.; Kolders, S.; Francies, H.E.; Gulersonmez, M.C.; Stigter, E.C.A.; Burgering, B.; Geurts, V.; Gracanin, A.; et al. Pancreatic cancer organoids recapitulate disease and allow personalized drug screening. Proc. Natl. Acad. Sci. USA 2019 116, 26580–26590. [CrossRef]
  50. Jung, Y.H.; Choi, D.H.; Park, K.; Lee, S.B.; Kim, J.; Kim, H.; Jeong, H.W.; Yang, J.H.; Kim, J.A.; Chung, S.; et al. Drug screening by uniform patient derived colorectal cancer hydro-organoids. Biomaterials 2021, 276, 121004. [Google Scholar] [CrossRef]
  51. Chen, D.; Tan, Y.; Li, Z.; Li, W.; Yu, L.; Chen, W.; Liu, Y.; Liu, L.; Guo, L.; Huang, W.; et al. Organoid Cultures Derived From Patients With Papillary Thyroid Cancer. J. Clin. Endocrinol. Metab. 2021, 106, 1410–1426. [Google Scholar] [CrossRef]
  52. Reincke, M.; Theodoropoulou, M. Genomics in Cushing’s Disease: The Dawn of a New Era. J. Clin. Endocrinol. Metab. 2021, 106, e2455–e2456. [Google Scholar] [CrossRef] [PubMed]
  53. Ma, Z.Y.; Song, Z.J.; Chen, J.H.; Wang, Y.F.; Li, S.Q.; Zhou, L.F.; Mao, Y.; Li, Y.M.; Hu, R.G.; Zhang, Z.Y.; et al. Recurrent gain-of-function USP8 mutations in Cushing’s disease. Cell. Res. 2015, 25, 306–317. [Google Scholar] [CrossRef] [PubMed]
  54. Melmed, S. Pathogenesis of pituitary tumors. Nat. Rev. Endocrinol. 2011, 7, 257–266. [Google Scholar] [CrossRef] [PubMed]
  55. Stratakis, C.A.; Tichomirowa, M.A.; Boikos, S.; Azevedo, M.F.; Lodish, M.; Martari, M.; Verma, S.; Daly, A.F.; Raygada, M.; Keil, M.F.; et al. The role of germline AIP, MEN1, PRKAR1A, CDKN1B and CDKN2C mutations in causing pituitary adenomas in a large cohort of children, adolescents, and patients with genetic syndromes. Clin. Genet. 2010, 78, 457–463. [Google Scholar] [CrossRef]
  56. Mouchtouris, N.; Smit, R.D.; Piper, K.; Prashant, G.; Evans, J.J.; Karsy, M. A review of multiomics platforms in pituitary adenoma pathogenesis. Front. Biosci. 2022, 27, 77. [Google Scholar] [CrossRef] [PubMed]
  57. Bolz, H.; von Brederlow, B.; Ramirez, A.; Bryda, E.C.; Kutsche, K.; Nothwang, H.G.; Seeliger, M.; del, C.S.C.M.; Vila, M.C.; Molina, O.P.; et al. Mutation of CDH23, encoding a new member of the cadherin gene family, causes Usher syndrome type 1D. Nat. Genet. 2001, 27, 108–112. [Google Scholar] [CrossRef] [PubMed]
  58. Zhang, S.; Cui, Y.; Ma, X.; Yong, J.; Yan, L.; Yang, M.; Ren, J.; Tang, F.; Wen, L.; Qiao, J. Single-cell transcriptomics identifies divergent developmental lineage trajectories during human pituitary development. Nat. Commun. 2020, 11, 5275. [Google Scholar] [CrossRef]
  59. Cheung, L.Y.; Davis, S.W.; Brinkmeier, M.L.; Camper, S.A.; Perez-Millan, M.I. Regulation of pituitary stem cells by epithelial to mesenchymal transition events and signaling pathways. Mol. Cell. Endocrinol. 2017, 445, 14–26. [Google Scholar] [CrossRef]
  60. Shintani, A.; Higuchi, M. Isolation of PRRX1-positive adult pituitary stem/progenitor cells from the marginal cell layer of the mouse anterior lobe. Stem Cell. Res. 2021, 52, 102223. [Google Scholar] [CrossRef]
  61. Yoshida, S.; Nishimura, N.; Ueharu, H.; Kanno, N.; Higuchi, M.; Horiguchi, K.; Kato, T.; Kato, Y. Isolation of adult pituitary stem/progenitor cell clusters located in the parenchyma of the rat anterior lobe. Stem Cell. Res. 2016, 17, 318–329. [Google Scholar] [CrossRef]
  62. Laporte, E.; Vennekens, A.; Vankelecom, H. Pituitary Remodeling Throughout Life: Are Resident Stem Cells Involved? Front. Endocrinol. 2020, 11, 604519. [Google Scholar] [CrossRef] [PubMed]
  63. Vankelecom, H.; Roose, H. The Stem Cell Connection of Pituitary Tumors. Front. Endocrinol. 2017, 8, 339. [Google Scholar] [CrossRef] [PubMed]
  64. Mertens, F.; Gremeaux, L.; Chen, J.; Fu, Q.; Willems, C.; Roose, H.; Govaere, O.; Roskams, T.; Cristina, C.; Becu-Villalobos, D.; et al. Pituitary tumors contain a side population with tumor stem cell-associated characteristics. Endocr. Relat. Cancer 2015, 22, 481–504. [Google Scholar] [CrossRef] [PubMed]
  65. Chen, H.Z.; Tsai, S.Y.; Leone, G. Emerging roles of E2Fs in cancer: An exit from cell cycle control. Nat. Rev. Cancer 2009, 9, 785–797. [Google Scholar] [CrossRef] [PubMed]
  66. Xu, Q.; Yuan, X.; Tunici, P.; Liu, G.; Fan, X.; Xu, M.; Hu, J.; Hwang, J.Y.; Farkas, D.L.; Black, K.L.; et al. Isolation of tumour stem-like cells from benign tumours. Br. J. Cancer 2009, 101, 303–311. [Google Scholar] [CrossRef] [PubMed]
Publisher’s Note: MDPI stays neutral with regard to jurisdictional claims in published maps and institutional affiliations.

Pasireotide-Induced Shrinkage in GH and ACTH Secreting Pituitary Adenoma

Introduction: Pasireotide (PAS) is a novel somatostatin receptor ligands (SRL), used in controlling hormonal hypersecretion in both acromegaly and Cushing’s Disease (CD). In previous studies and meta-analysis, first-generation SRLs were reported to be able to induce significant tumor shrinkage only in somatotroph adenomas. This systematic review and meta-analysis aim to summarize the effect of PAS on the shrinkage of the pituitary adenomas in patients with acromegaly or CD.

Materials and methods: We searched the Medline database for original studies in patients with acromegaly or CD receiving PAS as monotherapy, that assessed the proportion of significant tumor shrinkage in their series. After data extraction and analysis, a random-effect model was used to estimate pooled effects. Quality assessment was performed with a modified Joanna Briggs’s Institute tool and the risk of publication bias was addressed through Egger’s regression and the three-parameter selection model.

Results: The electronic search identified 179 and 122 articles respectively for acromegaly and CD. After study selection, six studies considering patients with acromegaly and three with CD fulfilled the eligibility criteria. Overall, 37.7% (95%CI: [18.7%; 61.5%]) of acromegalic patients and 41.2% (95%CI: [22.9%; 62.3%]) of CD patients achieved significant tumor shrinkage. We identified high heterogeneity, especially in acromegaly (I2 of 90% for acromegaly and 47% for CD), according to the low number of studies included.

Discussion: PAS treatment is effective in reducing tumor size, especially in acromegalic patients. This result strengthens the role of PAS treatment in pituitary adenomas, particularly in those with an invasive behavior, with progressive growth and/or extrasellar extension, with a low likelihood of surgical gross-total removal, or with large postoperative residual tissue.

Systematic Review Registration: https://www.crd.york.ac.uk/prospero/display_record.php?ID=CRD42022328152, identifier CRD42022328152

Introduction

Pasireotide (PAS) is a novel somatostatin receptor ligand (SRL) with a high affinity for the somatostatin receptor (SSR) type 5 (12). Somatotroph adenomas are usually responsive to first-generation SRLs (octreotide and lanreotide), as they are able to reduce growth hormone (GH) secretion through SSR type 2 (3). In the flow-chart of acromegaly treatment, PAS is suggested in case of resistance to first-generation SRLs, as SSR type 5 is also abundantly expressed in GH-secreting adenomas (3). A phase III study with PAS long-acting release (LAR) proved its efficacy in first-generation SRLs-resistant acromegalic patients after 6 months (4). In the extension study (Colao A et al.), 37% of patients achieved normalization of insulin-like growth factor 1 (IGF-1) and/or GH levels <1 µg/L, considering both those performing the extension treatment and those crossing over from the first-generation SRL-control group to the PAS LAR group. Nearly two-thirds of responses were achieved after at least 6 months of treatment. Up-titration of the dose from 40 to 60 mg monthly enriched the number of responders, suggesting that the PAS LAR effect may be both time- and dose-dependent (5). Concomitant improvement in signs and symptoms has also been confirmed in other series (69).

SSR type 5 is the predominant isoform in human corticotroph adenomas, since it is not down-regulated by high cortisol levels, as SSR type 2 does. Therefore, PAS is the only SRL available in patients with Cushing’s Disease (CD) (2). In a phase III study, subcutaneous (s.c.) PAS proved to be effective in normalizing urinary free cortisol (respectively in 13% and 25% of patients taking 600 µg or 900 µg bis-in-die for 12 months) (10), achieving significant clinical improvement (11). In the same clinical setting, PAS LAR showed similar efficacy and safety profiles (12). These benefits could be maintained for up to 5 years in an extension study (1314). In a recent meta-analysis, PAS treatment provided disease control in 44% of 522 patients with CD (15). Patients harbouring USP-8 mutations demonstrated an increased SSR type 5 expression in the corticotroph adenoma, increasing the likelihood of a positive response to PAS therapy (16). The safety profile of PAS is similar to that of first-generation SRLs, except for a significant worsening in glucose homeostasis (17).

Despite the normalization of hormonal excess, another goal of the medical treatment in GH-secreting pituitary adenomas is the reduction of the size of the adenoma (18). First-generation SRLs proved to be effective in achieving tumor shrinkage in acromegaly: Endocrine Society clinical practice guidelines suggested their role as primary therapy in poor surgical candidates and in those with extrasellar extension without chiasmal compression (18). Cozzi et al. reported in a large prospective cohort of acromegalic patients a significant Octreotide-induced tumor shrinkage in 82% of those receiving SRL as first-line treatment; most of them exhibited an early shrinkage with a progressive trend in reduction later on (19). A meta-analysis of 41 studies reported a significant tumor shrinkage in 50% of included patients (20). Data from the primary treatment with once-monthly lanreotide in surgical naïve patients demonstrated its efficacy in reducing tumor volume, achieving significant tumor shrinkage in 63% of them (21). Hypo-intensity on T2-weighted sequences at baseline magnetic resonance imaging (MRI) seems to predict tumor volume reduction during first-generation SRLs treatment (22). Regarding patients with CD, most patients presented a microadenoma, usually not aggressive or invasive: only in selected cases tumor shrinkage is an aim to achieve in patients with corticotropinoma.

As available data are scarce (or limited to selected studies), and the issue of pituitary adenoma shrinkage is of primary importance in the management of tumors that cannot be addressed through surgery, the aim of this systematic review and meta-analysis is to summarize available data regarding the effect of PAS on tumor size.

Materials and Methods

We used the Population-Intervention-Comparison-Outcome (PICO) model to formulate the research questions for the systematic review (23), as summarised in Figure 1. The systematic review and meta-analysis were conducted and are reported according to the Preferred Reporting Items for Systematic Reviews and Meta-Analysis of Diagnostic Test Accuracy Studies (PRISMA-DTA) statement (24). We registered the protocol on the International Prospective Register of Systematic Reviews database (PROSPERO, https://www.crd.york.ac.uk/PROSPERO, number CRD42022328152).

Figure 1
www.frontiersin.orgFIGURE 1 PICO (Population-Intervention-Comparison-Outcome) model design to our study.

Search Strategy

An extensive Medline search was performed for the research question by two of the authors (F.C. and A.M.) independently, discrepancies were resolved by discussion. The literature search was performed up to January 2022, no language restriction was applied. Research included the following keywords: 1) (“acromegalies” [All Fields] OR “acromegaly”[MeSH Terms] OR “acromegaly”[All Fields]) AND (“pasireotide”[Supplementary Concept] OR “pasireotide”[All Fields]); 2) (“pituitary ACTH hypersecretion”[MeSH Terms] OR (“pituitary”[All Fields] AND “ACTH”[All Fields] AND “hypersecretion”[All Fields]) OR “pituitary ACTH hypersecretion”[All Fields]) AND (“pasireotide”[Supplementary Concept] OR “pasireotide”[All Fields]).

Inclusion and exclusion criteria were specified in advance and protocol-defined, in order to avoid methodological bias for post-hoc analysis. The searches were designed to select all types of studies (retrospective, observational, controlled, randomized, and non-randomized) conducted in patients with acromegaly or CD treated with PAS as monotherapy; the assessment of the proportion of significant tumor shrinkage was an inclusion criterion. Search terms were linked to Medical Subject Headings when possible. Keywords and free words were used simultaneously. Additional articles were identified with manual searches and included a thorough review of other meta-analyses, review articles, and relevant references. Consolidation of studies was performed with Mendeley Desktop 1.19.8.

Study Selection

We included all original research studies conducted in adult patients that underwent PAS treatment used as monotherapy (s.c. bis-in-die and intramuscular once/monthly), that provided sufficient information about tumor size reduction during treatment. In case of overlapping cohorts of patients (as clinical trials with core and extension phases), we included only the extension study, in order to select those patients with measurable tumor shrinkage after long-term treatment. Local reports regarding patients involved in multicenter trials were excluded from the analysis, as they had been already considered in the larger series. Reviewers were not blinded to the authors or journals when screening articles.

Data Extraction and Quality Assessment

Two authors (F.C. and A.M.) read the included papers and extracted independently relevant data, any disagreements were resolved by discussion. If data were not clear from the original manuscript, the authors of the primary study were contacted to clarify the doubts.

Contents of data extraction in the selected paper included: name of the first author, year of publication, setting (referral centre, academic hospital, mono- or multi-centric collection), type of treatment, its dose schedule and duration, pituitary imaging method during follow- up, the endpoint type regarding adenoma size analysis (i.e. primary vs exploratory). When data were reported for each patient or for subgroups, a global percentage of significant tumor shrinkage was calculated considering all subjects involved in the study.

To assess the risk of bias in the included studies, the critical appraisal tool from Joanna Briggs’s Institute (JBI) was adapted to evaluate those considered in our metanalysis (25). Among the items proposed, we selected the most appropriate to our setting: 1. Were the inclusion criteria clearly identified? 2. Were diagnostic criteria for acromegaly or CD well defined? 3. Were valid methods applied to evaluate tumor shrinkage? 4. Was the inclusion of participants consecutive and complete? 5. Was the reporting of baseline participants’ features (demographic and clinical) complete? 6. Was the report of the outcomes clear? 7. Was the report of demographics of the involved sites complete? 8. Was statistical analysis appropriate? For each aspect we assigned as possible choices of answer: yes, no or unclear.

Data Synthesis and Analysis

A qualitative synthesis was performed summarizing the study design and population characteristics (age, male to female ratio, macro- to micro-adenoma ratio, prior treatments).

A random-effect model was used to estimate pooled effects. Forest plots for percentages of significant tumor size reduction were generated to visualize heterogeneity among the studies. In order to assess publication bias, despite the low number of articles considered, we performed funnel plot and asymmetry analysis adjusted for the low number of studies (an Egger’s regression test and a three-parameter selection model where two tailed p < 0.05 was considered statistically significant). The I2 test was conducted to analyze the heterogeneity between studies: an I2 >50% indicated a between-study heterogeneity.

Statistical analyses were performed with R: R-4.1.2 for Windows 10 (32/64 bit) released 2021-11-01 and R studio desktop RStudio Desktop 1.4.1717 for Windows 10 64 bit (R Foundation for Statistical Computing, Vienna, Austria, URL https://www.R-project.org/).

Results

Study Selection

The study selection process for acromegaly is depicted in Figure 2. The electronic search revealed 179 articles, with one duplicate (N = 178). After the first screening, 141 articles did not meet the eligibility criteria and were discarded. The full-text examination of the remaining studies excluded additional 31 articles: 27 did not provide adequate data about tumor size, two represented the core phase of an extension study, another one referred to a subset of patients from a larger study, and the last one did not provide sufficient data about the percentage of tumor size reduction. Thus, six studies fulfilling eligibility criteria (reported in Tables 12), were selected for data extraction and analysis.

Figure 2
www.frontiersin.orgFIGURE 2 Search strategy for acromegaly. * Petersenn S, 2010 (PAS sc, phase II) and Colao A, 2014 (PAS LAR). ** Shimon I, 2015 (PAS LAR). *** Tahara S, 2019 (PAS LAR, phase II). PAS, pasireotide, sc, subcutaneous, LAR, long-acting release.

Table 1
www.frontiersin.orgTABLE 1 Studies considered for the metanalysis in acromegaly.

Table 2
www.frontiersin.orgTABLE 2 Studies considered for the metanalysis in acromegaly.

The study selection process for CD is depicted in Figure 3. The electronic search revealed 122 articles; an additional one had been included post-hoc, through reference analysis of selected articles (N = 123). After the first screening, 91 articles did not meet the eligibility criteria and were discarded. The full-text examination of the remaining studies excluded 29 more articles: 23 did not provide sufficient data on tumor shrinkage, two of them represented the core phase of extension studies, two referred to subsets of patients included in a larger study and two did not provide sufficient data regarding the percentage of tumor size reduction. Thus, three studies fulfilling eligibility criteria (reported in Tables 34) were selected for data extraction and analysis.

Figure 3
www.frontiersin.orgFIGURE 3 Search strategy for Cushing’s Disease. * Lacroix A, 2018 (PAS LAR, phase III) and Lacroix A, 2020 (PAS sc, phase III post-hoc analysis). ** Simeoli C, 2014 (PAS sc) and Colao A 2012 (PAS sc, phase III). *** Daniel E, 2018 (PAS sc and LAR) and Trementino L, 2016 (PAS sc). PAS, pasireotide, sc, subcutaneous, LAR, long acting release.

Table 3
www.frontiersin.orgTABLE 3 Studies considered for the metanalysis in Cushing’s Disease.

Table 4
www.frontiersin.orgTABLE 4 Studies considered for the metanalysis in Cushing’s Disease.

Study Characteristics

Four multi- and two mono-centric studies in patients with acromegaly were considered and analyzed, all presenting a prospective design. Tumor size analysis was not one of the primary endpoints in any of the considered studies; from an initial overall recruitment of 358 patients, only 265 were included for tumor size reduction analysis. Most patients had previously undergone different treatments (Table 1). All studies, except one, used PAS LAR, dose titration was allowed in all trials. Median follow-up ranged from 6 to 25 months; MRI was performed to evaluate tumor size reduction and the criteria for considering it significant was mainly based on tumor volume analysis, except for Lasolle H et al. which considered median height reduction (26). Data from the PAOLA study provided separate percentages of significant tumor shrinkage for PAS at 40 mg or 60 mg once monthly; considering that respectively 12 and 7 patients showed a reduction >25%, a significant shrinkage was reported in 19 out of 79 considered cases (24%) (4). Stelmachowska-Banás et al. described one patient with McCune-Albright’s syndrome presenting with pituitary hyperplasia, without a visible adenoma at MRI; as its pituitary volume decreased during treatment, the patient was included in the group with significant tumor shrinkage (27). No study provided information about macro- to micro-adenoma ratio. Data regarding age and male to female ratio are also reported in Table 2.

Three studies including patients with CD met the eligibility criteria (Tables 34); all of them presented a multicentre prospective design, recruiting 139 patients, most of them assuming PAS as a second-line treatment, after a surgical failure. For tumor shrinkage analysis, a subgroup of 34 patients was considered, taking s.c. PAS bis-in-die in two studies and PAS LAR in the third; in all cases titration was admitted. Tumor size analysis was a secondary endpoint in all three studies. Follow-up ranged from 6 to 60 months; tumor size assessment was performed with pituitary MRI. Only Pivonello et al. evaluated maximum diameter, instead of tumor volume changes (28). The population analyzed for tumor shrinkage mainly presented with a microadenoma. Data regarding age and gender are reported in Table 4. In the trial reported by Petersenn S et al., we arbitrarily fixed the criterion to define a significant tumor volume reduction (at least 25% of the baseline size of the pituitary adenoma), and the proportion of responders was calculated from the supplementary materials accordingly (3/6 = 50%) (13). Pivonello et al. separated patients exhibiting mild-moderate from those with severe hypercortisolism; we considered them together for tumor size analysis obtaining an overall proportion of significant size reduction of 21.4% (3 out of 14 subjects) (28).

Risk of Bias

The evaluation of the risk of bias performed with the adapted JBI tool is reported in Table 5. All studies presented clear diagnostic and inclusion criteria, except that of Lasolle H et al. (26). Although all papers reported a valid tool for tumor shrinkage analysis (MRI), two of them did not analyse tumor volume and did not provide a clear definition of significant size reduction (2628). Regarding other items, the majority of the considered studies did not appear to present a clear source of bias.

Table 5
www.frontiersin.orgTABLE 5 Evaluation of the risk of bias performed with the adapted Joanna Briggs’s Institute (JBI) tool.

Meta-Analysis

In the six studies considered for acromegaly, 37.7% (95%CI: [18.7%; 61.5%]) of patients demonstrated a significant tumor size reduction (Figure 4). As expected, heterogeneity in tumor reduction between studies was high (I2 = 90%). We attempted to address publication bias despite the low-number of studies (Figure 6A): Egger’s regression test did not indicate the presence of funnel plot asymmetry (intercept = -3.15 with 95%CI: [-10.17; 3.85], t = -0.883, p = 0.427) and the three-parameter selection model performed for p < 0.05 (and p < 0.1 as a sensitivity analysis) suggested absence of publication bias (28).

Figure 4
www.frontiersin.orgFIGURE 4 Pooled effect for the proportion of responders (i.e. presenting significant tumor shrinkage) in acromegaly. CI, confidence interval.

In the three studies considered for CD, 41,2% (95%CI: [22.9%; 62.3%]) of patients overall demonstrated a significant tumor size reduction (Figure 5). The heterogeneity in tumor reduction between the studies represented by I2 amounted to 47%. Publication bias analysis (Figure 6B) was performed using Egger’s regression test (intercept = -1.828 with 95%CI: [-14.53; 10.88], t = -0.282, p = 0.825) without evidence of asymmetry. The three-parameter selection model on the contrary could not be performed due to the small number of studies.

Figure 5
www.frontiersin.orgFIGURE 5 Pooled effect for the proportion of responders (i.e. presenting significant tumor shrinkage) in Cushing’s Disease. CI, confidence interval.

Figure 6
www.frontiersin.orgFIGURE 6 (A) Funnel plot assessing publication bias for Acromegaly. (B) Funnel plot assessing publication bias for Cushing’s Disease.

Discussion

The biochemical efficacy of medical treatment with PAS in GH- or ACTH-secreting pituitary adenomas has been described in previous metanalyses for acromegaly (2930) and CD (15), the latter also exploring the clinical benefit. In addition to these reports, this meta-analysis shows that PAS treatment can induce an additional clinically significant tumor shrinkage in approximately 40% of patients.

Acromegaly

Overall, PAS treatment provided tumor shrinkage in 37.7% of the considered patients. A previous metanalysis on octreotide in acromegaly provided a higher percentage of tumor size reduction (over 50%) (20). Nevertheless, since PAS treatment is usually considered as a second- or third-line treatment in the therapeutic flow-chart of acromegaly, the population recruited is mainly composed of patients with first-generation SRL-resistant somatotroph adenomas. This bias in recruited populations of acromegalic patients may explain this difference in the outcome. In a direct comparison, although PAS LAR seemed more effective in achieving biochemical control, both the SRLs, the first- and the second-generation types, achieved similar percentages of tumor shrinkage (67). Moreover, in the crossover extension, the switch from octreotide to PAS was more effective than the reverse schedule, achieving a slightly higher percentage of further significant tumor shrinkage (8). Lasolle et al. reported that the expression of SSR type 5 and the granulation pattern are of limited value for the prediction of PAS responsiveness: 5 out of 9 somatotropinomas in their series were densely granulated (two did not respond to PAS), and the expression of SSR type 5 was modest in one controlled patient (26).

Other than SRLs, a further therapeutic option targeting the somatotroph adenoma is cabergoline, either as monotherapy in mild cases or as an add-on treatment for resistant adenomas (18). In a previous metanalysis, cabergoline in monotherapy resulted less effective than SRLs, achieving tumor shrinkage in about one third of the enrolled patients (31). It should also be mentioned that some studies reported an escape phenomenon from its treatment efficacy (32).

Data coming from the combination of PAS LAR and pegvisomant in acromegaly were not considered in our metanalysis, due to inclusion criteria and variable combination therapy of the two drugs (33). Since some cases of adenoma growth had been reported during pegvisomant use (3435), this combination therapy represents a rational approach, but tumor volume analysis is less reliable, given the purpose of our study. Despite concerns regarding tumor growth, pegvisomant effectiveness in acromegaly is well documented (1829), although the cost of this combination treatment can limit its applicability in real-life practice. Moreover, it is worth mentioning Coopmans and collaborators’ follow-up analysis, suggesting a PAS mediated anti-tumoral effect in acromegaly. During treatment, patients exhibited a significant increase in T2-weighted sequences signal at MRI; moreover, patients exhibiting this MRI characteristic in their adenomas showed a more evident decrease in IGF-1 levels, but not a similar pattern in reduction of pituitary adenoma size (36). This finding may be related to cell degeneration or tumor cell necrosis, without necessarily determining significant tumor size reduction. Further studies, probably with more data coming from histological reports, may be necessary to better understand these findings.

Cushing’s Disease

Overall, PAS treatment provided significant tumor shrinkage in 41.2% of CD patients. Regarding pituitary-directed drugs, at this moment available for CD treatment, the efficacy of cabergoline has been proven in vitro studies, but its efficacy in clinical trials is still debated (1537). In a previous prospective study, cabergoline induced significant tumor shrinkage (defined as tumor volume reduction >20%) in 4 out of 20 (20%) of the patients recruited after 24 months (38). PAS is the only pituitary-directed treatment for this condition approved by Drug Agencies. Although few studies have been considered in this metanalysis, due to the strict inclusion criteria, PAS appears more effective in tumor size reduction versus cabergoline, resulting in a better choice in CD therapy when aiming to control the pituitary adenoma.

In contrast to acromegaly, the majority of CD patients present a microadenoma, suggesting that tumor size might be a less relevant issue during medical treatment, even if the “cure” of the disease may forecast the resolution of the adenoma. Besides, up to 30% of CD patients, depending also on MRI accuracy and neuro-radiologist’s expertise, may present with negative imaging that prevents any evaluation of tumor shrinkage (39). In spite of that, endocrinologists, not so infrequently, deal with aggressive corticotroph adenomas, characterized by invasive local growth and/or resistance to conventional therapies. This challenging entity often requires multidisciplinary expertise to suggest different approaches, including PAS treatment (40). It should be mentioned that some non-pituitary targeting drugs, as inhibitors of cortisol synthesis, have been associated with tumor growth, due to cortisol-ACTH negative feedback. In particular, during osilodrostat treatment in a phase III study, four recruited patients discontinued osilodrostat after a significant increase in tumor volume (two with micro- and two with macro-adenomas 41), and this growth had also been described during ketoconazole and mitotane treatments (42). Thus, it may be speculated that PAS could provide a rational approach as an combination treatment with steroidogenesis inhibitors. Moreover, after bilateral adrenalectomy, pituitary adenoma tumor size is of the utmost importance, as patients may be at risk of developing a progression of the adenoma, the so-called Nelson’s syndrome. In a prospective study from Daniel E et al., PAS proved to be also effective in this setting, reducing ACTH levels and stabilizing the residual tumor over a treatment period of 7 months (43). Further studies, with longer treatment observation, may reveal whether PAS may achieve significant tumor shrinkage in these patients, as suggested by previous case reports in literature (4445).

Conclusion

The main limitation of our study resides in the scarce literature provided up to now (260 patients with acromegaly and 34 with CD), in the different therapy schedules and different criteria for tumor shrinkage in the selected study (largest tumor diameter vs a selected percentage of reduction). Moreover, in none of the study tumor reduction was one of the primary endpoints, and surgery was performed before PAS in most patients (78-88% of CD and 43-96% of acromegaly).

PAS is a novel compound, with a rising role in the treatment of secreting pituitary adenomas. Thus, this topic might be amplified with more data coming from further clinical studies, as real-life studies, possibly also addressing markers predictive of response to this treatment (e.g., expression of SSR type 2 and type 5 or somatic mutations in USP8 at tissue level of ACTH-secreting adenomas). Nevertheless, we can already state that PAS treatment is effective in reducing tumor size, especially in acromegaly. Our results strengthen the role of PAS treatment in somatotroph and corticotroph adenomas, especially when tumor volume is a relevant issue (i.e. tumor progression, extrasellar invasion) (1839), as a neoadjuvant treatment before surgery or as tailored treatment, alone or in combination, in persistent disease or when surgery is not feasible. Future research aiming to characterize markers predictive of response could help to identify optimal candidates for this treatment.

Data Availability Statement

The original contributions presented in the study are included in the article. Further inquiries can be directed to the corresponding author.

Ethics Statement

Informed consent was obtained from all subjects participating in the studies analyzed.

Author Contributions

Authors involved contributed to research as reported: literature search (FC, AM), preparation of original draft (FC, AM, MB, LD), literature review (CS, FC, AM, MF), manuscript editing (CS, FC, AM, MB, LD, MF) and supervision (RM, CS). All authors approved the final version of the paper.

Conflict of Interest

The authors declare that the research was conducted in the absence of any commercial or financial relationships that could be construed as a potential conflict of interest.

Publisher’s Note

All claims expressed in this article are solely those of the authors and do not necessarily represent those of their affiliated organizations, or those of the publisher, the editors and the reviewers. Any product that may be evaluated in this article, or claim that may be made by its manufacturer, is not guaranteed or endorsed by the publisher.

References

1. Chinezu L, Vasiljevic A, Jouanneau E, François P, Borda A, Trouillas J, et al. Expression of Somatostatin Receptors, SSTR2A and SSTR5, in 108 Endocrine Pituitary Tumors Using Immunohistochemical Detection With New Specific Monoclonal Antibodies. Hum Pathol (2014) 45(1):71–7. doi: 10.1016/j.humpath.2013.08.007

PubMed Abstract | CrossRef Full Text | Google Scholar

2. Ceccato F, Scaroni C, Boscaro M. Clinical Use of Pasireotide for Cushing’s Disease in Adults. Ther Clin Risk Manage (2015) 11:425–34. doi: 10.2147/TCRM.S37314

CrossRef Full Text | Google Scholar

3. Melmed S, Colao A, Barkan A, Molitch M, Grossman AB, Kleinberg D, et al. Guidelines for Acromegaly Management: An Update. J Clin Endocrinol Metab (2009) 94(5):1509–17. doi: 10.1210/jc.2008-2421

PubMed Abstract | CrossRef Full Text | Google Scholar

4. Gadelha MR, Bronstein MD, Brue T, Coculescu M, Fleseriu M, Guitelman M, et al. Pasireotide Versus Continued Treatment With Octreotide or Lanreotide in Patients With Inadequately Controlled Acromegaly (PAOLA): A Randomised, Phase 3 Trial. Lancet Diabetes Endocrinol (2014) 2(11):875–84. doi: 10.1016/S2213-8587(14)70169-X

PubMed Abstract | CrossRef Full Text | Google Scholar

5. Colao A, Bronstein MD, Brue T, De Marinis L, Fleseriu M, Guitelman M, et al. Pasireotide for Acromegaly: Long-Term Outcomes From an Extension to the Phase III PAOLA Study. Eur J Endocrinol (2020) 182(6):583. doi: 10.1530/EJE-19-0762

PubMed Abstract | CrossRef Full Text | Google Scholar

6. Colao A, Bronstein MD, Freda P, Gu F, Shen CC, Gadelha M, et al. Pasireotide Versus Octreotide in Acromegaly: A Head-to-Head Superiority Study. J Clin Endocrinol Metab (2014) 99(3):791–9. doi: 10.1210/jc.2013-2480

PubMed Abstract | CrossRef Full Text | Google Scholar

7. Sheppard M, Bronstein MD, Freda P, Serri O, De Marinis L, Naves L, et al. Pasireotide LAR Maintains Inhibition of GH and IGF-1 in Patients With Acromegaly for Up to 25 Months: Results From the Blinded Extension Phase of a Randomized, Double-Blind, Multicenter, Phase III Study. [Published Correction Appears in Pituitary]. (2015) 18(3):385–94. doi: 10.1007/s11102-014-0585-6

CrossRef Full Text | Google Scholar

8. Bronstein MD, Fleseriu M, Neggers S, Colao A, Sheppard M, Gu F, et al. Switching Patients With Acromegaly From Octreotide to Pasireotide Improves Biochemical Control: Crossover Extension to a Randomized, Double-Blind, Phase III Study. BMC Endocr Disord (2016) 16:16. doi: 10.1186/s12902-016-0096-8

PubMed Abstract | CrossRef Full Text | Google Scholar

9. Gadelha M, Bex M, Colao A, Pedroza García EM, Poiana C, Jimenez-Sanchez M, et al. Evaluation of the Efficacy and Safety of Switching to Pasireotide in Patients With Acromegaly Inadequately Controlled With First-Generation Somatostatin Analogs. Front Endocrinol (Lausanne). (2020) 10:931. doi: 10.3389/fendo.2019.00931

PubMed Abstract | CrossRef Full Text | Google Scholar

10. Colao A, Petersenn S, Newell-Price J, Findling JW, Gu F, Maldonado M, et al. A 12-Month Phase 3 Study of Pasireotide in Cushing’s Disease. N Engl J Med (2012) 366(10):914–24. doi: 10.1056/NEJMoa1105743

PubMed Abstract | CrossRef Full Text | Google Scholar

11. Pivonello R, Petersenn S, Newell-Price J, Findling JW, Gu F, Maldonado M, et al. Pasireotide Treatment Significantly Improves Clinical Signs and Symptoms in Patients With Cushing’s Disease: Results From a Phase III Study. Clin Endocrinol (Oxf). (2014) 81(3):408–17. doi: 10.1111/cen.12431

PubMed Abstract | CrossRef Full Text | Google Scholar

12. Lacroix A, Gu F, Gallardo W, Pivonello R, Yu Y, Witek P, et al. Efficacy and Safety of Once-Monthly Pasireotide in Cushing’s Disease: A 12 Month Clinical Trial. Lancet Diabetes Endocrinol (2018) 6(1):17–26. doi: 10.1016/S2213-8587(17)30326-1

PubMed Abstract | CrossRef Full Text | Google Scholar

13. Petersenn S, Salgado LR, Schopohl J, Portocarrero-Ortiz L, Arnaldi G, Lacroix A, et al. Long-Term Treatment of Cushing’s Disease With Pasireotide: 5-Year Results From an Open-Label Extension Study of a Phase III Trial. Endocrine. (2017) 57(1):156–65. doi: 10.1007/s12020-017-1316-3

PubMed Abstract | CrossRef Full Text | Google Scholar

14. Fleseriu M, Petersenn S, Biller BMK, Kadioglu P, De Block C, T’Sjoen G, et al. Long-Term Efficacy and Safety of Once-Monthly Pasireotide in Cushing’s Disease: A Phase III Extension Study. Clin Endocrinol (Oxf). (2019) 91(6):776–85. doi: 10.1111/cen.14081

PubMed Abstract | CrossRef Full Text | Google Scholar

15. Simões Corrêa Galendi J, Correa Neto ANS, Demetres M, Boguszewski CL, Nogueira VDSN. Effectiveness of Medical Treatment of Cushing’s Disease: A Systematic Review and Meta-Analysis. Front Endocrinol (Lausanne). (2021) 12:732240. doi: 10.3389/fendo.2021.732240

PubMed Abstract | CrossRef Full Text | Google Scholar

16. Hayashi K, Inoshita N, Kawaguchi K, Ibrahim Ardisasmita A, Suzuki H, Fukuhara N, et al. The USP8 Mutational Status may Predict Drug Susceptibility in Corticotroph Adenomas of Cushing’s Disease. Eur J Endocrinol (2016) 174(2):213–26. doi: 10.1530/EJE-15-0689

PubMed Abstract | CrossRef Full Text | Google Scholar

17. Samson SL, Gu F, Feldt-Rasmussen U, Zhang S, Yu Y, Witek P, et al. Managing Pasireotide-Associated Hyperglycemia: A Randomized, Open-Label, Phase IV Study. Pituitary. (2021) 24(6):887–903. doi: 10.1007/s11102-021-01161-4

PubMed Abstract | CrossRef Full Text | Google Scholar

18. Katznelson L, Laws ER Jr, Melmed S, Molitch ME, Murad MH, Utz A, et al. Acromegaly: An Endocrine Society Clinical Practice Guideline. J Clin Endocrinol Metab (2014) 99(11):3933–51. doi: 10.1210/jc.2014-2700

PubMed Abstract | CrossRef Full Text | Google Scholar

19. Cozzi R, Montini M, Attanasio R, Albizzi M, Lasio G, Lodrini S, et al. Primary Treatment of Acromegaly With Octreotide LAR: A Long-Term (Up to Nine Years) Prospective Study of its Efficacy in the Control of Disease Activity and Tumor Shrinkage. J Clin Endocrinol Metab (2006) 91(4):1397–403. doi: 10.1210/jc.2005-2347

PubMed Abstract | CrossRef Full Text | Google Scholar

20. Giustina A, Mazziotti G, Torri V, Spinello M, Floriani I, Melmed S. Meta-Analysis on the Effects of Octreotide on Tumor Mass in Acromegaly. PloS One (2012) 7(5):e36411. doi: 10.1371/journal.pone.0036411

PubMed Abstract | CrossRef Full Text | Google Scholar

21. Caron PJ, Bevan JS, Petersenn S, Flanagan D, Tabarin A, Prévost G, et al. Tumor Shrinkage With Lanreotide Autogel 120 Mg as Primary Therapy in Acromegaly: Results of a Prospective Multicenter Clinical Trial. J Clin Endocrinol Metab (2014) 99(4):1282–90. doi: 10.1210/jc.2013-3318

PubMed Abstract | CrossRef Full Text | Google Scholar

22. Potorac I, Petrossians P, Daly AF, Alexopoulou O, Borot S, Sahnoun-Fathallah M, et al. T2-Weighted MRI Signal Predicts Hormone and Tumor Responses to Somatostatin Analogs in Acromegaly. Endocr Relat Cancer. (2016) 23(11):871–81. doi: 10.1530/ERC-16-0356

PubMed Abstract | CrossRef Full Text | Google Scholar

23. Schardt C, Adams MB, Owens T, Keitz S, Fontelo P. Utilization of the PICO Framework to Improve Searching PubMed for Clinical Questions. BMC Med Inform Decis Mak. (2007) 7:16. doi: 10.1186/1472-6947-7-16

PubMed Abstract | CrossRef Full Text | Google Scholar

24. McInnes MDF, Moher D, Thombs BD, McGrath TA, Bossuyt PM. Preferred Reporting Items for a Systematic Review and Meta-Analysis of Diagnostic Test Accuracy Studies: The PRISMA-DTA Statement [Published Correction Appears in JAMA. 2019 Nov 26;322(20):2026]. JAMA. (2018) 319(4):388–96. doi: 10.1001/jama.2017.19163

CrossRef Full Text | Google Scholar

25. Munn Z, Barker TH, Moola S, Tufanaru C, Stern C, McArthur A, et al. Methodological Quality of Case Series Studies: An Introduction to the JBI Critical Appraisal Tool. JBI Evid Synth. (2020) 18(10):2127–33. doi: 10.11124/JBISRIR-D-19-00099

PubMed Abstract | CrossRef Full Text | Google Scholar

26. Lasolle H, Ferriere A, Vasiljevic A, Eimer S, Nunes ML, Tabarin A. Pasireotide-LAR in Acromegaly Patients Treated With a Combination Therapy: A Real-Life Study. Endocr Connect. (2019) 8(10):1383–94. doi: 10.1530/EC-19-0332

PubMed Abstract | CrossRef Full Text | Google Scholar

27. Stelmachowska-Banaś M, Czajka-Oraniec I, Tomasik A, Zgliczyński W. Real-World Experience With Pasireotide-LAR in Resistant Acromegaly: A Single Center 1-Year Observation. Pituitary. (2022) 25(1):180–90. doi: 10.1007/s11102-021-01185-w

PubMed Abstract | CrossRef Full Text | Google Scholar

28. Pivonello R, Arnaldi G, Scaroni C, Giordano C, Cannavò S, Iacuaniello D, et al. The Medical Treatment With Pasireotide in Cushing’s Disease: An Italian Multicentre Experience Based on “Real-World Evidence”. Endocrine. (2019) 64(3):657–72. doi: 10.1007/s12020-018-1818-7

PubMed Abstract | CrossRef Full Text | Google Scholar

29. Leonart LP, Ferreira VL, Tonin FS, Fernandez-Llimos F, Pontarolo R. Medical Treatments for Acromegaly: A Systematic Review and Network Meta-Analysis. Value Health (2018) 21(7):874–80. doi: 10.1016/j.jval.2017.12.014”

PubMed Abstract | CrossRef Full Text | Google Scholar

30. Qiao N, He M, Shen M, Zhang Q, Zhang Z, Shou X, et al. Comparative Efficacy Of Medical Treatment For Acromegaly: A Systematic Review And Network Meta-Analysis Of Integrated Randomized Trials And Observational Studies. Endocr Pract (2020) 26(4):454–62. doi: 10.4158/EP-2019-0528

PubMed Abstract | CrossRef Full Text | Google Scholar

31. Sandret L, Maison P, Chanson P. Place of Cabergoline in Acromegaly: A Meta-Analysis. J Clin Endocrinol Metab (2011) 96(5):1327–35. doi: 10.1210/jc.2010-2443

PubMed Abstract | CrossRef Full Text | Google Scholar

32. Giraldi EA, Ioachimescu AG. The Role of Dopamine Agonists in Pituitary Adenomas. Endocrinol Metab Clin North Am (2020) 49(3):453–74. doi: 10.1016/j.ecl.2020.05.006

PubMed Abstract | CrossRef Full Text | Google Scholar

33. Muhammad A, van der Lely AJ, Delhanty PJD, Dallenga AHG, Haitsma IK, Janssen JAMJL, et al. Efficacy and Safety of Switching to Pasireotide in Patients With Acromegaly Controlled With Pegvisomant and First-Generation Somatostatin Analogues (PAPE Study). J Clin Endocrinol Metab (2018) 103(2):586–95. doi: 10.1210/jc.2017-02017

PubMed Abstract | CrossRef Full Text | Google Scholar

34. uhk JH, Jung S, Psychogios MN, Göricke S, Hartz S, Schulz-Heise S, et al. Tumor Volume of Growth Hormone-Secreting Pituitary Adenomas During Treatment With Pegvisomant: A Prospective Multicenter Study. J Clin Endocrinol Metab (2010) 95(2):552–8. doi: 10.1210/jc.2009-1239

PubMed Abstract | CrossRef Full Text | Google Scholar

35. Marazuela M, Paniagua AE, Gahete MD, Lucas T, Alvarez-Escolá C, Manzanares R, et al. Somatotroph Tumor Progression During Pegvisomant Therapy: A Clinical and Molecular Study. J Clin Endocrinol Metab (2011) 96(2):E251–9. doi: 10.1210/jc.2010-1742

PubMed Abstract | CrossRef Full Text | Google Scholar

36. Coopmans EC, van der Lely AJ, Schneiders JJ, Neggers SJCMM. Potential Antitumour Activity of Pasireotide on Pituitary Tumours in Acromegaly. Lancet Diabetes Endocrinol (2019) 7(6):425–6. doi: 10.1016/S2213-8587(19)30113-5

PubMed Abstract | CrossRef Full Text | Google Scholar

37. Ferriere A, Cortet C, Chanson P, Delemer B, Caron P, Chabre O, et al. Cabergoline for Cushing’s Disease: A Large Retrospective Multicenter Study. Eur J Endocrinol (2017) 176(3):305–14. doi: 10.1530/EJE-16-0662

PubMed Abstract | CrossRef Full Text | Google Scholar

38. Pivonello R, De Martino MC, Cappabianca P, De Leo M, Faggiano A, Lombardi G, et al. The Medical Treatment of Cushing’s Disease: Effectiveness of Chronic Treatment With the Dopamine Agonist Cabergoline in Patients Unsuccessfully Treated by Surgery. J Clin Endocrinol Metab (2009) 94(1):223–30. doi: 10.1210/jc.2008-1533

PubMed Abstract | CrossRef Full Text | Google Scholar

39. Fleseriu M, Auchus R, Bancos I, Ben-Shlomo A, Bertherat J, Biermasz NR, et al. Consensus on Diagnosis and Management of Cushing’s Disease: A Guideline Update. Lancet Diabetes Endocrinol (2021) 9(12):847–75. doi: 10.1016/S2213-8587(21)00235-7

PubMed Abstract | CrossRef Full Text | Google Scholar

40. Ceccato F, Lombardi G, Manara R, Emanuelli E, Denaro L, Milanese L, et al. Temozolomide and Pasireotide Treatment for Aggressive Pituitary Adenoma: Expertise at a Tertiary Care Center. J Neurooncol. (2015) 122(1):189–96. doi: 10.1007/s11060-014-1702-0

PubMed Abstract | CrossRef Full Text | Google Scholar

41. Pivonello R, Fleseriu M, Newell-Price J, Bertagna X, Findling J, Shimatsu A, et al. Efficacy and Safety of Osilodrostat in Patients With Cushing’s Disease (LINC 3): A Multicentre Phase III Study With a Double-Blind, Randomised Withdrawal Phase. Lancet Diabetes Endocrinol (2020) 8(9):748–61. doi: 10.1016/S2213-8587(20)30240-0

PubMed Abstract | CrossRef Full Text | Google Scholar

42. Varlamov EV, Han AJ, Fleseriu M. Updates in Adrenal Steroidogenesis Inhibitors for Cushing’s Syndrome – A Practical Guide. Best Pract Res Clin Endocrinol Metab (2021) 35(1):101490. doi: 10.1016/j.beem.2021.101490

PubMed Abstract | CrossRef Full Text | Google Scholar

43. Daniel E, Debono M, Caunt S, Girio-Fragkoulakis C, Walters SJ, Akker SA, et al. A Prospective Longitudinal Study of Pasireotide in Nelson’s Syndrome. Pituitary. (2018) 21(3):247–55. doi: 10.1007/s11102-017-0853-3

PubMed Abstract | CrossRef Full Text | Google Scholar

44. Katznelson L. Sustained Improvements in Plasma ACTH and Clinical Status in a Patient With Nelson’s Syndrome Treated With Pasireotide LAR, a Multireceptor Somatostatin Analog. J Clin Endocrinol Metab (2013) 98(5):1803–7. doi: 10.1210/jc.2013-1497

PubMed Abstract | CrossRef Full Text | Google Scholar

45. He X, Spencer-Segal JL. Rapid Response of Nelson’s Syndrome to Pasireotide in Radiotherapy-Naive Patient. Clin Diabetes Endocrinol (2020) 6(1):22. doi: 10.1186/s40842-020-00110-7

PubMed Abstract | CrossRef Full Text | Google Scholar

Keywords: pasireotide, cushing, acromegaly, tumor volume, tumor size

Citation: Mondin A, Manara R, Voltan G, Tizianel I, Denaro L, Ferrari M, Barbot M, Scaroni C and Ceccato F (2022) Pasireotide-Induced Shrinkage in GH and ACTH Secreting Pituitary Adenoma: A Systematic Review and Meta-Analysis. Front. Endocrinol. 13:935759. doi: 10.3389/fendo.2022.935759

Received: 04 May 2022; Accepted: 06 June 2022;
Published: 01 July 2022.

Edited by:

Mohammad E. Khamseh, Iran University of Medical Sciences, Iran

Reviewed by:

Rosa Paragliola, Catholic University of the Sacred Heart, Rome, Italy
Marek Bolanowski, Wroclaw Medical University, Poland
Adriana G Ioachimescu, Emory University, United States

Copyright © 2022 Mondin, Manara, Voltan, Tizianel, Denaro, Ferrari, Barbot, Scaroni and Ceccato. This is an open-access article distributed under the terms of the Creative Commons Attribution License (CC BY). The use, distribution or reproduction in other forums is permitted, provided the original author(s) and the copyright owner(s) are credited and that the original publication in this journal is cited, in accordance with accepted academic practice. No use, distribution or reproduction is permitted which does not comply with these terms.

*Correspondence: Filippo Ceccato, filippo.ceccato@unipd.it

ORCID: Alessandro Mondin, orcid.org/0000-0002-6046-5198
Renzo Manara, orcid.org/0000-0002-5130-3971
Giacomo Voltan, orcid.org/0000-0002-3628-0492
Irene Tizianel, orcid.org/0000-0003-4092-5107
Luca Denaro, orcid.org/0000-0002-2529-6149
Marco Ferrari, orcid.org/0000-0002-4023-0121
Mattia Barbot, orcid.org/0000-0002-1081-5727
Carla Scaroni, orcid.org/0000-0001-9396-3815
Filippo Ceccato, orcid.org/0000-0003-1456-8716

Disclaimer: All claims expressed in this article are solely those of the authors and do not necessarily represent those of their affiliated organizations, or those of the publisher, the editors and the reviewers. Any product that may be evaluated in this article or claim that may be made by its manufacturer is not guaranteed or endorsed by the publisher.

From https://www.frontiersin.org/articles/10.3389/fendo.2022.935759/full