From Knee Pain Consultation to Pituitary Surgery: The Challenge of Cushing Disease Diagnosis

Abstract

Cushing syndrome (CS) is a rare endocrinological disorder resulting from chronic exposure to excessive cortisol. The term Cushing disease is used specifically when this is caused by excessive secretion of adrenocorticotropic hormone (ACTH) by a pituitary tumor, usually an adenoma. This disease is associated with a poor prognosis, and if left untreated, it has an estimated 5-year survival rate of 50%. We present the case of a 66-year-old female patient who received a referral to endocrinology for an evaluation of obesity due to right knee arthropathy. Taking into consideration her age, she was screened for osteoporosis, with results that showed diminished bone density. Considering this, combined with other clinical features of the patient, suspicion turned toward hypercortisolism. Laboratory findings suggested that the CS was ACTH-dependent and originated in the pituitary gland. After a second look at the magnetic resonance imaging results, a 4-mm lesion was identified on the pituitary gland, prompting a transsphenoidal resection of the pituitary adenoma.

Introduction

Chronic excessive exposure to glucocorticoids leads to the diverse clinical manifestations of Cushing syndrome (CS), which has an annual incidence ranging from 1.8 to 3.2 cases per million individuals [1]. The syndrome’s signs and symptoms are not pathognomonic, and some of its primary manifestations, such as obesity, hypertension, and glucose metabolism alterations, are prevalent in the general population [2], making diagnosis challenging. Endogenous CS falls into 2 categories: adrenocorticotropic hormone (ACTH)-dependent (80%-85% of cases), mostly due to a pituitary adenoma, or ACTH-independent (15%-20% of cases), typically caused by adrenal adenomas or hyperplasia [3]. Cushing disease (CD) represents a specific form of CS, characterized by the presence of an ACTH-secreting pituitary tumor [1]. Untreated CD is associated with high morbidity and mortality compared to the general population [1], with a 50% survival rate at 5 years [2]. However, surgical removal of a pituitary adenoma can result in complete remission, with mortality rates similar to those of the general population [2]. This article aims to highlight the challenges of suspecting and diagnosing CD and to discuss the current management options for this rare condition.

Case Presentation

A 66-year-old woman received a referral to endocrinology for an evaluation of obesity due to right knee arthropathy. During physical examination, she exhibited a body mass index of 34.3 kg/m2, blood pressure of 180/100, a history of non-insulin-requiring type 2 diabetes mellitus with glycated hemoglobin (HbA1c) of 6.9% (nondiabetic: < 5.7%; prediabetic: 5.7% to 6.4%; diabetic: ≥ 6.5%) and hypertension. Additionally, the patient complained of proximal weakness in all 4 limbs.

Diagnostic Assessment

Upon admission, densitometry revealed osteoporosis with T scores of −2.7 in the lumbar spine and −2.8 in the femoral neck. Hypercortisolism was suspected due to concomitant arterial hypertension, central obesity, muscle weakness, and osteoporosis. Physical examination did not reveal characteristic signs of hypercortisolism, such as skin bruises, flushing, or reddish-purple striae. Late-night salivary cortisol (LNSC) screening yielded a value of 8.98 nmol/L (0.3255 mcg/dL) (reference value [RV] 0.8-2.7 nmol/L [0.029-0.101 mcg/dL]) and ACTH of 38.1 pg/mL (8.4 pmol/L) (RV 2-11 pmol/L [9-52 pg/mL]). A low-dose dexamethasone suppression test (LDDST) was performed (cutoff value 1.8 mcg/dL [49 nmol/L]), with cortisol levels of 7.98 mcg/dL (220 nmol/L) at 24 hours and 20.31 mcg/dL (560 nmol/L) at 48 hours. Subsequently, a high-dose dexamethasone suppression test (HDDST) was conducted using a dose of 2 mg every 6 hours for 2 days, for a total dose of 16 mg, revealing cortisol levels of 0.0220 nmol/L (0.08 ng/mL) at 24 hours and 0.0560 nmol/L (0.0203 ng/mL) at 48 hours, alongside 24-hour urine cortisol of 0.8745 nmol/L (0.317 ng/mL) (RV 30-145 nmol/24 hours [approximately 11-53 μg/24 hours]) [4].

These findings indicated the presence of endogenous ACTH-dependent hypercortisolism of pituitary origin. Consequently, magnetic resonance imaging (MRI) was requested, but the results showed no abnormalities. Considering ectopic ACTH production often occurs in the lung, a high-resolution chest computed tomography scan was performed, revealing no lesions.

Treatment

Upon reassessment, the MRI revealed a 4-mm adenoma, prompting the decision to proceed with transsphenoidal resection of the pituitary adenoma.

Outcome and Follow-Up

The histological analysis revealed positive staining for CAM5.2, chromogranin, synaptophysin, and ACTH, with Ki67 staining at 1%. At the 1-month follow-up assessment, ACTH levels were 3.8 pmol/L (17.2 pg/mL) and morning cortisol was 115.8621 nmol/L (4.2 mcg/dL) (RV 5-25 mcg/dL or 140-690 nmol/L). Somatomedin C was measured at 85 ng/mL (RV 70-267 ng/mL) and prolactin at 3.5 ng/mL (RV 4-25 ng/mL). At the 1-year follow-up, the patient exhibited a satisfactory postoperative recovery. However, she developed diabetes insipidus and secondary hypothyroidism. Arterial hypertension persisted. Recent laboratory results indicated a glycated hemoglobin (HbA1c) level of 5.4%. Medications at the time of follow-up included prednisolone 5 milligrams a day, desmopressin 60 to 120 micrograms every 12 hours, losartan potassium 50 milligrams every 12 hours, and levothyroxine 88 micrograms a day.

Discussion

CD is associated with high mortality, primarily attributable to cardiovascular outcomes and comorbidities such as metabolic and skeletal disorders, infections, and psychiatric disorders [1]. The low incidence of CD in the context of the high prevalence of chronic noncommunicable diseases makes early diagnosis a challenge [2]. This case is relevant for reviewing the diagnostic approach process and highlighting the impact of the availability bias, which tends to prioritize more common diagnoses over rare diseases. Despite the absence of typical symptoms, a timely diagnosis was achieved.

Once exogenous CS is ruled out, laboratory testing must focus on detecting endogenous hypercortisolism to prevent misdiagnosis and inappropriate treatment [5]. Screening methods include 24-hour urinary free cortisol (UFC) for total cortisol load, while circadian rhythm and hypothalamic-pituitary-adrenal (HPA) axis function may be evaluated using midnight serum cortisol and LNSC [5]. An early hallmark of endogenous CS is the disruption of physiological circadian cortisol patterns, characterized by a constant cortisol level throughout the day or no significant decrease [2]. Measuring LNSC has proven to be useful in identifying these patients. The LNSC performed on the patient yielded a high result.

To assess HPA axis suppressibility, tests such as the overnight and the standard 2-day LDDST [5] use dexamethasone, a potent synthetic corticosteroid with high glucocorticoid receptor affinity and prolonged action, with minimal interference with cortisol measurement [6]. In a normal HPA axis, cortisol exerts negative feedback, inhibiting the secretion of corticotropin-releasing-hormone (CRH) and ACTH. Exogenous corticosteroids suppress CRH and ACTH secretion, resulting in decreased synthesis and secretion of cortisol. In pathological hypercortisolism, the HPA axis becomes partially or entirely resistant to feedback inhibition by exogenous steroids [56]. The LDDST involves the administration of 0.5 mg of dexamethasone orally every 6 hours for 2 days, with a total dose of 4 mg. A blood sample is drawn 6 hours after the last administered dose [6]. Following the LDDST, the patient did not demonstrate suppression of endogenous corticosteroid production.

After diagnosing CS, the next step in the diagnostic pathway involves categorizing it as ACTH-independent vs ACTH-dependent. ACTH-independent cases exhibit low or undetectable ACTH levels, pointing to adrenal origin. The underlying principle is that excess ACTH production in CD can be partially or completely suppressed by high doses of dexamethasone, a response not observed in ectopic tumors [6]. In this case, the patient presented with an ACTH of 38.1 pg/mL (8.4 pmol/L), indicative of ACTH-dependent CD.

Traditionally, measuring cortisol levels and conducting pituitary imaging are standard practices for diagnosis. Recent advances propose alternative diagnostic methods such as positron emission tomography (PET) scans and corticotropin-releasing factor (CRF) tests [7]. PET scans, utilizing radioactive tracers, offer a view of metabolic activity in the adrenal glands and pituitary region, aiding in the identification of abnormalities associated with CD. Unfortunately, the availability of the aforementioned tests in the country is limited.

Once ACTH-dependent hypercortisolism is confirmed, identifying the source becomes crucial. A HDDST is instrumental in distinguishing between a pituitary and an ectopic source of ACTH overproduction [26]. The HDDST involves administering 8 mg of dexamethasone either overnight or as a 2-day test. In this case, the patient received 2 mg of dexamethasone orally every 6 hours for 2 days, totaling a dose of 16 mg. Simultaneously, a urine sample for UFC is collected during dexamethasone administration. The HDDST suppressed endogenous cortisol production in the patient, suggesting a pituitary origin.

In ACTH-dependent hypercortisolism, CD is the predominant cause, followed by ectopic ACTH syndrome and, less frequently, an ectopic CRH-secreting tumor [35]. With the pretest probability for pituitary origin exceeding 80%, the next diagnostic step is typically an MRI of the pituitary region. However, the visualization of microadenomas on MRI ranges from 50% to 70%, requiring further testing if results are negative or inconclusive [5]. Initial testing of our patient revealed no pituitary lesions. Following a pituitary location, ACTH-secreting tumors may be found in the lungs. Thus, a high-resolution chest computed tomography scan was performed, which yielded negative findings. Healthcare professionals must keep these detection rates in mind. In instances of high clinical suspicion, repeating or reassessing tests and imaging may be warranted [3], as in our case, ultimately leading to the discovery of a 4-mm pituitary adenoma.

It is fundamental to mention that the Endocrine Society Clinical Practice Guideline on Treatment of CS recommends that, when possible, all patients presenting with ACTH-dependent CS and lacking an evident causal neoplasm should be directed to an experienced center capable of conducting inferior petrosal sinus sampling to differentiate between pituitary and nonpituitary or ectopic cause [8]. However, in this instance, such a referral was regrettably hindered by logistical constraints.

Regarding patient outcomes and monitoring in CD, there is no consensus on defining remission criteria following tumor resection. Prolonged hypercortisolism results in suppression of corticotropes, resulting in low levels of ACTH and cortisol after surgical intervention. Typically, remission is identified by morning serum cortisol values below 5 µg/dL (138 nmol/L) or UFC levels between 28 and 56 nmol/d (10-20 µg/d) within 7 days after surgical intervention. In our case, the patient’s morning serum cortisol was 115.8621 nmol/L (4.2 µg/dL), indicating remission. Remission rates in adults are reported at 73% to 76% in selectively resected microadenomas and at 43% in macroadenomas [8], highlighting the need for regular follow-up visits to detect recurrence.

Following the surgery, the patient experienced diabetes insipidus, a relatively common postoperative occurrence, albeit usually transient [8]. It is recommended to monitor serum sodium levels during the first 5 to 14 days postsurgery for early detection and management. Additionally, pituitary deficiencies may manifest following surgery. In this patient, prolactin levels were compromised, potentially impacting sexual response. However, postoperative somatomedin levels were normal, and gonadotropins were not measured due to the patient’s age group, as no additional clinical decisions were anticipated based on those results. Secondary hypothyroidism was diagnosed postoperatively.

Moving forward, it is important to emphasize certain clinical signs and symptoms for diagnosing CD. The combination of low bone mineral density (Likelihood Ratio [LR] +21.33), central obesity (LR +3.10), and arterial hypertension (LR + 2.29) [9] has a higher positive LR than some symptoms considered “characteristic,” such as reddish-purple striae, plethora, proximal muscle weakness, and unexplained bruising [210]. It is essential to give relevance to the signs the patient may present, emphasizing signs that have been proven to have an increased odds ratio (OR) such as osteoporosis (OR 3.8), myopathies (OR 6.0), metabolic syndrome (OR 2.7) and adrenal adenoma (OR 2.4) [9‐11]. The simultaneous development and worsening of these conditions should raise suspicion for underlying issues. Understanding the evolving nature of CD signs highlights the importance of vigilance during medical examinations, prioritizing the diagnostic focus, and enabling prompt initiation of treatment.

Recognizing the overlap of certain clinical features in CS is fundamental to achieving a timely diagnosis.

Learning Points

  • CS diagnosis is challenging due to the absence of pathognomonic signs and symptoms and the overlap of features present in many pathologies, such as metabolic syndrome.
  • Early detection of CS is crucial, given its association with high morbidity and mortality resulting from chronic exposure to glucocorticoids.
  • Recognizing the combination of low bone mineral density, obesity, hypertension, and diabetes as valuable clinical indicators is key in identifying CS.
  • Interdisciplinary collaboration is essential to achieve a comprehensive diagnostic approach.

Acknowledgments

We extend our gratitude to Pontificia Universidad Javeriana in Bogotá for providing essential resources and facilities that contributed to the successful completion of this case report. Special acknowledgment is reserved for the anonymous reviewers, whose insightful feedback significantly enhanced the quality of this manuscript during the peer-review process. Their contributions are sincerely appreciated.

Contributors

All authors made individual contributions to authorship. A.B.O. was involved in the diagnosis and management of this patient. M.A.G., J.M.H., and A.B.O. were involved in manuscript drafting and editing. All authors reviewed and approved the final draft.

Funding

This research received no public or commercial funding.

Disclosures

The authors declare that they have no conflicts of interest related to the current study.

Informed Patient Consent for Publication

Signed informed consent could not be obtained from the patient or a proxy but has been approved by the treating institution.

Data Availability Statement

Restrictions apply to the availability of some or all data generated or analyzed during this study to preserve patient confidentiality or because they were used under license. The corresponding author will on request detail the restrictions and any conditions under which access to some data may be provided.

References

1

Hakami
OA

,

Ahmed
S

,

Karavitaki
N

.

Epidemiology and mortality of Cushing’s syndrome

.

Best Pract Res Clin Endocrinol Metab

.

2021

;

35

(

1

):

101521

.

2

Nieman
LK

,

Biller
BMK

,

Findling
JW

, et al.

The diagnosis of Cushing’s syndrome: an endocrine society clinical practice guideline

.

J Clin Endocrinol Metab

.

2008

;

93

(

5

):

1526

1540

.

3

Gutiérrez Restrepo
J

,

Latorre Sierra
G

,

Campuzano Maya
G

.

Síndrome de cushing

.

Med Lab

.

2009

;

15

:

411

430

.

4

Petersenn
S

,

Newell-Price
J

,

Findling
JW

, et al.

High variability in baseline urinary free cortisol values in patients with Cushing’s disease

.

Clin Endocrinol (Oxf)

.

2014

;

80

(

2

):

261

269

.

5

Lila
AR

,

Sarathi
V

,

Jagtap
VS

,

Bandgar
T

,

Menon
P

,

Shah
NS

.

Cushing’s syndrome: stepwise approach to diagnosis

.

Indian J Endocrinol Metab

.

2011

;

15

(

Suppl4

):

S317

S321

.

6

Dogra
P

,

Vijayashankar
NP

.

Dexamethasone suppression test. In: StatPearls StatPearls Publishing; 2024

. Accessed January 29, 2024. http://www.ncbi.nlm.nih.gov/books/NBK542317/

7

Müller
OA

,

Dörr
HG

,

Hagen
B

,

Stalla
GK

,

von Werder
K

.

Corticotropin releasing factor (CRF)-stimulation test in normal controls and patients with disturbances of the hypothalamo-pituitary-adrenal axis

.

Klin Wochenschr

.

1982

;

60

(

24

):

1485

1491

.

8

Nieman
LK

,

Biller
BMK

,

Findling
JW

, et al.

Treatment of Cushing’s syndrome: an endocrine society clinical practice guideline

.

J Clin Endocrinol Metab

.

2015

;

100

(

8

):

2807

2831

.

9

Aron
DC

.

Cushing’s syndrome: why is diagnosis so difficult?
Rev Endocr Metab Disord

.

2010

;

11

(

2

):

105

116

.

10

Braun
LT

,

Vogel
F

,

Zopp
S

, et al.

Whom should we screen for cushing syndrome? the Endocrine Society practice guideline recommendations 2008 revisited

.

J Clin Endocrinol Metab

.

2022

;

107

(

9

):

e3723

e3730

.

11

Schneider
HJ

,

Dimopoulou
C

,

Stalla
GK

,

Reincke
M

,

Schopohl
J

.

Discriminatory value of signs and symptoms in Cushing’s syndrome revisited: what has changed in 30 years?
Clin Endocrinol (Oxf)

.

2013

;

78

(

1

):

153

154

.

Abbreviations


  • ACTH

    adrenocorticotropic hormone

  • CD

    Cushing disease

  • CRH

    corticotropin-releasing hormone

  • CS

    Cushing syndrome

  • HDDST

    high-dose dexamethasone suppression test

  • HPA

    hypothalamic-pituitary-adrenal

  • LDDST

    low-dose dexamethasone suppression test

  • LNSC

    late-night salivary cortisol

  • MRI

    magnetic resonance imaging

  • OR

    odds ratio

  • RV

    reference value

  • UFC

    urinary free cortisol

© The Author(s) 2024. Published by Oxford University Press on behalf of the Endocrine Society.
This is an Open Access article distributed under the terms of the Creative Commons Attribution License (https://creativecommons.org/licenses/by/4.0/), which permits unrestricted reuse, distribution, and reproduction in any medium, provided the original work is properly cited.

Epigenetic Mechanisms Modulated by Glucocorticoids With a Focus on Cushing Syndrome

Abstract

In Cushing syndrome (CS), prolonged exposure to high cortisol levels results in a wide range of devastating effects causing multisystem morbidity. Despite the efficacy of treatment leading to disease remission and clinical improvement, hypercortisolism-induced complications may persist. Since glucocorticoids use the epigenetic machinery as a mechanism of action to modulate gene expression, the persistence of some comorbidities may be mediated by hypercortisolism-induced long-lasting epigenetic changes. Additionally, glucocorticoids influence microRNA expression, which is an important epigenetic regulator as it modulates gene expression without changing the DNA sequence. Evidence suggests that chronically elevated glucocorticoid levels may induce aberrant microRNA expression which may impact several cellular processes resulting in cardiometabolic disorders.

The present article reviews the evidence on epigenetic changes induced by (long-term) glucocorticoid exposure. Key aspects of some glucocorticoid-target genes and their implications in the context of CS are described. Lastly, the effects of epigenetic drugs influencing glucocorticoid effects are discussed for their ability to be potentially used as adjunctive therapy in CS.

In Cushing syndrome (CS), adrenocorticotropic hormone (ACTH) hypersecretion by a pituitary adenoma or an ectopic source, or autonomous cortisol hypersecretion by an adrenal tumor, induces chronic endogenous hypercortisolism with loss of the cortisol circadian rhythm (1). CS is more prevalent in women than men and frequently occurs in the fourth to sixth decades of life (2).

Glucocorticoids (GC) have extensive physiological actions and regulate up to 20% of the expressed genome, mainly related to the immune system, metabolic homeostasis, and cognition. Therefore, the prolonged exposure to high cortisol levels results in a wide range of devastating effects, including major changes in body composition (obesity, muscle atrophy, osteoporosis), neuropsychiatric disturbances (impaired cognition, depression, sleep disturbances), the metabolic syndrome (obesity, hypertension, insulin resistance, and dyslipidemia), hypercoagulability, and immune suppression (34). The consequences of hypercortisolism lead to compromised quality of life and increased mortality rate (5). The mortality rate in patients with CS is 4 times higher than the healthy control population (6). Risk factors such as obesity, diabetes, and hypertension contribute to the increased risk of myocardial infarction, stroke, and cardiac insufficiency. As a result, cardiovascular disease is the leading cause of the premature death in CS (5). Infectious disease is also an important cause of death in CS (5). Therefore, prompt treatment to control hypercortisolism is imperative to prevent complications and an increased mortality rate.

Despite the efficacy of treatment leading to disease remission, the clinical burden of CS improves, but does not completely revert, in every patient (7). Indeed, obesity, neuropsychiatric disturbances, hypertension, diabetes, and osteoporosis persist in a substantial number of biochemically cured patients. For instance, in a study involving 118 CS patients in remission for about 7.8 years (median), resolution of comorbidities such as diabetes occurred in only 36% of cases, hypertension in 23% of cases, and depression in 52% of the cases (8). It has been proposed that epigenetic changes as a consequence of hypercortisolism is a mechanism of the persistence of some comorbidities (9-12).

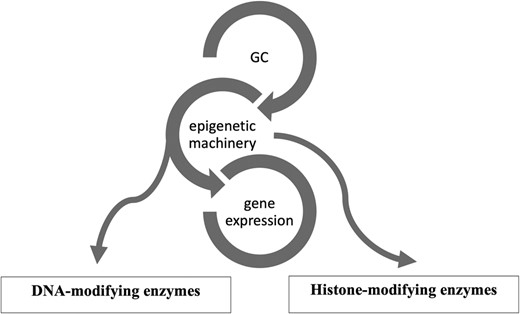
Epigenetics is a reversible process that modifies gene expression without any alterations in DNA sequence; frequently it is mediated by histone modification and DNA methylation together with microRNAs (13-15). GCs use the epigenetic machinery as a mechanism of action to regulate gene expression in physiological circumstances, such as metabolic actions and stress response. Its networks involve DNA and histone modifying enzymes, such as DNA methyltransferases (DNMTs), histone acetyltransferases (HATs), and histone deacetylases (HDACs) (16). (Fig. 1) The DNA methylation process catalyzed by DNMTs is usually associated with downregulation of gene expression (17). Histone modifications catalyzed by HAT enzymes induce gene transcription, while those by HDAC enzymes induce transcriptional repression (17). Drugs interfering with these enzymes (so-called epigenetic drugs) may affect the GC genomic actions confirming the interaction between GC and the epigenetic system (1819). Furthermore, GC can modulate HDAC and DNMT expression and activity (161920). Based on these data it might be speculated that in CS, epigenetic modifications induced by long-term GC exposure plays a role in the development of the disease-specific morbidity (910).

Figure 1.

Glucocorticoid (GC) and its epigenetic machinery. GC through its receptor interacts with DNA and histone modifying enzymes, such as DNA methyltransferases (DNMTs), histone acetyl transferases (HATs), and histone deacetylases (HDAC) to modulate gene expression.

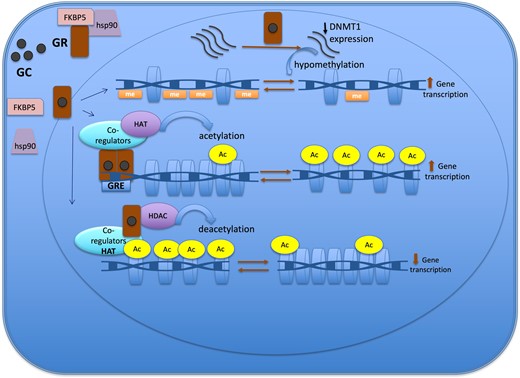
In this review we provide an overview of epigenetic aspects of GC action in physiological conditions and in the context of CS. We start with a detailed characterization of how GC, using the epigenetic system, can change chromatin structure in order to activate or silence gene expression. (Fig. 2) Subsequently, we describe the role of epigenetic mechanisms in the regulation of expression of several GC-target genes related to CS. Finally, we present the current evidence of epigenetic changes caused by the long-term of GC exposure and the potential use of epidrugs influencing GC actions.

Figure 2.

Epigenetic mechanisms of the glucocorticoid action to regulate gene expression. The GR is located in cytoplasm in a multi-protein complex; after GC binding, GR dissociates from the multi-protein complex, crosses the nuclear membrane, dimerizes, and binds to the GRE of the target gene. One of the mechanisms of action of GC is through the recruitment of co-regulators together with epigenetic enzymes, such as HAT, to change the chromatin structure, resulting in activation of gene transcription. Also, GR decreases gene expression by tethering other transcriptional factors and recruiting HDAC2, causing histone deacetylation, which leads to a repressed chromatin. GC can cause hypomethylation through downregulation in the expression of DNMT1. Abbreviations: Ac, acetylation; DNMT1, DNA methyltransferase 1; GC, glucocorticoid; GR, glucocorticoid receptor; GRE, glucocorticoid responsive elements; HAT, histone acetyltransferase; HDAC, histone deacetylases; Me: methylation.

Search Strategy

A search of the PubMed database was conducted using the advanced search builder tool for articles in the English language on the following terms “glucocorticoids,” “glucocorticoid receptor,” “Cushing,” “hypercortisolism,” “epigenetic,” “DNA methylation,” “histone deacetylase,” “histone acetyltransferase,” “microRNA” “fkbp5,” “clock genes,” and “POMC.” Moreover, references were identified directly from the articles included in this manuscript. The articles were selected by the authors after being carefully analyzed regarding their importance and impact.

Epigenetic Aspects of Genomic Action of Glucocorticoids

GCs regulate gene expression positively or negatively. GC-responsive genes include genes encoding for proteins associated with inflammation, metabolic processes, blood pressure and fluid homeostasis, apoptosis, cell cycle progression, circadian rhythm, and intracellular signaling (21).

The GC actions are cell type–specific (22). For instance, in an in vitro study, the comparison of GC-expressed genes between 2 cell lines, corticotroph (AtT20) and mammary (3134) cell lines, showed a different set of GC-regulated genes, revealing the cell type–specific nature of GC effects (23). GC function depends on the accessibility of glucocorticoid receptor (GR)-binding sites in the DNA of the target tissue, which in turn is mostly established during cell differentiation. Therefore, different chromatin organization explains the distinct GR-binding sites among different tissues (222425). The chromatin accessibility is determined by histone modifications such as acetylation, methylation, phosphorylation, and/or DNA methylation, processes that are both dynamic and reversible (26).

Furthermore, gene expression is regulated in a GC-concentration-dependent manner which is tissue-specific. Only a few genes can be upregulated or downregulated at low concentrations of GC. For example, a dose of dexamethasone (Dex) as low as 0.5 nM selectively activated PER1 (period 1, transcription factor related to circadian rhythm) expression in lung cancer (A549) cells (2127). Additionally, continuous GC exposure or pulsed GC (cortisol fluctuation during circadian rhythm) may cause different responses with respect to gene expression (2628). For example, constant treatment with corticosterone induced higher levels of PER1 clock gene mRNA expression compared with pulsatile treatment, as demonstrated in an in vitro study using 3134 cell line (28).

The time course for gene expression in response to Dex is fast, with repression occurring slightly slower compared to activation. Half of activated and repressed genes are detected within, respectively, about 40 minutes and 53 minutes following Dex exposure (21).

In short, the transcriptional output in response to GC depends on cell type, as well as on the duration and intensity of GC exposure (21242627). GCs act as a transcriptional regulatory factor resulting in activating or repressing the expression of genes. The GC exerts its function through binding to corticosteroid receptors, specifically, the mineralocorticoid receptor and the GR, members of the nuclear receptor superfamily (2930).

Glucocorticoid Receptor

The GR is located in the cytoplasm in a chaperone complex which includes heat-shock proteins (70 and 90) and immunophilins (such as FK506 binding protein [FKBP5]). Cortisol diffuses across the cell membrane and binds with high affinity to the GR. The activated GR bound to GC dissociates of the multi-protein complex and is transferred to the nucleus, where it ultimately regulates gene expression (2631).

GR is a transcription factor encoded by nuclear receptor subfamily 3, group C member 1 (NR3C1) gene, located in chromosome 5, and consisting of 9 exons. It is composed of 3 major functional domains, namely a DNA binding domain (DBD), the C-terminal ligand-binding domain (LBD) and the N-terminal domain (NTB). The LBD recognizes and joins the GC. NTB contains an activation function-1 (AF1) which connects with co-regulators and the members of the general transcription machinery to activate target genes. The DBD comprises 2 zinc fingers motifs that are able to identify and bind to glucocorticoid responsive elements (GREs) (3233).

GRα is the most expressed and functionally active GR. GRβ is another isoform which is the result of an alternative splicing in exon 9 of the GR transcript. The difference between the 2 isoforms is the distinct ligand-binding domain in GRβ. This variance prevents the GRβ from binding to GC. In fact, the GRβ counteracts GRα function by interfering with its binding to a GRE in the target gene, and GRβ expression is associated with GC resistance (32). In addition, GRβ has its own transcriptional activity which is independent and distinct from GRα (34).

Another splice variant of human GR, GRγ, is associated with GC resistance in lung cell carcinoma and childhood acute lymphoblastic leukemia (3335). There is an additional amino acid (arginine) in the DBD of the GRγ that reduces, by about half, the capacity to activate or suppress the transcription of the target gene, as compared with GRα (32). One study identified GRγ in a small series of corticotroph adenomas (36).

Glucocorticoid Mechanism of Action

The GR-GC complex induces or represses gene expression directly by binding to DNA, indirectly by tethering other transcription factors or yet in a composite manner that consists in binding DNA in association with binding to other co-regulators (3537).

The GR has the ability to reorganize the chromatin structure to become more or less accessible to the transcriptional machinery. In the classical mechanism of direct induction of gene expression, the GR dimerizes and binds to a GRE in DNA. The receptor recruits co-regulators, such as CREB binding protein, which has intrinsic histone acetyltransferase (HAT) activity that modifies the chromatin structure from an inactive to an active state. This model, called transactivation, upregulates the expression of some genes related to glucose, protein, and fat metabolism. Gene repression, on the other hand, is accomplished by GR binding to a negative GRE (nGRE) leading to the formation of a chromatin remodeling complex composed by co-repressor factors, such as NCOR1 and SMRT, and histone deacetylases (HDACs), that ultimately turn chromatin less accessible and suppress gene transcription. The gene repression through direct binding events occurs less frequently when compared to gene induction (253538).

Another mechanism of GC action is through binding to other transcription factors (tethering). In case of switching off inflammatory genes, GR binds to transcriptional co-activator molecules, such as CREB binding protein with intrinsic HAT activity, and subsequently recruits HDAC2 to reverse histone acetylation, thus resulting in a suppression of the activated inflammatory gene (39). In the same model, GC interacts with other cofactors, such as the STAT family, to induce chromatin modifications resulting in increased gene expression (26).

Furthermore, the transcriptional dynamics of some genes follow a composite manner. In this model, GR, in conjunction with binding to GRE, also interacts with cofactors in order to enhance or reduce gene expression (35).

GCs can also modulate gene expression by influencing the transcription of epigenetic modifiers. An experimental study demonstrated that GC mediated the upregulation of HDAC2 in rats exposed to chronic stress, which in turn decreased the transcription of histone methyltransferase (Ehmt2) that ultimately upregulated the expression of Nedd4. Nedd4 is a ubiquitin ligase, expression of which has been related to cognitive impairment (40). Additionally, GC was found to interact with another epigenetic eraser, namely JMJD3, a histone demethylase, suppressing its transcription in endothelial cells treated with TNFα that led to decreased expression of other genes related to the blood-brain barrier (41).

GCs have the ability to induce (de)methylation changes in DNA, ultimately affecting gene expression. The DNA methylation process triggered by GC involves the family of DNA methyltransferases (DNMT) and ten-eleven translocation (TET) protein (2042-44). The DNMT, DNMT1, DNMT3A, and DNMT3B are able to transfer a methyl group to a cytosine residue in DNA, forming 5-methylcytosine (5mC), which negatively impacts gene expression. In contrast, TET protein chemically modifies the 5mC to form 5-hydroxymethylcytosine (5hmC), which ultimately leads to unmethylated cytosine, positively influencing gene expression (45).

Glucocorticoids mainly induce loss of methylation events rather than gain of methylation across the genome (1146). The DNA demethylation process can be either active or passive. The active mechanism is linked to the upregulation of TET enzyme expression that follows GC treatment, which was described in retinal and osteocyte cell line model studies (4243). The passive demethylation event involves the downregulation (Fig. 2) or dysfunction of DNMT1. DNMT1 is responsible for maintaining the methylation process in dividing cells (45). In case of GC exposure, GC can cause hypomethylation through downregulation in the expression of DNMT1, a process described in the AtT20 corticotroph tumor cell model, or through GC hindering DNMT activity, particularly DNMT1, as demonstrated in the retinal cell (RPE) line (204244).

Glucocorticoid-Induced Epigenetic Changes

There are several molecular mechanisms connecting GR activation and epigenetic modifications ultimately affecting gene expression (Fig. 2). As described above, GC uses epigenetic machinery, such as DNA and histone modifying enzymes, to restructure the chromatin in order to induce or silence gene transcription (1647).

In an in vitro study using murine AtT20 corticotroph tumor and neuronal cell lines, after chronic GC exposure followed by a recovery period in the absence of GC, the cells retained an “epigenetic memory” with persistence of loss of methylation content in FKBP5 gene but with no increased gene expression at baseline. The functionality of this “epigenetic memory” only became evident in a second exposure to GC, when the cells responded sharply with a more robust expression of FKBP5 gene compared to the cells without previous exposure to GC (44). Another in vitro study, using a human fetal hippocampal cell line, confirmed long-lasting DNA methylation changes induced by GC. The cells were treated for 10 days with dexamethasone, during the proliferative and cell differentiation phases of the cell line, followed by 20 days without any treatment. The second exposure to GC resulted in an enhanced gene expression of a subset of GC-target genes (48). Additionally, using an animal model subjected to chronic stress, a distinct gene expression profile was demonstrated in response to acute GC challenge compared to those without chronic stress history. The proposed mechanism was that chronic stress resulted in GC-induced enduring epigenetic changes in target genes, altering the responsiveness to a subsequent GC exposure (49).

In general, it seems that the majority of differential methylation regions (DMRs) induced by GC are loss of methylation rather than gain of methylation. In an experimental study, an association between hypomethylation and GC exposure was demonstrated in mice previously exposed to high levels of GC. Further analysis demonstrated that the genes linked with DMR were mostly related to metabolism, the immune system, and neurodevelopment (11).

Human studies have also shown that excess of cortisol can induce modifications in DNA methylation. DNA methylation data obtained from whole blood samples from patients with chronic obstructive pulmonary disease (COPD) treated with GC revealed DMR at specific CpG dinucleotides across the genome. These DMR were confirmed by pyrosequencing and annotated to genes, such as SCNN1A, encoding the α subunit of the epithelial sodium channel, GPR97, encoding G protein coupled receptor 97, and LRP3, encoding low-density lipoprotein receptor-related protein 3 (50). Furthermore, it has been proposed that the negative impact of chronic GC exposure on the immune system, which increases the risk of opportunistically infections, may be epigenetically mediated (51). In a clinical study, using whole blood samples, an analysis of genome-wide DNA methylation was performed on patients before and after exposure to GC (51). Long-term GC exposure disrupts, through a persistent modification of the cytosine methylation pattern, the mTORC1 pathway which affects CD4+ T cell biology (51).

Taken together, these data clearly show the interplay between GC signaling and methylation and histone modifications processes suggesting that GC interferes in the epigenetic landscape modulating gene expression. It is possible that most of these GC-induced epigenetic events are dynamic and temporary, while others may persist leading to long-lasting disorders. Further research to provide insight into what makes some events reversible is warranted.

Epigenetic Changes as a Consequence of Long-Term Glucocorticoid Exposure in Cushing Syndrome

The comorbidities associated with CS are associated with increased mortality mainly due to cardiovascular events (52). GC-induced comorbidities in CS may be at least in part epigenetically mediated. Previous study using whole blood methylation profile demonstrated that specific hypomethylated CpG sites induced by GC were associated with Cushing comorbidities, such as hypertension and osteoporosis (46). The study identified a methylator predictor of GC excess which could be used as a biomarker to monitor GC status (46).

The long-term exposure to high cortisol levels may be crucial for the persistence of some morbidities in CS through epigenetic changes. Hypercortisolism-induced persistent changes in visceral adipose tissue gene expression through epigenetic modifications was investigated in a translational study (12). This study combined data from patients with active CS and data from an animal model of CS in active and remitted phase. Interestingly, the study demonstrated long-lasting changes in the transcriptome of adipose tissue that were associated with histone modifications induced by GC. Therefore, these epigenetic fingerprints observed even after the resolution of hypercortisolism may elucidate the mechanism of persistent modifications in gene expression in the visceral adipose tissue (12).

With regard to the persistence of GC-induced DMR, a genome-wide DNA methylation analysis showed a lower average of DNA methylation in patients in remission of CS compared to controls. Interestingly, the most common biologically relevant affected genes were retinoic acid receptors, thyroid hormone receptors, or hormone/nuclear receptors, important genes related to intracellular pathways and regulators of gene expression (9).

In summary, this large body of evidence supports the concept that prolonged GC exposure modulates the epigenetic landscape across the genome by inducing DMR and histone modifications. Some epigenetic modifications are persistent, and this may partially explain the incomplete reversibility of some of CS features following clinical remission.

Glucocorticoid-Target Genes in Cushing Syndrome

A detailed identification and characterization of GC-target genes may shed light in the understanding of the pathophysiology and treatment response in patients with CS. For instance, the GC regulation of pro-opiomelanocortin (POMC) expression as part of the physiologic GC negative feedback may be impaired in Cushing disease (CD), which is an important mechanism for the maintenance of high GC levels (53). Another example is the interaction between GC and clock genes, which may interfere in the loss of the GC circadian rhythm and may contribute to metabolic disorders in CS (54). Furthermore, the suppressive action of GC on drug targets, such as the somatostatin receptor (subtype 2), may influence the efficacy of first-generation somatostatin receptor ligands in normalizing cortisol levels in CD (55). Here we describe how GCs using epigenetic machinery influence the expression of important target genes and their implications in CS.

FKBP5

FK506 binding protein (FKBP5) plays an important role in the regulation of hypothalamic-pituitary-adrenal (HPA) system (56). As part of the GC negative feedback loop, GC binds to hypothalamic and pituitary GR. In the cytoplasm, GR is bound to a multi-protein complex including FKBP5. FKBP5 modulates GR action by decreasing GR binding affinity to GC and by preventing GR translocation from cytoplasm to nucleus (5758). In other words, an increase of FKBP5 expression is inversely correlated with GR activity and results in GC resistance leading to an impaired negative feedback regulation in the HPA axis (59).

FKBP5 is a GC-responsive gene; its upregulation by GC is part of an intracellular negative short-feedback loop (60). The mechanism by which GC regulates FKBP5 expression was shown to include inhibition of DNA methylation (44). In a model for CS, mice treated with corticosterone for 4 weeks had a reduced level of DNA methylation of FKBP5 in DNA extracted from whole blood, which was strongly correlated in a negative manner with GC concentration. Interestingly, a negative correlation was also observed between the degree of FKBP5 gene methylation measured at 4 weeks of GC exposure and the percentage of mice visceral fat (61). Accordingly, previous studies have provided compelling evidence of decreased methylation in the FKBP5 gene in patients with active CS compared to healthy control (1046). Even in patients with CS in remission, previous data have suggested a small decrease in FKBP5 methylation levels compared to healthy controls (910). In an in vitro study, it was demonstrated that, by decreasing DNMT1 expression, GC is able to reduce FKBP5 methylation levels and, therefore, increase its expression (44).

Likewise, FKBP5 mRNA is also sensitive to GC exposure. A time-dependent increase in blood FKBP5 mRNA after single-dose prednisone administration has been demonstrated in healthy humans (62). Accordingly, patients with ACTH-dependent CS had higher blood FKBP5 mRNA levels compared with healthy controls, and after a successful surgery, FKBP5 mRNA returned to baseline levels (63). Furthermore, in another study, blood FKBP5 mRNA was inversely correlated with FKBP5 promoter methylation and positively correlated with 24-hour urine free cortisol (UFC) levels in patients with CS (46). Taken together, this fine-tuning of FKBP5 DNA methylation and mRNA according to the level of GC suggests that FKBP5 can be used as a biomarker to infer the magnitude of GC exposure.

POMC and Corticotropin-Releasing Hormone

The partial resistance of the corticotroph adenoma to GC negative feedback is a hallmark of CD. Indeed, the lack of this inhibitory effect constitutes a method to diagnose CD, that is, with the dexamethasone suppression test. One of the mechanisms related to the insensitivity to GC can be attributed to GR mutations which are, however, rarely found in corticotrophinomas (64). Another mechanism that was uncovered in corticotroph adenomas is an overexpression of the HSP90 chaperone resulting in reduced affinity of GR to its ligand and consequently GR resistance (5365).

In addition, the loss of protein expression of either Brg1, ATPase component of the SWI/SNF chromatin remodeling complex, or HDAC2 has been linked to GC resistance in about 50% of some adenomas (66). The trans-repression process on POMC transcription achieved by GC involves both the histone deacetylation enzyme and Brg1. One mechanism of corticotropin-releasing hormone (CRH)-induced POMC expression is through an orphan nuclear receptor (NR) related to NGFI-B (Nur77). NGFI-B binds to the NurRE sequence in the promoter region of POMC gene and recruits a co-activator to mediate its transcription. In a tethering mechanism, the GR directly interacts with NGFI-B to form a trans-repression complex, which contains the GR itself, Brg1, the nuclear receptor, and HDAC2; the latter being essential to block the gene expression through chromatin remodeling process (5366).

In CD, hypercortisolism exerts a negative feedback at CRH secretion from the hypothalamus (67). The mechanism involved in GR-induced suppression of CRH expression is through direct binding to a nGRE in the promoter region of CRH gene and subsequent recruitment of repressor complexes. In a rat hypothalamic cell line, it was demonstrated that Dex-induced CRH repression occurs through coordinated actions of corepressors involving Methyl-CpG-binding protein 2 (MeCP2), HDAC1, and DNA methyltransferase 3B (DNMT3B). Possibly, GR bound to nGRE recruits DNMT3B to the promoter in order to methylate a specific region, subsequently binding MeCP2 on these methylated sites followed by the recruitment of chromatin modify corepressor HDAC1, ultimately resulting in CRH suppression. Another possibility is that 2 independent complexes, one consisting of GR with DNMT3 for the methylation and the other the MeCP2, bound to methylated region, interact with HDAC1 to induce repression (68).

Clock Genes

The clock system and the HPA axis are interconnected regulatory systems. Cortisol circadian rhythm is modulated by the interaction between a central pacemaker, located in the hypothalamic suprachiasmatic nuclei, and the HPA axis (69). At the molecular level, mediators of the clock system and cortisol also communicate with each other, both acting as transcription factors of many genes to influence cellular functions.

In CS, the impact of chronic GC exposure on clock genes expression was recently evaluated using peripheral blood samples from patients with active disease compared with healthy subjects. The circadian rhythm of peripheral clock gene expression (CLOCK, BMAL, PER1-3, and CRY1) was abolished as a result of hypercortisolism, and that may contribute to metabolic disorders observed in Cushing patients (70). Another study, which investigated persistent changes induced by hypercortisolism in visceral adipose tissue, found that the expression of clock genes, such as PER1, remained altered in association with persistent epigenetic changes in both H3K4me3 and H3K27ac induced by hypercortisolism even after the resolution of hypercortisolism (12). This suggests that chronic exposure to GC may induce sustained epigenetic changes that can influence clock genes expression. Nevertheless, further studies are warranted to better elucidate how long-term exposure to GC impacts clock genes expression using the epigenetic machinery.

Glucocorticoid Effects on MicroRNAs

Along with histone modification and DNA methylation, microRNAs (miRNAs) have emerged as an epigenetic mechanism capable of impacting gene expression without changing DNA sequence (15). Interestingly, miRNA expression itself is also under the influence of epigenetic modifications through promoter methylation like any other protein-encoding genes (71).

MicroRNAs are small (about 20-25 nucleotides in length) non-coding RNAs that are important in transcriptional silencing of messenger RNA (mRNA). By partially pairing with mRNA, miRNAs can either induce mRNA degradation or inhibit mRNA translation to protein. MiRNAs regulate the translation of about 50% of the transcriptome, allowing them to play an important role in a wide range of biological functions, such as cell differentiation, proliferation, metabolism, and apoptosis under normal physiological and pathological situations. Some miRNAs can be classified as oncogenes or tumor suppressing genes, and aberrant expression of miRNAs may be implicated in tumor pathogenesis (71-73).

Insight into the regulation of miRNA expression is, therefore, crucial for a better understanding of tumor development and other human diseases, including cardiac, metabolic, and neurological disorders (7374). There are different regulatory mechanisms involved in miRNA expression, including transcriptional factors such as GR-GC. GC may modulate miRNA expression through direct binding to GRE in the promoter region of the host gene, as observed in hemopoietic tumor cells (75). In addition to transcriptional activation, in vascular smooth muscle cells, Dex treatment induces downregulation of DNMT1 and DNMT3a protein levels and reduces the methylation of miRNA-29c promoter, resulting in an increased expression of miRNA-29c (76). Interestingly, it was demonstrated that the increased expression of miRNA-29 family (miRNA-29a, -29b, and -29c) associates with metabolic dysfunction, such as obesity and insulin resistance, which pertains to CS (7778). With regard to metabolic dysfunction, miRNA-379 expression was shown to be upregulated by GC and its overexpression in the liver resulted in elevated levels of serum triglycerides associated with very low-density lipoprotein (VLDL) fraction in mice (79). In obese patients, the level of hepatic miRNA-379 expression was higher compared to nonobese patients and positively correlated with serum cortisol and triglycerides (79). Hence, GC-responsive miRNA may be, at least in part, a mediator to GC-driven metabolic conditions in CS.

In pathological conditions, such as seen in CS, prolonged exposure to an elevated cortisol level results in a wide range of comorbidities. It can be hypothesized that the chronic and excessive glucocorticoid levels may induce an aberrant miRNA expression that might impact several cellular processes related to bone and cardiometabolic disorders. A recent study addressed the impact of hypercortisolism on bone miRNA of patients with active CD compared to patients with nonfunctional pituitary adenomas. Significant changes in bone miRNA expression levels were observed, suggesting that the disruption of miRNA may be partially responsible for reduced bone formation and osteoblastogenesis (80). Similarly, altered expression levels of selected miRNAs related to endothelial biology in patients with CS may point to a contribution to a high incidence of cardiovascular disorders in Cushing patients (81). Therefore, dysregulated miRNAs as a consequence of high cortisol levels may underpin the development and progression of comorbidities related to CS. To the best of our knowledge, it is currently not clear whether miRNA dysregulation persists after resolution of hypercortisolism, thus contributing to the persistence of some comorbidities. This hypothesis needs to be further investigated.

MicroRNA can also be used as a diagnostic tool in CS. A study was performed to identify circulating miRNA as a biomarker to differentiate patients with CS from patients with suspected CS who had failed diagnostic tests (the control group) (82). It was observed that miRNA182-5p was differentially expressed in the CS cohort compared to the control group; therefore, it may be used as a biomarker (82). However, a large cohort is necessary to validate this finding (82). In corticotroph tumors, downregulation of miRNA 16-1 expression was observed relative to normal pituitary tissue (83). In contrast, the plasma level of miRNA16-5p was found to be significantly higher in CD compared to ectopic Cushing (EAS) and healthy controls (84). This finding suggests that miRNA16-5p may be a biomarker capable to differentiate the 2 forms of ACTH-dependent Cushing (84).

Epidrugs and Glucocorticoid Action in Cushing’s Syndrome

The interest in understanding the epigenetic mechanism of GC action in the context of CS is based on reversibility of epi-marks, such as DNA methylation and histone modifications, using epidrugs (8586). The biological characteristics of epigenetic drugs and their target have been extensively explored. Their effectiveness as antitumor drugs have been tested on corticotroph tumors using in vitro studies (87-89). However, a limited number of studies have explored the role of epidrugs as a therapeutic tool in reversing the genomic action of GC in CS, particularly in comorbidities induced by hypercortisolism (9091).

The use of histone deacetylase inhibitors (HDACi) may reduce the genomic action of GC (90-92). It has been demonstrated that the use of the HDAC inhibitor valproic acid increases the acetylation level of GR, consequently attenuating the genomic action of GC. In an experimental Cushing model in rats, the use of valproic acid decreased expression of genes related to lipogenesis, gluconeogenesis, and ion regulators in the kidney that ultimately reduces hepatic steatosis, hyperglycemia, and hypertension in ACTH-infused rats (9091).

More studies evaluating the effects of epidrugs influencing the GC actions are warranted to further elucidate the underlying mechanisms and to explore potential treatment modalities to reverse long-lasting consequences of chronic corticoid exposure.

Conclusions

In physiologic conditions, GC are secreted in pulses following a circadian rhythm pattern, as opposed to a constant, chronic, and high GC exposure in CS. This pathological pattern may account for numerous devastating effects observed in CS (7). Yet, the expressed genome in response to chronic GC exposure may potentially be abnormal, leading to dysregulation in clock genes, among other effects.

GC levels may return to a normal circadian pattern in response to a successful treatment, but with incomplete reversibility of some CS features, which may in part be explained by epigenetic changes. The epigenetic machinery is used by GC to induce dynamic changes in chromatin to modulate gene expression. (Fig. 2) It seems that most of chromatin modifications are reversible, but some may persist resulting in long-term epigenetic changes. (Table 1)

Table 1.

Evidence of interaction between glucocorticoid and epigenetic machinery

Epigenetic changes/epigenetic enzymes Action
Histone acetylation (HAT)
  • Glucocorticoid receptors (GR) recruit co-regulators, such as CREB binding protein (CBP), which has intrinsic histone acetyltransferase (HAT) activity that modifies the chromatin structure from an inactive to an active state (253335).

Histone deacetylation (HDAC)
  • GR recruit histone deacetylases (HDACs) to turn chromatin less accessible and suppress gene transcription (2535).

  • The trans-repression process on POMC transcription achieved by glucocorticoids (GC) involves the histone deacetylation enzyme (HDAC2).

  • GC mediates the upregulation of HDAC2 in rats exposed to chronic stress (40).

Histone demethylase (JMJD3)
  • GC suppress transcription of JMJD3 in endothelial cells treated with TNFα (41).

Histone modifications
  • Using ChIP-seq, a study in mice treated for 5 weeks with corticosterone showed higher levels of histone modifications (H3K4me3, H3K27ac) compared to control mice. In mice after a 10-week washout period, persistence of this epigenetic fingerprint was observed, which was associated with long-lasting changes in gene expression (12).

DNA methylation (DNMT3B) and histone deacetylation (HDAC1)
  • GC mediates CRH downregulation through DNMT3B to the promoter in order to methylate a specific region and recruitment of chromatin modify corepressor HDAC (68).

DNA hypomethylation
  • GC induces downregulation of DNMT1 in AtT20 (mouse corticotroph adenoma cell line) (20).

  • GC induces upregulation of TET enzyme expression which was described in retinal and osteocyte cell line model (4243).

  • An experimental study in mice previously exposed to high levels of GC showed differentially methylated regions (DMR) induced by GC treatment, of which the majority was loss of the methylation (11).

  • Reduced DNA methylation in FKBP5 gene was found in patients in active disease and also in remission state of Cushing syndrome (CS) as compared to a healthy control group (10).

  • A genome-wide DNA methylation analysis showed a lower average of DNA methylation in patients in remission of CS compared to controls (9).

  • A study using whole blood methylation profile demonstrated an association between cortisol excess and DNA hypomethylation in patients with CS (46).

Further studies are needed to elucidate how chronic exposure to GC leads to incomplete reversibility of CS morbidities via sustained modulation of the epigenetic machinery and possibly other mechanisms. Subsequent identification of therapeutic targets may offer new perspective for treatments, for example, with epidrugs, aiming to reverse hypercortisolism-related comorbidities.

Funding

The authors received no financial support for this manuscript.

Disclosures

T.P., R.A.F., and L.J.H. have nothing to declare.

Data Availability

Data sharing is not applicable to this article, as no datasets were generated or analyzed during the current study.

Day 13, Cushing’s Awareness Challenge

UVA 2004
Cushing’s Conventions have always been special times for me – we learn a lot, get to meet other Cushies, even get referrals to endos!

As early as 2001 (or before) my pituitary function was dropping.  My former endo tested annually but did nothing to help me with the symptoms.

In the fall of 2002 my endo refused to discuss my fatigue or anything at all with me until I lost 10 pounds. He said I wasn’t worth treating in my overweight condition and that I was setting myself up for a heart attack. He gave me 3 months to lose this weight. Those 3 months included Thanksgiving, Christmas and New Years.  Needless to say, I left his office in tears, again.

Fast forward 2 years to 2004.  I had tried for a while to get my records from this endo. He wouldn’t send them, even at doctors’ or my requests.

I wanted to go see Dr. Vance at UVa but I had no records so she wouldn’t see me until I could get them.

Finally, my husband went to the former endo’s office and threatened him with a court order. The office manager managed to come up with about 13 pages of records. For going to him from 1986 to 2001 including weeks and weeks at NIH and pituitary surgery, that didn’t seem like enough records to me.

In April of 2004, many of us from the message boards went to the UVa Pituitary Days Convention. That’s where the picture above comes in.  Other pictures from that convention are here.

By chance, we met a wonderful woman named Barbara Craven. She sat at our table for lunch on the last day and, after we learned that she was a dietitian who had had Cushing’s, one of us jokingly asked her if she’d do a guest chat for us. I didn’t follow through on this until she emailed me later. In the email, she asked how I was doing. Usually I say “fine” or “ok” but for some reason, I told her exactly how awful I was feeling.

Barbara emailed me back and said I should see a doctor at Johns Hopkins. I said I didn’t think I could get a recommendation to there, so SHE referred me. The doctor got right back to me, set up an appointment. Between his vacation and mine, that first appointment turned out to be Tuesday, Sept 14, 2004.

Just getting through the maze at Johns Hopkins was amazing. They have the whole system down to a science, moving from one place to another to sign in, then go here, then window 6, then… But it was very efficient.

My new doctor was wonderful. Understanding, knowledgeable. He never once said that I was “too fat” or “depressed” or that all this was my own fault. I feel so validated, finally.

He looked through my records, especially at my 2 previous Insulin Tolerance Tests (ITT). From those, he determined that my growth hormone has been low since at least August 2001 and I’ve been adrenal insufficient since at least Fall, 1999 – possibly as much as 17 years! I was amazed to hear all this, and astounded that my former endo not only didn’t tell me any of this, he did nothing. He had known both of these things – they were in the past records that I took with me. Perhaps that was why he had been so reluctant to share copies of those records. He had given me Cortef in the fall of 1999 to take just in case I had “stress” and that was it.

The new endo took a lot of blood (no urine!) for cortisol and thyroid stuff. I went back on Sept. 28, 2004 for arginine, cortrosyn and IGF testing.

He said that I would end up on daily cortisone – a “sprinkling” – and some form of GH, based on the testing the 28th.

For those who are interested, my new endo is Roberto Salvatori, M.D.
Assistant Professor of Medicine at Johns Hopkins

Medical School: Catholic University School of Medicine, Rome, Italy
Residency: Montefiore Medical Center
Fellowship: Cornell University, Johns Hopkins University
Board Certification: Endocrinology and Metabolism, Internal Medicine

Clinical Interests: Neuroendocrinology, pituitary disorders, adrenal disorders

Research Interests: Control of growth hormone secretion, genetic causes of growth hormone deficiency, consequences of growth hormone deficiency.

Although I have this wonderful doctor, a specialist in growth hormone deficiency at Johns Hopkins, in November, 2004, my insurance company saw fit to over-ride his opinions and his test results based on my past pharmaceutical history! Hello??? How could I have a history of taking GH when I’ve never taken it before?

Of course, I found out late on a Friday afternoon. By then it was too late to call my case worker at the drug company, so we had to appeal on Monday. My local insurance person also worked on an appeal, but the whole thing was  just another long ordeal of finding paperwork, calling people, FedExing stuff, too much work when I just wanted to start feeling better by Thanksgiving.

As it turned out the insurance company rejected the brand of hGH that was prescribed for me. They gave me the ok for a growth hormone was just FDA-approved for adults on 11/4/04. The day this medication was approved for adults was the day after my insurance said that’s what is preferred for me. In the past, this form of hGH was only approved for children with height issues. Was I going to be a ginuea pig again?

The new GH company assigned a rep for me, submitted info to pharmacy, and waited for insurance approval, again.

I finally started the Growth Hormone December 7, 2004.

Was the hassle and 3 year wait worth it?

Stay tuned for April 15, 2016 when all will be revealed.

Read

Read Dr. Barbara Craven’s Guest Chat, October 27, 2004

Thanks for reading 🙂

MaryO

Medium and Long-Term Data from a Series of 96 Endoscopic Transsphenoidal Surgeries for Cushing Disease

Objective

Postoperative data on Cushing’s disease (CD) are equivocal in the literature. These discrepancies may be attributed to different series with different criteria for remission and variable follow-up durations. Additional data from experienced centers may address these discrepancies. In this study, we present the results obtained from 96 endoscopic transsphenoidal surgeries (ETSSs) for CD conducted in a well-experienced center.

Methods

Pre- and postoperative data of 96 ETSS in 87 patients with CD were included. All cases were handled by the same neurosurgical team between 2014 and 2022. We obtained data on remission status 3−6 months postoperatively (medium-term) and during the latest follow-up (long-term). Additionally, magnetic resonance imaging (MRI) and pathology results were obtained for each case.

Results

The mean follow-up duration was 39.5±3.2 months. Medium and long-term remission rates were 77% and 82%, respectively. When only first-time operations were considered, the medium- and long-term remission rates were 78% and 82%, respectively. The recurrence rate in this series was 2.5%. Patients who showed remission between 3−6 months had higher longterm remission rates than did those without initial remission. Tumors >2 cm and extended tumor invasion of the cavernous sinus (Knosp 4) were associated with lower postoperative remission rates.

Conclusion

Adenoma size and the presence/absence of cavernous sinus invasion on preopera-tive MRI may predict long-term postoperative remission. A tumor size of 2 cm may be a supporting criterion for predicting remission in Knosp 4 tumors. Further studies with larger patient populations are necessary to support this finding.

Key WordsComplete remission · Neuroendoscopy · Pituitary-dependant Cushing syndrome · Treatment outcome.

Go to : Goto

INTRODUCTION

Cushing’s disease (CD) is characterized by excessive secretion of adrenocorticotropic hormone (ACTH) by a corticotropic adenoma in the pituitary gland. In patients with CD whose hypercortisolism is inadequately corrected, morbidity and mortality can increase by up to 4.8 times due to Cushingrelated complications such as osteoporosis, hypertension, dyslipidemia, insulin resistance, and hypercoagulability [11,18].
Endoscopic transsphenoidal surgery (ETSS), the first-line treatment for CD [7], is performed to decrease complications while achieving remission and long-term disease control. Previous studies on CD have reported varying remission rates between 45% and 95% and recurrence rates ranging from 3−66% [2,4,9,16,21,30]. This wide range of differences can be primarily attributed to differences in surgical experience among centers: centers with higher surgical experience have fewer postoperative complications and higher remission rates [4,6]. However, despite initial remission, patients with CD may eventually experience recurrence. The mean recurrence rate at the 5-10-year follow-up is 23% for microadenomas and 33% for macroadenomas [19,23,30].
Since the postoperative rates in the literature are variable, additional data from experienced centers may be necessary to resolve these discrepancies. In this study, we present the medium- and long-term follow-up data from 96 operations for CD that were conducted in a center with a high level of experience for ETSS.
Go to : Goto

MATERIALS AND METHODS

The study was conducted in accordance with the Declaration of Helsinki (as revised in 2013). The study was approved by the Ethics Committee of Basaksehir Cam and Sakura City Hospital (No. 2022185). Informed consent was obtained from all patients. The authors are accountable for all aspects of the work in ensuring that questions related to the accuracy or integrity of any part of the work are appropriately investigated and resolved.
This retrospective study included pre and postoperative data of 96 ETSS performed in 87 patients with CD (Fig. 1). CD was diagnosed based on unsuppressed cortisol levels (>1.8 µg/dL) following the 1-mg dexamethasone suppression test, high levels of urinary free cortisol, or late night salivary cortisol and plasma ACTH levels >20 pg/mL [28]. Between 2014 and 2022, all surgeries were conducted by the experienced neurosurgical team (Ö.G., O.T., B.E., E.A.) responsible for endoscopic transsphenoidal procedures at the Pituitary Research Center. The surgeries were performed under perioperative glucocorticoid coverage.

jkns-2023-0100f1.jpg
Fig. 1.
Number of operations and patients included in the study.

Download Figure

Size, cavernous sinus invasion, sellar and suprasellar infiltration of adenoma on preoperative magnetic resonance imaging (MRI) scans, residual tumor on postoperative MRI scans, postoperative complications, pathology results, remission and recurrence status, and additional postoperative management were evaluated in addition to patients’ demographic data. For follow-up assessments, data obtained 3−6 months postoperatively and during the latest follow-up were included. Three different classifications obtained during radiologic evaluation using MRI were used for pituitary adenomas : 1) maximum size of tumor (MST) : 0−5 mm (group 1), 6−10 mm (group 2), 11−20 mm (group 3), and >20 mm (group 4); 2) Knosp classification : for evaluation of cavernous sinus invasion [22]; and 3) modified Hardy classification : for evaluation of sellar and suprasellar infiltrations [20,39].
In cases of CD without a lesion or with a lesion <6 mm on MRI, confirmation of the central origin and lateralization was provided by inferior petrosal sinus sampling (IPSS) with corticotropin-releasing hormone stimulation [25,26,29]. Under neuronavigation guidance, pure ETSS surgical interventions were performed for all patients by a single surgical team using the Medtronic StealthStation S7 and S8 systems (Medtronic, Minneapolis, MN, USA) together with 4-mm 0°, 30°, and 45° rigid optical instruments and an endoscope. A nasal decongestant spray was administered 1 hour before the operation. The sphenoid ostium was detected from both nostrils, and a bi-nostril approach was used by resecting the posterior nasal septum. After sphenoidectomy, the standard sellar approach was used for lesions in the sellar region. The details of these surgical procedures are described in previous study [14]. Selective adenectomy with ETSS was performed for preoperatively localized and visible tumors, whereas hemihypophysectomy was performed for non-lesional cases. In cases with cavernous sinus-invading tumors, particularly Knops 3-4, the defect which was created by the tumor on the medial wall of anterior cavernous sinus was identified and, it was expanded for resection of the tumor tissue within the cavernous sinus. If a defect was not visible, blunt-ended hook-shaped dissectors were used to create a defect on the medial wall, allowing access for the tumor to enter the cavernous sinus. Hematoxylin and Eosin (H&E) and immunohistochemistry staining were performed for the specimens obtained during ETSS. Adenomas showing positive immunohistological staining for ACTH were diagnosed histologically as corticotropinomas.
CD was considered to be in remission when the cases showed basal cortisol levels <5 µg/dL or suppressed cortisol levels (≤1.8 µg/dL) following the 1-mg dexamethasone suppression test, 3-6 months postoperation, and during the latest follow-up. The study protocol was approved by the ethics committee of our institution.
Data were statistically analyzed using the SPSS 15.0 package (IBM Corp., Armonk, NY, USA). The chi-square test was used for categorical variables. Sample distribution was evaluated with the Kolmogorov-Smirnov test. Continuous independent variables with a normal distribution were compared using the Student’s t-test. Continuous variables with non-normal distributions were compared using the Mann-Whitney U test. p<0.05 was considered statistically significant. A Kaplan-Meier survival analysis was conducted to determine probability and time to recurrence in cases with initial remission.
Go to : Goto

RESULTS

Demographic data

A total of 96 ETSS were performed for 87 patients with CD. Of the 87 patients, 68 (79%) were female, and 19 (21%) were male. The mean patient age was 42.2±12.9 years, and the mean duration of follow-up was 39.5±3.2 months. Of the 96 surgeries, 79 (82%) were performed for the first time, six (6%) were performed for residual tumors, and 11 (12%) were performed following a recurrence of the disease. Eight of the 17 patients who underwent reoperations had undergone their first operation at another center.

Preoperative imaging

Table 1 shows the maximum tumor size on preoperative pituitary MRI before each surgical procedure. Preoperative IPSS for lateralization was performed in 42 operations (44%), all of which were first-time cases. Knosp classification based on preoperative pituitary MRI and the modified Hardy classification is presented in Table 1.

Table 1.

Preoperative pituitary magnetic resonance imaging scans

Number of tumors (n=96)
Maximum tumor size
 Group 1, 0−5 mm 41 (42.7)
 Group 2, 6−10 mm 24 (25.0)
 Group 3, 11−20 mm 20 (20.8)
 Group 4, >20 mm 11 (11.5)
Knosp classification
 Grade 0 52 (54.2)
 Grade 1 22 (22.9)
 Grade 2 6 (6.3)
 Grade 3 8 (8.3)
 Grade 4 8 (8.3)
Modified Hardy classification
 0
  A 41 (42.8)
  B
  C
  D
  E
 1
  A 14 (14.6)
  B
  C
  D
  E 4 (4.2)
 2
  A 5 (5.2)
  B
  C
  D
  E 5 (5.2)
 3
  A 1 (1.0)
  B 2 (2.1)
  C
  D
  E 1 (1.0)
 4
  A 1 (1.0)
  B
  C
  D 1 (1.0)
  E 3 (3.1)
 NA 18 (18.8)

Values are presented as number (%). Invasion : 0, sella normal; 1, sella focally expanded and tumor ≤10 mm; 2, sella enlarged and tumor ≥10 mm; 3, localized perforation of the sellar floor; 4, diffuse destruction of the sellar floor. Suprasellar extension : A, no suprasellar extension; B, anterior recesses of the third ventricle obliterated; C, floor of the third ventricle grossly displaced with parasellar extension; D, intracranial (intradural) : anterior, middle or middle fossa; E, into/beneath the cavernous sinus (extradural).

NA : not available

Download Table

Postoperative results

Remission was achieved between the 3rd and 6th months in 74 (77%) of the 96 operations, and long-term remission in 79 operations (82%). Among all 96 operations, eight (8%) concluded with a residual tumor. Regarding only first-time operations, five (6%) of the 79 concluded with a postoperative residual tumor. Of the 79 first-time operations, there were 62 cases (78%) of remission between 3 and 6 months. Two (2.5%) of these 79 operations involved recurrence during follow-up, while 60 (97%) showed sustained remission. Those with sustained remission had a median disease-free survival time of 31 months (interquartile range, 14-64) during long-term followup, two cases with recurrence had their recurrence 49 and 54 months after their operation. Survival analysis of cases with remisson and recurrence is presented in Fig. 2. CD persisted after 17 (21.5%) of the 79 first operations.

jkns-2023-0100f2.jpg
Fig. 2.
Survival analysis after the first operation in cases with remission at 3-6 months. Dashed line represents cases with recurrence and, straight line represents cases with sustained remission during long-term follow-up.

Download Figure

Ten (13%) of the 79 cases underwent reoperation; two were due to recurrence, and eight due to disease persistence. In five cases (29%), the patients were initially unresponsive but showed remission later during the long-term follow-up. Remission was achieved with stereotactic radiosurgery (STRS) and medical treatment in one of these cases, with only STRS in two and only medical treatment in two cases. At the latest follow-up visit, the total number of cases showing remission after the first operation was 65 (82%). Additional details regarding the results of the first operations are provided in Fig. 3.

jkns-2023-0100f3.jpg
Fig. 3.
Results of the cases who had operation for the first time.

Download Figure

Of the 18 reoperations, the results for one case were excluded since the patient was operated at another center. After the reoperation (n=17), the medium and long-term remission rates were 71% (n=12) and 77% (n=13), respectively. The 3-6-month remission rate did not differ significantly between first-time and reoperations (p=0.5). Residual tumors were present in three cases (18%) after reoperation. Of the early non-responders, one case showed remission after STRS, and none of the responders showed recurrence during long-term follow-up. Additional details regarding the results of reoperations are provided in Fig. 4.

jkns-2023-0100f4.jpg
Fig. 4.
Results of the reoperations in our center.

Download Figure

Remission rates based on tumor size are presented in Table 2. The initial remission rates of the tumors in MST group 4 were significantly lower than those in the other MST groups (MST 1 vs. 4, p=0.01; MST 2 vs. 4, p=0.001; and MST 3 vs. 4, p=0.006). Comparisons of the other MST groups showed no significant differences. When adenomas were stratified using the 10-mm cut-off, the remission rates did not differ significantly (remission rate, 81% for adenomas <10 mm and 68% for adenomas ≥10 mm; p=0.2). Postoperative residual tumors were observed in five of the 11 tumors (46%) >2 cm (MST group 4) and in one tumor in each of MST groups 1-3 (2%, 4%, and 5%, respectively, p<0.001). Reoperation rate was 17% (n=7) for adenomas ≤5 mm, 18% (n=10) for adenomas ≥6 mm (p=0.9), and 27% (n=3) for adenomas >20 mm (among all grades, p=0.3).

Table 2.

Comparison of remission rates in preoperative pituitary magnetic resonance imaging scans

3−6-month remission Long-term remission
Maximum tumor size
 Group 1, 0−5 mm (n=41) 31 (75.6) 33 (80.5)
 Group 2, 6−10 mm (n=24) 22 (91.7) 22 (91.7)
 Group 3, 10−20 mm (n=20) 17 (85.0) 17 (85.0)
 Group 4, >20 mm (n=11) 4 (36.4) 7 (63.6)
p-value 0.003* 0.200
Knops classification
 0 (n=52) 41 (78.8) 44 (84.6)
 1 (n=22) 21 (95.5) 21 (95.5)
 2 (n=6) 4 (66.7) 3 (50.0)
 3 (n=8) 7 (87.5) 7 (87.5)
 4 (n=8) 1 (12.5) 4 (50.0)
p-value <0.001* 0.010*
Modified Hardy classification
 0
  A (n=41) 32 (78.0) 34 (82.9)
 1
  A (n=14) 12 (85.7) 12 (85.7)
 2
  E (n=4) 3 (75.0) 3 (75.0)
  A (n=5) 5 (100.0) 5 (100.0)
 3
  E (n=5) 2 (40.0) 2 (40.0)
  A (n=1) 1 (100.0) 1 (100.0)
  B (n=2) 2 (100.0) 2 (100.0)
 4
  E (n=1) 0 (0.0) 0 (0.0)
  A (n=1) 1 (100.0) 1 (100.0)
  D (n=1) 0 (0.0) 0 (0.0)
  E (n=3) 1 (33.3) 3 (100.0)
p-value 0.10 0.06
Pathology result
 Corticotropinoma (+) (n=71) 58 (81.7) 60 (84.5)
 Corticotropinoma (-) (n=25) 16 (64.0) 19 (76.0)
p-value 0.07 0.30

Values are presented as number (%). Invasion : 0, sella normal; 1, sella focally expanded and tumor ≤10 mm; 2, sella enlarged and tumor ≥10 mm; 3, localized perforation of the sellar floor; 4, diffuse destruction of the sellar floor. Suprasellar extension : A, no suprasellar extension; B, anterior recesses of the third ventricle obliterated; D, intracranial (intradural) with anterior, middle, or middle fossa; E, into/beneath the cavernous sinus (extradural).

* Statistically significant p-value

Download Table

Remission rates based on Knosp and Hardy classifications are presented in Table 2, respectively. The medium-term remission rates in Knosp group 4 were significantly lower than the rates in the other groups (Knosp 0 vs. 4, p<0.001; Knosp 1 vs. 4, p<0.001; Knosp 2 vs. 4, p=0.04; and Knosp 3 vs. 4, p=0.003). Additionally, the medium-term remission rate of tumors in Knosp group 2 was lower than that in Knosp group 1 (p=0.04). However, remission rates did not differ significantly among the other groups. Comparing invasive (Knosp 3 and 4) and noninvasive (Knosp 0, 1, and 2) tumors, remission rates within 3-6 months were 50% and 83% in the invasive and noninvasive groups, respectively. We further stratified cases with tumor size ≥20 mm (n=11) using Knosp classification; one case (9%) was Knosp 0, one case (9%) was Knosp 1, two cases (18%) were Knosp 3, and seven cases (64%) were Knosp 4 tumors. For ≥20 mm, all cases with Knosp 0, 1, and 3 tumors achieved remission within 3-6 months postoperatively, while none of the cases with Knosp 4 tumors had remission (p=0.01). All the cases with Knosp 0, 1, and 3 tumors sustained remission, and three cases with Knosp 4 tumor later achieved long-term remission (p=0.3). Of the cases that achieved long-term remission, two underwent STRS, and one had medical therapy with additional STRS.
Of the 96 tissue specimens obtained during ETSS, 71 (74%) stained positive for ACTH and were histologically identified as corticotropic adenomas, while 25 (26%) were negative. Remission rates based on the pathology results are compared in Table 2. Of the lesions with conclusive findings on MRI (≥6 mm lesions), 89% (n=49) were pathologically confirmed as corticotropinomas, whereas 54% (n=22) of those with inconclusive MRI f indings were pathologically conf irmed (p<0.001). Among the lesions that showed negative results for both conclusive MRI findings (≤5 mm) and pathologic confirmation (negative for a corticotropinoma) (n=19), 12 (63%) showed remission at 3-6 months and 14 (74%) showed remission during long-term follow-up.
During the exploration of the cavernous sinus in one patient (1%), postoperative lateral gaze paralysis of the eye developed due to right abducens nerve palsy. The patient was treated with anti-inflammatory doses of steroids, and the symptom completely resolved within 1 month. In three other patients (3%), severe epistaxis was observed in the postoperative period, 1 to 3 weeks after surgery. Nasal packing was applied for 3 days. Additionally, three patients (3%) experienced postoperative rhinorrhea. To address this issue, a reconstruction of the skull base was performed using fat tissue harvested from the leg, fascia lata graft, and tissue adhesive material. These patients were monitored with a lumbar drain for 1 week. Among the patients who developed rhinorrhea, one patient also developed meningitis and received intravenous antibiotic therapy for about 3 weeks and, the situation compeletly resolved during follow-up. The postoperative complications are summarized in Table 3. Comparison of various characteristics of the cases with and without medium and long-term remission are presented in Table 3, respectively.

Table 3.

Comparison of cases with and without remission, postoperative complications

3−6-month remission


Long-term remission


Number of cases (n=96)
Remission (+) (n=74) Remission (-) (n=22) p-value Remission (+) (n=79) Remission (-) (n=17) p-value
Operation 0.500 0.08
 First time 62 (83.8) 17 (77.3) 66 (83.5) 13 (76.5)
 Re-operation 12 (16.2) 5 (22.7) 13 (16.5) 4 (23.5)
Tumor characteristics 0.003* 0.20
 MST
  Grade 1 31 (42.0) 10 (45.0) 33 (41.8) 8 (47.1)
  Grade 2 22 (30.0) 2 (9.0) 22 (27.8) 2 (11.8)
  Grade 3 17 (23.0) 3 (14.0) 17 (21.5) 3 (17.6)
  Grade 4 4 (5.0) 7 (32.0) 7 (8.9) 4 (23.5)
 Knosp classification <0.001* 0.01*
  0 41 (56.0) 11 (50.0) 44 (55.5) 9 (53.0)
  1 21 (28.0) 1 (4.5) 21 (26.5) 2 (12.0)
  2 4 (5.0) 2 (9.0) 3 (4.0) 1 (6.0)
  3 7 (10.0) 1 (4.5) 7 (9.0) 1 (6.0)
  4 1 (1.0) 7 (32.0) 4 (5.0) 4 (23.0)
 Hardy classification 0.09 0.06
  0A 32 (43.2) 9 (41.0) 34 (43.0) 7 (41.0)
  1A 12 (16.2) 2 (9.0) 12 (15.0) 2 (12.0)
  1E 3 (4.0) 1 (4.5) 3 (4.0) 1 (6.0)
  2A 5 (6.7) 0 (0.0) 5 (6.0) 0 (0.0)
  2E 2 (2.7) 3 (14.0) 2 (3.0) 3 (17.0)
  3A 1 (1.4) 0 (0.0) 1 (1.0) 0 (0.0)
  3B 2 (2.7) 0 (0.0) 2 (3.0) 0 (0.0)
  3E 0 (0.0) 1 (4.5) 0 (0.0) 1 (6.0)
  4A 1 (1.4) 0 (0.0) 1 (1.0) 0 (0.0)
  4D 0 (0.0) 1 (4.5) 0 (0.0) 1 (6.0)
  4E 1 (1.4) 2 (9.0) 3 (4.0) 0 (0.0)
  NA 15 (20.3) 3 (13.5) 16 (20.0) 2 (12.0)
Postoperative
 Complication 0.900 0.30
  (+) 10 (13.5) 3 (13.6) 12 (15.2) 1 (5.9)
  (-) 64 (86.5) 19 (86.4) 67 (84.8) 16 (94.1)
 Pathologic diagnosis 0.070 0.30
  Corticotropinoma 58 (78.4) 13 (59.1) 60 (75.9) 11 (64.7)
  Negative 16 (21.6) 9 (40.9) 19 (24.1) 6 (35.3)
 Remission during long-term F/U <0.001*
  (+) 72 (97.3) 7 (31.8)
  (-) 2 (2.7) 15 (68.2)
 Residual tumor 0.001*
  (+) 3 (3.8) 5 (29.4)
  (-) 76 (96.2) 12 (70.6)
 Remission during long-term F/U <0.001*
  (+) 72 (91.1) 2 (11.8)
  (-) 7 (8.9) 15 (88.2)
Postoperative complication
 DI-temporary 4 (4.2)
 DI-permanent 4 (4.2)
 Meningitis 1 (1.0)
 CSF leak 3 (3.1)
 Epistaxis 3 (3.1)
 Cranial nerve palsy, transient 1 (1.0)
Hypopituitarism 4 (4.2)
 Hypocortisolism 2 (2.1)
 Hypothyroidisim 2 (2.1)

Values are presented as number (%). *Statistically significant p-values. MST : maximum size of tumor, NA : not available, F/U : follow up, DI : diabetes insipidus, CSF : cerebrospinal fluid

Download Table

Go to : Goto

DISCUSSION

This study reported an overall postoperative 3-6 month remission rate of 77% and a long-term remission rate of 82% after 3 years of follow-up. The initial and long-term remission rates after first operations were 78% and 82%, respectively, with a recurrence rate of 2.5% over a follow-up period of 3-3.5 years. Additionally, our findings revealed that tumor size >2 cm and extended tumor invasion of the cavernous sinus (Knosp 4) might be associated with lower postoperative remission rates. Patients who showed remission within 3-6 months showed higher rates of long-term remission than those in patients without initial remission.
Pituitary surgery is the first-line treatment modality for CD. ETSS is a safe and less invasive method for treating pituitary adenomas; therefore, it has been increasingly preferred in CD [5,15]. However, the postsurgical outcomes in patients with CD have shown variable remission and recurrence rates [2,4,9,16,17,21,30]. These discrepancies may be attributable to differences in population and number of cases involved in the studies, tumor characteristics, criteria for remission and recurrence used by the centers, laboratory parameters, time of evaluation and followup durations, surgical and imaging techniques used by different centers, and neurosurgical expertise.
In this study, we present the medium- and long-term postoperative results of 96 ETSS procedures performed in 87 patients. The medium-term results (obtained 3-6 months postoperation) were preferred to immediate results since a subset of cases may show delayed remission, and immediate postoperative results could be misleading in almost 6% of cases [37]. The overall medium-term remission rate was 77%, consistent with the results published by Serban et al. [34], who reported an overall remission rate of 77% 2 months postoperation. A larger series of 1106 cases reported an immediate remission rate of 72.5% within 7 days postoperation; however, this rate decreased to 67% after delayed remission rates and recurrences 56 months postoperation were considered [12]. The long-term remission rate obtained over a median period of 3 years was 82% in our series. The increased long-term remission rate was attributed to reoperations, additional medical therapies, and the use of STRS in those who did not show remission initially.
Of the 96 procedures, 79 were performed for the first time. The medium-term remission rate after first operations was 78%. Recent studies have reported remission rates of 74-82% after first operations [12,34]. The recurrence rates reported previously varied between 3% and 66% [5,12,34]. However, the duration of follow-up differed among the studies. Dai et al. [12] and Brady et al. [5] reported recurrence rates of 12% and 3%, respectively, after a follow-up period of 2 years. In contrast, Serban et al. [34] reported a recurrence rate of 17% after a longer followup duration of 6 years. In this series, after a median follow-up period of 3 years, the overall recurrence rate was 2.5%. Residual tumors were observed in five cases (6%), and the reoperation rate after the first operation was 13%. Including the eight patients admitted for reoperation after having undergone their first surgery in another center, 17 cases involved reoperations in our center. Of these cases, 71% (n=12) showed remission between 3-6 months postoperation, while none showed recurrence; thus, the long-term remission rate was 77%. Residual tumors were detected in three cases (18%), and the disease persisted in four (24%) of these 17 reoperated cases. Previous studies have reported remission rates of 22-75% after repeated surgery in CD [5,12,34,38]. Although the success rates after reoperations were lower than those in first-time operations in some studies [38], the remission rates after the first and reoperations did not differ significantly in our study.
Tumor size has been reported to contribute to the success of transsphenoidal surgery [12,34], with microadenomas showing a higher success rate after surgery [5,12,34]. Our remission rates for micro- and macroadenomas were similar to those reported by Dai et al. [12] : 81% for adenomas <10 mm and 68% for adenomas ≥10 mm. However, the statistical significance of our study differed from that in the series presented by Dai et al. [12] (p=0.2 vs. p=0.002). This may be due to the large difference in the number of cases included in the two studies and the differences in size scales for tumors ≥10 mm. In our series, when the tumors were stratified further by the tumor size, the medium-term remission rate further decreased to 36% for tumors ≥20 mm in size, although the remission rates for other groups <20 mm were all above 75% (p=0.003). Sharifi et al. [35] classified pituitary MRI scans in CD showing a tumor size <6 mm as “inconclusive” because incidentalomas are frequent among tumors in this size range, and this size is not indicative of CD. Previously published series reported that the rate of inconclusive MRI scans in CD was 36-64%, and the remission rates varied between 50% and 71% for those with an inconclusive MRI scan [10,24,27,32,33]. In our series, 54% of the preoperative MRI scans were inconclusive. In the series presented by Sharifi et al. [35] and some other series [8,12,32,36], no significant difference was observed between the remission rates of CD cases with and without a conclusive MRI.This finding is controversial since other studies showed decreased remission rates with preoperative inconclusive MRIs [13,40]. Similar to the results reported by Sharifi et al. [35], we did not find a statistically significant difference between the remission rates of tumors <6 mm and those between 6-20 mm. However, a significant difference was observed between tumors <6 mm and those ≥20 mm. Residual tumors were more frequent after operating tumors >20 mm compared to those <20 mm, but the number of reoperations did not differ among the groups. Additionally, tumors >20 mm were primarily Knosp 4 (64%), probably contributing to lower remission rates in this group. Interestingly, two Knosp 3 cases had postoperative remission within 3-6 months without additional intervention. In these two cases, the surgical team explored the cavernous sinus and could resect the tumor. However, complete excision was not feasible with Knosp 4 tumors, where there is a complete encasement of the intracavernous internal carotid artery. Thus, a tumor size of 20 mm may be supportive data in predicting non-remission in the presence of complete cavernous sinus infiltration.
Cavernous sinus invasion, determined by the Knosp classification, and sellar invasion and/or suprasellar extension, determined by the Hardy-Wilson classification, indicate the radiologic status of local invasion in cases of pituitary tumors [20,22,39]. Invasion to surrounding structures and tissues may be a limiting factor for postoperative remission of pituitary tumors. In the series presented by Dai et al. [12], remission rates of corticotropinomas with Knosp grade 4 (definitive cavernous sinus invasion) dropped to 53% from a remission rate of 77% for corticotropinomas with less likely or no cavernous sinus invasion (p<0.001). Similarly, our results showed that both medium- and long-term remission rates for Knosp grade 4 tumors decreased to 13% and 50%, respectively, and were lower than the remission rates in other grades (p<0.001 and p=0.01, respectively). While remission rates in Knosp group 3 were not inferior to noninvasive tumors, remission rates in Knosp group 4 were lower than all the other groups. In this regard, the extent of invasion may be more determinative. In contrast, in our series, the modified Hardy classification did not show a significant effect on postoperative remission rates in medium- and long-term follow-up assessments. Araujo-Castro et al. [3] had previously shown that for pituitary adenomas, the Hardy-Wilson classification lacked utility in predicting postoperative remission compared to the Knosp classification. The difference in the utility of these classifications for predicting postoperative remission may be due to differences in accessing tissues during surgery.
In the present series, 74% (n=71) of tissues were histologically proven to be corticotropinomas, while 26% (n=25) did not show histologic confirmation. Medium- and long-term remission rates did not differ between histologically proven and unproven CD cases (medium-term remission rates, 82% vs. 64%, p=0.07; long-term remission rates, 85% vs. 76%, p=0.3). A conclusive finding of an adenoma on MRI increased the rate of histologic proof of corticotropinoma in our series, implying that adenomas showing a ≥6-mm lesion on MRI more frequently stained positive for ACTH. In previous studies 12-53% of CD did not have postoperative pathologic identification and the rate increased in those with a preoperative inconclusive MRI [25,31,38]. However, this did not have a significant influence on our remission rates. The remission rates did not decrease even for CD cases that were not conclusively detected on MRI and could not be histologically proven. On the other hand, in previous studies, ACTH positivity was higher, and the lack of proof for a corticotropinoma decreased the remission rates [1,12,31,32,34]. The higher remission rates despite reduced localization with MRI and/or lower rates of histologic confirmation in our series may be explained by the successful preoperative IPSS lateralization, surgical exploration, and hemi-hypophysectomy procedure. Furthermore, tumor tissues might have been aspirated along with blood and other materials through the suction tube, potentially resulting in less histological confirmation despite postoperative remission of CD.
Additionally, tumor tissues might have been aspirated along with blood and other materials through the suction tube, potentially resulting in less histological confirmation despite postoperative remission of CD.
The total rate of complications in this series was 20%, and the most frequent complication was diabetes insipidus (DI; 8%, both permanent and temporary). The incidence of hypopituitarism was relatively lower (4%), mainly involving hypocortisolism and hypothyroidism. Recent studies have shown postoperative DI rates of 25-66% and hypothyroidism rates of 11-23% [5,34]. Although our neurosurgical team was experienced in conducting pituitary surgeries, other factors may have resulted in these differences. Since not all the cases were postoperatively followed in our center, with some patients lost to follow-up, there may be missing data.
Comparing cases with and without remission in the medium term, cases of remission frequently involved adenomas >20 mm and less cavernous sinus invasion. Additionally, cases that achieved medium-term remission showed long-term remission more frequently. In the long term, those showing remission had less cavernous sinus invasion and residual tumors compared to those without remission. Therefore, we may conclude that a tumor size of 20 mm may predict medium-term remission, while the absence of/less cavernous sinus invasion, early remission, and absence of residual tumor may predict long-term remission.
This study had limitations. First, the retrospective nature of the study and the limited number of cases, which was inevitable due to the low incidence of CD, may have distorted our results. Although the same neurosurgical team operated on all patients, they were followed up pre and postoperatively at different endocrinology centers, causing difficulty in obtaining the full postoperative data of certain cases. Lastly, some patients recently underwent ETSS; thus, they had a shorter follow-up period. However, we intend to present the longer-term outcomes of all patients in a separate study.
Although ETSS is the first-line treatment for CD, previous studies on the use of ETSS for CD have reported a wide range of remission and recurrence rates, which can be primarily attributed to differences in the surgical experience levels among centers. This trend highlights the need for additional data from experienced centers to resolve the discrepancies in the existing data. Therefore, we present medium- and long-term follow-up data from 96 operations for CD conducted in a center with a high level of experience for ETSS. We believe our study makes a significant contribution to the literature because the findings reconfirm the usefulness of ETSS for the treatment of CD and highlight the importance of the size of the adenoma and presence/absence of cavernous sinus invasion on preoperative MRI in predicting long-term remission postoperatively.
Go to : Goto

CONCLUSION

ETSS is a safe and effective method for the treatment of CD. Some characteristics of adenomas, such as size, cavernous sinus invasion, and postoperative residue, may predict long-term remission. A tumor size of 2 cm may be a supporting criterion for predicting remission status in the presence of complete cavernous sinus infiltration. Further studies with larger patient populations are necessary to support this finding.
Go to : Goto

Notes

Conflicts of interest

No potential conflicts of interest relevant to this study exist.

Informed consent

Informed consent was obtained from all individual participants included in this study.

Author contributions

Conceptualization : BE, MB, EH; Data curation : EA, OH, DT, MM; Formal analysis : LŞP, DAB, DT, İÇ; Funding acquisition : OT, ÖG, DAB; Methodology : LŞP, İÇ, MM, ÖG; Project administration : BE, SÇ, EH; Visualization : EA, OT, OH; Writing – original draft : BE, MB, SÇ; Writing – review & editing : BE, EH

Data sharing

None

Preprint

None

Go to : Goto

Acknowledgements

This manuscript was edited by a certified English Proofreading Service (Editage).
Go to : Goto

References

1. Acebes JJ, Martino J, Masuet C, Montanya E, Soler J : Early post-operative ACTH and cortisol as predictors of remission in Cushing’s disease. Acta Neurochir (Wien) 149 : 471-477; discussion 477-479, 2007
crossref pmid pdf
2. Aranda G, Enseñat J, Mora M, Puig-Domingo M, Martínez de Osaba MJ, Casals G, et al : Long-term remission and recurrence rate in a cohort of Cushing’s disease: the need for long-term follow-up. Pituitary 18 : 142-149, 2015
crossref pmid pdf
3. Araujo-Castro M, Acitores Cancela A, Vior C, Pascual-Corrales E, Rodríguez Berrocal V : Radiological Knosp, revised-Knosp, and Hardy-Wilson classifications for the prediction of surgical outcomes in the endoscopic endonasal surgery of pituitary adenomas: study of 228 cases. Front Oncol 11 : 807040, 2022
crossref pmid pmc
4. Biller BM, Grossman AB, Stewart PM, Melmed S, Bertagna X, Bertherat J, et al : Treatment of adrenocorticotropin-dependent Cushing’s syndrome: a consensus statement. J Clin Endocrinol Metab 93 : 2454-2462, 2008
crossref pmid pmc pdf
5. Brady Z, Garrahy A, Carthy C, O’Reilly MW, Thompson CJ, Sherlock M, et al : Outcomes of endoscopic transsphenoidal surgery for Cushing’s disease. BMC Endocr Disord 21 : 36, 2021
crossref pmid pmc pdf
6. Brichard C, Costa E, Fomekong E, Maiter D, Raftopoulos C : Outcome of transsphenoidal surgery for cushing disease: a single-center experience over 20 years. World Neurosurg 119 : e106-e117, 2018
crossref pmid
7. Broersen LHA, Biermasz NR, van Furth WR, de Vries F, Verstegen MJT, Dekkers OM, et al : Endoscopic vs. microscopic transsphenoidal surgery for Cushing’s disease: a systematic review and meta-analysis. Pituitary 21 : 524-534, 2018
crossref pmid pmc pdf
8. Cebula H, Baussart B, Villa C, Assié G, Boulin A, Foubert L, et al : Efficacy of endoscopic endonasal transsphenoidal surgery for Cushing’s disease in 230 patients with positive and negative MRI. Acta Neurochir (Wien) 159 : 1227-1236, 2017
crossref pmid pdf
9. Chandler WF, Barkan AL, Hollon T, Sakharova A, Sack J, Brahma B, et al : Outcome of transsphenoidal surgery for cushing disease: a singlecenter experience over 32 years. Neurosurgery 78 : 216-223, 2016
pmid
10. Ciric I, Zhao JC, Du H, Findling JW, Molitch ME, Weiss RE, et al : Transsphenoidal surgery for Cushing disease: experience with 136 patients. Neurosurgery 70 : 70-80; discussion 80-81, 2012
pmid
11. Clayton RN, Raskauskiene D, Reulen RC, Jones PW : Mortality and morbidity in Cushing’s disease over 50 years in Stoke-on-Trent, UK: audit and meta-analysis of literature. J Clin Endocrinol Metab 96 : 632-642, 2011
crossref pmid pdf
12. Dai C, Feng M, Sun B, Bao X, Yao Y, Deng K, et al : Surgical outcome of transsphenoidal surgery in Cushing’s disease: a case series of 1106 patients from a single center over 30 years. Endocrine 75 : 219-227, 2022
crossref pmid pdf
13. Doglietto F, Maira G : Cushing disease and negative magnetic resonance imaging finding: a diagnostic and therapeutic challenge. World Neurosurg 77 : 445-447, 2012
crossref pmid
14. Erkan B, Barut O, Akbas A, Akpinar E, Akdeniz YS, Tanriverdi O, et al : Results of endoscopic surgery in patients with pituitary adenomas : association of tumor classification grades with resection, remission, and complication rates. J Korean Neurosurg Soc 64 : 608-618, 2021
crossref pmid pmc pdf
15. Fang J, Xie S, Li N, Jiang Z : Postoperative complications of endoscopic versus microscopic transsphenoidal pituitary surgery: a meta-analysis. J Coll Physicians Surg Pak 28 : 554-559, 2018
crossref pmid
16. Feng M, Liu Z, Liu X, Bao X, Yao Y, Deng K, et al : Diagnosis and outcomes of 341 patients with Cushing’s disease following transsphenoid surgery: a single-center experience. World Neurosurg 109 : e75-e80, 2018
crossref pmid
17. Fleseriu M, Hamrahian AH, Hoffman AR, Kelly DF, Katznelson L; AACE Neuroendocrine, Pituitary Scientific Committee : American Association of Clinical Endocrinologists and American College of Endocrinology Disease state clinical review: diagnosis of recurrence in Cushing disease. Endocr Pract 22 : 1436-1448, 2016
crossref pmid
18. Hakami OA, Ahmed S, Karavitaki N : Epidemiology and mortality of Cushing’s syndrome. Best Pract Res Clin Endocrinol Metab 35 : 101521, 2021
crossref pmid
19. Hameed N, Yedinak CG, Brzana J, Gultekin SH, Coppa ND, Dogan A, et al : Remission rate after transsphenoidal surgery in patients with pathologically confirmed Cushing’s disease, the role of cortisol, ACTH assessment and immediate reoperation: a large single center experience. Pituitary 16 : 452-458, 2013
crossref pmid pdf
20. Hardy J, Vezina JL : Transsphenoidal neurosurgery of intracranial neoplasm. Adv Neurol 15 : 261-273, 1976
pmid
21. Juszczak A, Ertorer ME, Grossman A : The therapy of Cushing’s disease in adults and children: an update. Horm Metab Res 45 : 109-117, 2013
crossref pmid
22. Knosp E, Steiner E, Kitz K, Matula C : Pituitary adenomas with invasion of the cavernous sinus space: a magnetic resonance imaging classification compared with surgical findings. Neurosurgery 33 : 610-617; discussion 617-618, 1993
crossref pmid
23. Lambert JK, Goldberg L, Fayngold S, Kostadinov J, Post KD, Geer EB : Predictors of mortality and long-term outcomes in treated Cushing’s disease: a study of 346 patients. J Clin Endocrinol Metab 98 : 1022-1030, 2013
crossref pmid pmc
24. Lüdecke DK, Flitsch J, Knappe UJ, Saeger W : Cushing’s disease: a surgical view. J Neurooncol 54 : 151-166, 2001
pmid
25. Mamelak AN, Dowd CF, Tyrrell JB, McDonald JF, Wilson CB : Venous angiography is needed to interpret inferior petrosal sinus and cavernous sinus sampling data for lateralizing adrenocorticotropin-secreting adenomas. J Clin Endocrinol Metab 81 : 475-481, 1996
crossref pmid
26. McCance DR, McIlrath E, McNeill A, Gordon DS, Hadden DR, Kennedy L, et al : Bilateral inferior petrosal sinus sampling as a routine procedure in ACTH-dependent Cushing’s syndrome. Clin Endocrinol (Oxf) 30 : 157-166, 1989
crossref pmid
27. Netea-Maier RT, van Lindert EJ, den Heijer M, van der Eerden A, Pieters GF, Sweep CG, et al : Transsphenoidal pituitary surgery via the endoscopic technique: results in 35 consecutive patients with Cushing’s disease. Eur J Endocrinol 154 : 675-684, 2006
crossref pmid
28. Nieman LK, Biller BM, Findling JW, Newell-Price J, Savage MO, Stewart PM, et al : The diagnosis of Cushing’s syndrome: an Endocrine Society clinical practice guideline. J Clin Endocrinol Metab 93 : 1526-1540, 2008
crossref pmid pmc
29. Oldfield EH, Doppman JL, Nieman LK, Chrousos GP, Miller DL, Katz DA, et al : Petrosal sinus sampling with and without corticotropin-releasing hormone for the differential diagnosis of Cushing’s syndrome. N Engl J Med 325 : 897-905, 1991
crossref pmid
30. Petersenn S, Beckers A, Ferone D, van der Lely A, Bollerslev J, Boscaro M, et al : Therapy of endocrine disease: outcomes in patients with Cushing’s disease undergoing transsphenoidal surgery: systematic review assessing criteria used to define remission and recurrence. Eur J Endocrinol 172 : R227-R239, 2015
crossref pmid
31. Prevedello DM, Pouratian N, Sherman J, Jane JA Jr, Vance ML, Lopes MB, et al : Management of Cushing’s disease: outcome in patients with microadenoma detected on pituitary magnetic resonance imaging. J Neurosurg 109 : 751-759, 2008
crossref pmid
32. Salenave S, Gatta B, Pecheur S, San-Galli F, Visot A, Lasjaunias P, et al : Pituitary magnetic resonance imaging findings do not influence surgical outcome in adrenocorticotropin-secreting microadenomas. J Clin Endocrinol Metab 89 : 3371-3376, 2004
crossref pmid
33. Semple PL, Laws ER Jr : Complications in a contemporary series of patients who underwent transsphenoidal surgery for Cushing’s disease. J Neurosurg 91 : 175-179, 1999
crossref
34. Serban AL, Del Sindaco G, Sala E, Carosi G, Indirli R, Rodari G, et al : Determinants of outcome of transsphenoidal surgery for Cushing disease in a single-centre series. J Endocrinol Invest 43 : 631-639, 2020
crossref pmid pdf
35. Sharifi G, Amin AA, Sabahi M, Echeverry NB, Dilmaghani NA, Mousavinejad SA, et al : MRI-negative Cushing’s disease: management strategy and outcomes in 15 cases utilizing a pure endoscopic endonasal approach. BMC Endocr Disord 22 : 154, 2022
crossref pmid pmc pdf
36. Sun Y, Sun Q, Fan C, Shen J, Zhao W, Guo Y, et al : Diagnosis and therapy for Cushing’s disease with negative dynamic MRI finding: a singlecentre experience. Clin Endocrinol (Oxf) 76 : 868-876, 2012
crossref pmid
37. Valassi E, Biller BM, Swearingen B, Pecori Giraldi F, Losa M, Mortini P, et al : Delayed remission after transsphenoidal surgery in patients with Cushing’s disease. J Clin Endocrinol Metab 95 : 601-610, 2010
crossref pmid pmc pdf
38. Valderrábano P, Aller J, García-Valdecasas L, García-Uría J, Martín L, Palacios N, et al : Results of repeated transsphenoidal surgery in Cushing’s disease. Long-term follow-up. Endocrinol Nutr 61 : 176-183, 2014
crossref pmid
39. Wilson CB : A decade of pituitary microsurgery. The Herbert Olivecrona lecture. J Neurosurg 61 : 814-833, 1984
pmid
40. Yamada S, Fukuhara N, Nishioka H, Takeshita A, Inoshita N, Ito J, et al : Surgical management and outcomes in patients with Cushing disease with negative pituitary magnetic resonance imaging. World Neurosurg 77 : 525-532, 2012
crossref pmid

Olfactory Neuroblastoma Causing Cushing’s Syndrome Due to the Ectopic Adrenocorticotropic Hormone (ACTH) Secretion

Abstract

Cushing’s syndrome is a constellation of features occurring due to high blood cortisol levels. We report a case of a 47-year-old male with a history of recurrent olfactory neuroblastoma (ONB). He presented with bilateral lower limb weakness and anosmia and was found to have Cushing’s syndrome due to high adrenocorticotropic hormone (ACTH) levels from an ectopic source, ONB in this case. Serum cortisol and ACTH levels declined after tumor removal.

Introduction

Olfactory neuroblastoma (ONB), or esthesioneuroblastoma, is a rare malignancy arising from neuroepithelium in the upper nasal cavity. It represents approximately 2% of all nasal passage tumors, with an incidence of approximately 0.4 per 2.5 million individuals [1]. ONB shares similar histological features with small round blue cell neoplasms of the nose. Ectopic hormone secretion is a very rare feature associated with these tumors. Five-year overall survival is reported to be between 60% and 80% [2,3]. The age distribution is either in the fifth to sixth decade of life [4,5], or in the second and sixth decades [6].

Features of Cushing’s syndrome (moon face, buffalo hump, central obesity hypertension, fragile skin, easy bruising, fatigue, muscle weakness) are due to high blood cortisol levels [7]. It can be either primary (cortisol-secreting adrenal tumor), secondary (adrenocorticotropic hormone (ACTH)-secreting pituitary tumor, also called Cushing disease), or ectopic ACTH secretion (from a non-pituitary source). All three types share similar features [8].

Ectopic ACTH syndrome (EAS) is due to an extra pituitary tumor, producing ACTH. It accounts for 12-17% of Cushing’s syndrome cases [9]. Most cases of EAS-producing tumors are in the lungs, mediastinum, neuroendocrine tumors of the gastrointestinal tract, and pheochromocytomas [9]. Ectopic ACTH secretion from an ONB is very rare. As of 2015, only 18 cases were reported in the literature [10]. Here, we report such a case.

Case Presentation

Our patient is a 47-year-old Bangladeshi male, with a history of recurrent ONB that was resected twice in the past (transsphenoidal resection in 2016 and 2019) with adjuvant radiotherapy, no chemotherapy was given. He also had diabetes mellitus type 1 (poorly controlled) and hypertension. He presented with bilateral lower limb weakness, anosmia, decreased oral intake, loss of taste for one week, and bilateral submandibular swelling that increased in size gradually over the past two years. There was no history of fever, cough, abdominal pain, or exposure to sick contacts. The patient reported past episodes of similar symptoms, but details are unclear. The patient’s family history is positive for diabetes mellitus type 1 in both parents. Lab tests in the emergency department showed hypokalemia and hyperglycemia as detailed in Table 1. He was admitted for further workup of the above complaints.

Test Patient Results Reference Range Unit Status
Hemoglobin 14.7 13-17 g/dL Normal
White blood cell (WBC) 17.9 4-10 10*9/L High
Neutrophils 15.89 2-7 10*9/L High
Lymphocytes 1.07 1-3 10*9/L Normal
Sodium 141 136-145 mmol/L Normal
Potassium 2.49 3.5-5.1 mmol/L Low (Panic)
Chloride 95 98-107 mmol/L Low
Glucose 6.52 4.11-5.89 mmol/L Elevated
C-reactive protein (CRP) 0.64 Less than 5 mg/L Normal
Erythrocyte sedimentation rate (ESR) 2 0-30 mm/h Normal
Creatinine 73 62-106 µmol/L Normal
Uric acid 197 202.3-416.5 µmol/L Normal
Alanine aminotransferase (ALT) 33.2 0-41 U/L Normal
Aspartate aminotransferase (AST) 18.6 0-40 U/L Normal
International Normalised Ratio (INR) 1.21 0.8-1.2 sec High
Prothrombin time (PT) 15.7 12.3-14.7 sec High
Lactate dehydrogenase (LDH) 491 135-225 U/L High
Thyroid-stimulating hormone (TSH) 0.222 0.27-4.20 mIU/L Low
Adrenocorticotropic hormone (ACTH) 106 ≤50 ng/L Elevated
Cortisol (after dexamethasone suppression) 1750 Morning hours (6-10 am): 172-497 nmol, Afternoon hours (4-8 pm): 74.1-286 nmol nmol/L Elevated (failure of suppression)
24-hour urine cortisol (after dexamethasone suppression) 5959.1 <120 nmol/24 hrs nmol/24hr Elevated (failure of suppression)
Table 1: Results of blood test at the time of hospitalization. Hypokalemia and high values of adrenocorticotropic hormone and cortisol were confirmed.

On examination, the patient’s vital signs were as follows: blood pressure was 154/77 mmHg, heart rate of 60 beats per minute, respiratory rate was 18 breaths per minute, oxygen saturation of 98% on room air, and a temperature of 36.7°C. The patient had a typical Cushingoid appearance with a moon face, buffalo hump, purple striae on the abdomen, central obesity, and hyperpigmentation of the skin. Submandibular lymph nodes were enlarged bilaterally. The examination of the submandibular lymph nodes showed a firm, fixed mass extending from the angle of the mandible to the submental space on the left side. Neurological examination showed weakness in both legs bilaterally (strength 3/5) and anosmia (checked by orthonasal smell test). The rest of the neurological exam was normal.

Laboratory findings revealed (in Table 1) a marked hypokalemia of 2.49 mmol/L and hyperglycemia of 6.52 mmol/L. The serum cortisol level was elevated at 1587 nmol/L. Serum ACTH levels were raised at 106 ng/L (normal value ≤50 ng/L). Moreover, the high-dose dexamethasone suppression test failed to lower the serum ACTH levels and serum and urine cortisol. Serum cortisol level after the suppression test was 1750 nmol/L, while 24-hour urine cortisol after the test was 5959.1 nmol/24hr. Serum ACTH levels after the test also remained high at 100mg/L. This indicated failure of ACTH suppression by high-dose dexamethasone, which points towards ectopic ACTH production. Other blood tests (complete blood count, liver function tests) were insignificant.

A computed tomography scan with contrast (CT scan) of the chest, abdomen, and pelvis, with a special focus on the adrenals, was negative for any malignancy or masses. CT scan of the neck showed bilaterally enlarged submandibular lymph nodes and an enlarged right lobe of the thyroid with nodules. Fine needle aspiration (FNA) of the thyroid nodules revealed a benign nature. Magnetic resonance imaging (MRI) of the brain showed a contrast-enhancing soft tissue lesion (18x18x10mm) in the midline olfactory groove area with extension into the frontal dura and superior sagittal sinus, suggesting recurrence of the previous ONB. There was evidence of previous surgery also. The pituitary gland was normal (Figures 12).

A-brain-MRI-(T1-weighted;-without-contrast;-sagittal-plane)-shows-a-soft-tissue-lesion-located-in-the-midline-olfactory-groove-area.-Dural-surface-with-extension-into-anterior-frontal-dura.
Figure 1: A brain MRI (T1-weighted; without contrast; sagittal plane) shows a soft tissue lesion located in the midline olfactory groove area. Dural surface with extension into anterior frontal dura.

MRI: Magnetic resonance imaging

A-brain-MRI-(T2-weighted;-without-contrast;-axial-plane)-shows-a-soft-tissue-lesion-located-in-the-midline-olfactory-groove-area.
Figure 2: A brain MRI (T2-weighted; without contrast; axial plane) shows a soft tissue lesion located in the midline olfactory groove area.

MRI: Magnetic resonance imaging

Octreotide scintigraphy showed three focal abnormal uptakes in the submandibular cervical nodes. Additionally, there was a moderate abnormal uptake at the midline olfactory groove with bilateral extension (Figure 3).

Whole-body-octreotide-scan-(15-mCi-99mTc-Octreotide-IV)-demonstrates-three-focal-abnormal-uptakes:-the-largest-(5.2-x-2.4-cm)-in-the-left-submandibular-region,-and-two-smaller-ones-on-the-right,-suggestive-of-lymph-node-uptake.-Additional-abnormal-uptake-was-seen-along-the-midline-of-the-olfactory-groove-region-with-bilateral-extension.-No-other-significant-abnormal-uptake-was-identified.
Figure 3: Whole-body octreotide scan (15 mCi 99mTc-Octreotide IV) demonstrates three focal abnormal uptakes: the largest (5.2 x 2.4 cm) in the left submandibular region, and two smaller ones on the right, suggestive of lymph node uptake. Additional abnormal uptake was seen along the midline of the olfactory groove region with bilateral extension. No other significant abnormal uptake was identified.

On microscopic examination, an excisional biopsy after the transcranial resection surgery of the frontal skull base tumor showed nests and lobules of round to oval cells with clear cytoplasm, separated by vascular and hyalinized fibrous stroma (Figures 4A4B). Tumor cells show mild to moderate nuclear pleomorphism, and fine chromatin (Figure 4C). A fibrillary neural matrix is also present. Some mitotic figures can be seen. Immunohistochemical stains revealed positive staining for synaptophysin (Figure 4D) and chromogranin (Figure 4E). Stains for CK (AE1/AE3), CD45, Desmin, and Myogenin are negative. Immunostaining for ACTH was focally positive (Figure 4F), while the specimen of the cervical lymph nodes showed the same staining, indicating metastases. The cytomorphologic and immunophenotypic features observed are consistent with a Hyams grade II ONB, with ectopic ACTH production.

Histopathological-and-immunohistochemical-findings-of-olfactory-neuroblastoma.
Figure 4: Histopathological and immunohistochemical findings of olfactory neuroblastoma.

A (100x magnification) and B (200x magnification) – hematoxylin and eosin (H-E) staining shows cellular nests of round blue cells separated by hyalinized stroma. C (400x magnification) – nuclei show mild to moderate pleomorphism with fine chromatin. D (100x magnification) – an immunohistochemical stain for synaptophysin shows diffuse, strong cytoplasmic positivity within tumor cells. E (200x magnification) – tumor cells are positive for chromogranin. F (400x magnification) – ACTH cytoplasmic expression in tumor cells.

ACTH: adrenocorticotropic hormone

For his resistant hypokalemia, he had to be given intravenous (IV) and oral potassium chloride (KCL) repeatedly. The patient underwent transcranial resection of the frontal skull base tumor. The patient received cefazolin for seven days, and hydrocortisone for four days. After transcranial resection, his cortisol level decreased to 700 nmol/L. Furthermore, ACTH dropped, and serum potassium also normalized. Subsequently, the patient was transferred to the intensive care unit (ICU) for meticulous monitoring and continued care. In the ICU, the patient developed one episode of a generalized tonic-clonic seizure, which aborted spontaneously, and the patient received phenytoin and levetiracetam to prevent other episodes. A right-sided internal jugular vein and left transverse sinus thrombosis were also developed and treated with enoxaparin sodium. Following surgery, his low potassium levels improved, resulting in an improvement in his limb weakness. His other symptoms also gradually improved after surgery. Three weeks following the primary tumor resection, he underwent bilateral neck dissection with right hemithyroidectomy, for removal of the metastases. The patient opted out of chemotherapy and planned for an international transfer to his home country for further management. Other treatments that he received during hospitalization were ceftriaxone, azithromycin, and Augmentin®. Insulin was used to manage his diabetes, perindopril to regulate his blood pressure, and spironolactone to increase potassium retention. Omeprazole was administered to prevent GI bleeding and heartburn/gastroesophageal reflux disease relief after discharge.

Discussion

ONB was first described in 1924, and it is a rare neuroectodermal tumor that accounts for 2% of tumors affecting the nasal cavity [11]. Even though ONB has a good survival rate, long-term follow-up is necessary due to the disease’s high recurrence rate [2]. ONB recurrence has been approximated to range between 30% and 60% after successful treatment of the primary tumor [12]. Recurrent disease is usually locoregional and tends to have a long interval to relapse with a mean of six years [12]. The first reported case of ectopic ACTH syndrome caused by ONB was in 1987 by M Reznik et al., who reported a 48-year-old woman with ONB who developed a Cushing-like syndrome 28 months before her death [13].

The occurrence of Cushing’s syndrome due to ectopic ACTH can occur either in the initial tumor or even years later during its course or after recurrence [3,6,9,14]. Similar to the case of Abe et al. [3], our patient also presented with muscle weakness due to hypokalemia, which is a feature of Cushing’s syndrome. Hypokalemia is present at diagnosis in 64% to 86% of cases of EAS and is resistant to treatment [9,14], as seen in our case. In our patient, the exact time of development of Cushing’s syndrome could not be ascertained due to the non-availability of previous records. However, according to the patient, he started developing abdominal obesity, pigmentation, and buffalo hump in 2021 about two years after his second surgery for ONB.

The distinction between pituitary ACTH and ectopic ACTH involves utilizing CT/MRI of the pituitary, corticotropin-releasing hormone (CRH) stimulation test with petrosal sinus blood sampling, high dose dexamethasone suppression test, and checking serum K+ (more commonly low in ectopic ACTH) [2,15,16]. In our case, a CRH stimulation test was not available but CT/MRI brain, dexamethasone test, low serum potassium, plus the postoperative fall in cortisol levels, all pointed towards an ectopic ACTH source.

Conclusions

In conclusion, this case highlights the rare association between ONB and ectopic ACTH syndrome, which developed after tumor recurrence. The patient’s unique presentation of bilateral lower limb weakness and hypokalemia can cause diagnostic challenges, emphasizing the need for comprehensive diagnostic measures. Surgical intervention proved crucial, with postoperative cortisol values becoming normal, highlighting the efficacy of this approach. The occurrence of ectopic ACTH production in ONB patients, although very rare, is emphasized, so that healthcare professionals who deal with these tumors are aware of this complication. This report contributes valuable insights shedding light on the unique ONB manifestation causing ectopic ACTH syndrome. The ongoing monitoring of the patient’s clinical features will further enrich the understanding of the course of this uncommon phenomenon in the medical literature.

References

  1. Thompson LD: Olfactory neuroblastoma. Head Neck Pathol. 2009, 3:252-9. 10.1007/s12105-009-0125-2
  2. Abdelmeguid AS: Olfactory neuroblastoma. Curr Oncol Rep. 2018, 20:7. 10.1007/s11912-018-0661-6
  3. Abe H, Suwanai H, Kambara N, et al.: A rare case of ectopic adrenocorticotropic hormone syndrome with recurrent olfactory neuroblastoma. Intern Med. 2021, 60:105-9. 10.2169/internalmedicine.2897-19
  4. Yin Z, Wang Y, Wu Y, et al.: Age distribution and age-related outcomes of olfactory neuroblastoma: a population-based analysis. Cancer Manag Res. 2018, 10:1359-64. 10.2147/CMAR.S151945
  5. Platek ME, Merzianu M, Mashtare TL, Popat SR, Rigual NR, Warren GW, Singh AK: Improved survival following surgery and radiation therapy for olfactory neuroblastoma: analysis of the SEER database. Radiat Oncol. 2011, 6:41. 10.1186/1748-717X-6-41
  6. Elkon D, Hightower SI, Lim ML, Cantrell RW, Constable WC: Esthesioneuroblastoma. Cancer. 1979, 44:3-1087. 10.1002/1097-0142(197909)44:3<1087::aid-cncr2820440343>3.0.co;2-a
  7. Nieman LK, Biller BM, Findling JW, Newell-Price J, Savage MO, Stewart PM, Montori VM: The diagnosis of Cushing’s syndrome: an Endocrine Society Clinical Practice Guideline. J Clin Endocrinol Metab. 2008, 93:1526-40. 10.1210/jc.2008-0125
  8. Chabre O: Cushing syndrome: physiopathology, etiology and principles of therapy [Article in French]. Presse Med. 2014, 43:376-92. 10.1016/j.lpm.2014.02.001
  9. Isidori AM, Lenzi A: Ectopic ACTH syndrome. Arq Bras Endocrinol Metabol. 2007, 51:1217-25. 10.1590/s0004-27302007000800007
  10. Kunc M, Gabrych A, Czapiewski P, Sworczak K: Paraneoplastic syndromes in olfactory neuroblastoma. Contemp Oncol (Pozn). 2015, 19:6-16. 10.5114/wo.2015.46283
  11. Finlay JB, Abi Hachem R, Jang DW, Osazuwa-Peters N, Goldstein BJ: Deconstructing olfactory epithelium developmental pathways in olfactory neuroblastoma. Cancer Res Commun. 2023, 3:980-90. 10.1158/2767-9764.CRC-23-0013
  12. Ni G, Pinheiro-Neto CD, Iyoha E, et al.: Recurrent esthesioneuroblastoma: long-term outcomes of salvage therapy. Cancers (Basel). 2023, 15:1506. 10.3390/cancers15051506
  13. Reznik M, Melon J, Lambricht M, Kaschten B, Beckers A: Neuroendocrine tumor of the nasal cavity (esthesioneuroblastoma). Apropos of a case with paraneoplastic Cushing’s syndrome [Article in French]. Ann Pathol. 1987, 7:137-42.
  14. Kadoya M, Kurajoh M, Miyoshi A, et al.: Ectopic adrenocorticotropic hormone syndrome associated with olfactory neuroblastoma: acquirement of adrenocorticotropic hormone expression during disease course as shown by serial immunohistochemistry examinations. J Int Med Res. 2018, 46:4760-8. 10.1177/0300060517754026
  15. Clotman K, Twickler MTB, Dirinck E, et al.: An endocrine picture in disguise: a progressive olfactory neuroblastoma complicated with ectopic Cushing syndrome. AACE Clin Case Rep. 2017, 3:278-83. 10.4158/EP161729.CR
  16. Chung YS, Na M, Ku CR, Kim SH, Kim EH: Adrenocorticotropic hormone-secreting esthesioneuroblastoma with ectopic Cushing’s syndrome. Yonsei Med J. 2020, 61:257-61. 10.3349/ymj.2020.61.3.257

From https://www.cureus.com/articles/226080-olfactory-neuroblastoma-causing-cushings-syndrome-due-to-the-ectopic-adrenocorticotropic-hormone-acth-secretion-a-case-report?score_article=true#!/