Concurrent Mutations of Germline GPR101 and Somatic USP8 in a Pediatric Giant Pituitary ACTH Adenoma

Abstract

Background

Cushing’s disease (CD) is rare in pediatric patients. It is characterized by elevated plasma adrenocorticotropic hormone (ACTH) from pituitary adenomas, with damage to multiple systems and development. In recent years, genetic studies have shed light on the etiology and several mutations have been identified in patients with CD.

Case presentation

A girl presented at the age of 10 years and 9 months with facial plethora, hirsutism and acne. Her vision and eye movements were impaired. A quick weight gain and slow growth were also observed. Physical examination revealed central obesity, moon face, buffalo hump, supra-clavicular fat pads and bruising. Her plasma ACTH level ranged between 118 and 151 pg/ml, and sella enhanced MRI showed a giant pituitary tumor of 51.8 × 29.3 × 14.0 mm. Transsphenoidal pituitary debulk adenomectomy was performed and immunohistochemical staining confirmed an ACTH-secreting adenoma. Genetic analysis identified a novel germline GPR101 (p.G169R) and a somatic USP8 (p. S719del) mutation. They were hypothesized to impact tumor growth and function, respectively.

Conclusions

We reported a rare case of pediatric giant pituitary ACTH adenoma and pointed out that unusual concurrent mutations might contribute to its early onset and large volume.

Peer Review reports

Background

Cushing’s disease (CD) is caused by the overproduction of adrenocorticotropic hormone (ATCH) by pituitary adenomas (PAs). It is rare in children and accounts for approximately 75% of pediatric Cushing’s syndrome from 7 to 17 years of age [1]. Weight gain and facial changes are more common in children than in adults [2]. Growth retardation is also a characteristic of children with hypercortisolemia [3]. Genetic alterations such as somatic USP8RASD1TP53 mutations, and germline AIPMEN1, and CABLES1 mutations have been identified in CD patients [4]. Here we report a case of pediatric invasive pituitary ACTH macroadenoma associated with a novel germline GPR101 (p. G169R) and a somatic USP8 (p. S719del) mutation.

Case presentation

The girl was born at full term with a length of 48 cm and a weight of 2900 g. Her neuromotor and cognitive development was comparable to those of children of the same age. At the age of 9 years and 4 months she developed plethora, hirsutism, facial acne, rapid weight gain, and increased abdominal circumference. Her skin darkened, and purple striae appeared on thighs and in the armpits. She became dull and less talkative, as indicated by her parents. At 10 years and 3 months, the patient complained of pain around the left orbit with an intensity of 4–5 points on a numerical rating scale (NRS). Five months later bilateral blepharoptosis appeared, with significantly impaired vision of the left eye. Soon both eyes failed to rotate in all directions.

On admission the patient was 10 years and 9 months, with a height of 144 cm (90–97th percentile) and a weight of 48 kg (25–50th percentile). Her weight gain was 20 kg, while the height increased by only 2–3 cm in 18 months. Her blood pressure was 115/76mmHg, and her heart rate was 80 bpm. Apart from the signs mentioned above, physical examination revealed central obesity (BMI 23.1 kg/m2), moon face, buffalo hump, supra-clavicular fat pads and bruising at the left fossa cubitalis. Her pupils were 7 mm in diameter and barely reacted to light. There was a fan-shaped visual field defect in the left eye. Her breasts were Tanner stage III and pubic hair was Tanner stage II, although menarche had not yet occurred. The parents and her younger brother at 6 years of age did not have symptoms related to Cushing syndrome, acromegaly or gigantism. There was no family history of pituitary tumor or other endocrine tumors.

She had increased midnight serum cortisol (24.35 µg/dL, normal range < 1.8 µg/mL) and 24-hour urine free cortisol (24hUFC) (308.0 µg, normal range 12.3–103.5). The plasma ACTH level ranged from 118 to 151 pg/mL (< 46pg/mL). The 24hUFC was not suppressed (79.2 µg) after 48 h low-dose dexamethasone suppression test (LDDST), but suppressed to 32.8 µg (suppression rate 89.4%) after 48 h high-dose dexamethasone. Sella enhanced MRI showed a giant pituitary tumor measured 51.8 × 29.3 × 14.0 mm with heterogeneous density (Fig. 1). The mass compressed the optic chiasma and surrounded the bilateral cavernous sinus (Knosp 4). Therefore, an invasive giant pituitary ACTH adenoma was clinically diagnosed. The morning growth hormone (GH) was 1.0ng/ml (< 2 ng/ml) and insulin-like growth factor 1 416 ng/ml (88–452 ng/ml). The prolactin (PRL), luteinizing hormone (LH), follicle-stimulating hormone (FSH) and thyroid stimulating hormone (TSH) were all in normal ranges, as well as serum sodium, potassium, blood glucose and urine osmolality. Abdominal ultrasonography revealed a fatty liver. Tests concerning type 1 multiple endocrine neoplasia included serum calcium, phosphate, parathyroid hormone, gastrin and glucagon, which were all unremarkable (Table 1).

Fig. 1

figure 1

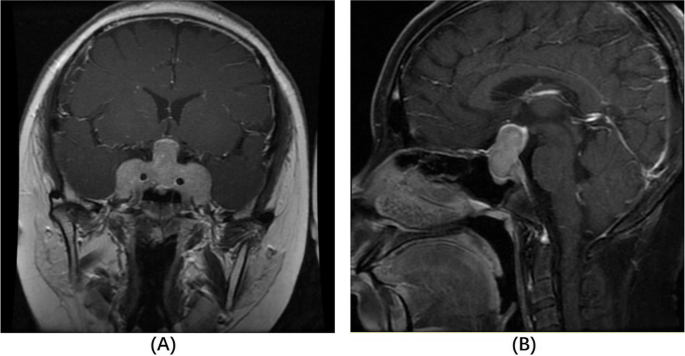
Contrast-enhanced coronal (A) and sagittal (B) T1-weighted MRI on admission. The sellar mass measured 51.8 × 29.3 × 14.0 cm (TD × VD × APD) with a heterogeneous density in the enhanced scan. The diaphragma sellea was dramatically elevated, with optic chiasm compressed. The sellar floor was sunken and bilateral cavernous sinus was surrounded (Knosp 4)

Table 1 Laboratory data on admission

Transsphenoidal pituitary debulk adenomectomy was performed immediately due to multiple cranial nerve involvement and the negative results of Sandostatin loading test. A decompression resection was done. The plasma ACTH level declined to 77 pg/ml and serum cortisol 30.2 µg/dl three days after the operation. Vision, pupil dilation, eye movements and blepharoptosis also partially improved. Histopathology and immunohistochemical staining confirmed a densely–granulated corticotroph adenoma (Fig. 2, NanoZoomer S360 digital slide scanner and NDP.view 2.9.25 software, Hamamatsu, Japan). Neither necrosis nor mitotic activity was observed. The immunostaining for somatostatin receptor SSTR2A was positive with a cytoplasmic pattern, while GH, PRL, TSH, FSH, LH and PIT were all negative. The Ki 67 index was found to be 10%. One month after the operation the ACTH level increased to 132 pg/mL again, and the parents agreed to refer their child for radiotherapy to control the residual tumor.

Fig. 2

figure 2

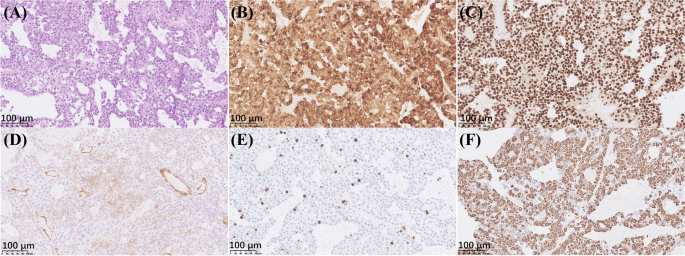
Histopathology and immunohistochemistry staining results of the pituitary tumor. By light microscopy, the tumor cells were mostly basophilic and arranged in papillary architecture. Neither necrosis nor mitotic activity was observed (A hematoxylin-eosin, ×200). Immunohistochemistry staining was positive for ACTH (B immunoperoxidase, ×200) and transcription factor T-PIT (C immunoperoxidase, ×200). Cytoplasmic staining of SSTR2A was observed in around 1/3 tumor cells besides the strong staining of endothelial cells (D immunoperoxidase, ×200). The Ki-67 index was 10% (E immunoperoxidase, ×200). Cytokeratin CAM5.2 was diffusely positive in the cytoplasm (F immunoperoxidase, ×200). The positive control for ACTH and T-PIT was the human anterior pituitary gland, and for SSRT2, Ki-67 and CAM5.2 were cerebral cortex, tonsil and colonic mucosa, respectively

The early onset and invasive behavior of this tumor led to the consideration of whether there was a genetic defect. Genetic studies were recommended for the families and they all agreed and signed the written informed consent forms. Whole exome sequencing (WES) was performed on the patient’s blood sample using an Illumina HiSeq sequencer to an average read depth of at least 90 times per individual. Raw sequence files were mapped to the GRCH37 human reference genome and analyzed using the Sentieon software. The results revealed a germline heterozygous GPR101 gene mutation c.505G > C (p.Gly169Arg), which was subsequently confirmed to be of maternal origin by Sanger sequencing. Meanwhile WES of the tumor tissue identified an additional somatic heterozygous c.2155_2157delTCC (p.S719del) mutation of the USP8 gene .

Discussion and conclusions

In this report, we described an extremely giant and invasive pituitary ACTH adenoma in a 10-year-old girl. According to Trouillas et al., invasive and proliferative pituitary tumors have a poor prognosis [5]. CD is rare among children, and the fast-growing and invasive nature of the tumor in this case led to the investigation of genetic causes. The somatic USP8 gene mutation has been recently reported to be associated with the pathogenesis of CD [67]. This gene encodes ubiquitin-specific protease 8 (USP8). S718, S719 and P720 are hotspots in different studies [6,7,8,9,10,11,12,13,14]. They are located at the 14-3-3 binding motif, and the mutations disrupt the binding between USP8 and 14-3-3 protein, which leads to increased deubiquitination and EGFR signaling. High levels of EGFR consequently trigger proopiomelanocortin (POMC) transcription and ACTH secretion [67]. The p.S719del mutation has been previously reported and its pathogenicity has been confirmed [7]. Thus, we speculate the p.S719del mutation plays a role in this patient with CD.

It is noteworthy that in our case, the pituitary corticotrophin adenoma was extremely giant and bilaterally invasive. USP8 mutations have been found in 31% of pediatric CD patients [10]. It is well known that microadenomas are most common in adult and pediatric CD patients. Previously, the Chinese and Japanese cohorts observed smaller sizes of USP8-mutated PAs than wild-type PAs [79]. The Chinese cohort also reported a lower rate of invasive adenomas in USP8-mutated PAs [7]. This may be explained by the finding that UPS8 mutations did not significantly promote cell proliferation more than the wild-type ones [6]. Other cohorts suggested no difference in tumor size or invasiveness between USP8-mutated and wild-type PAs [81012,13,14], which may be partially explained by the differences in sample sizes and ethnic backgrounds. Owing to the lack of evidence of USP8 mutations significantly contributing to tumor growth and invasiveness, additional pathogenesis should be investigated in this case.

The p.Gly169Arg mutation of the GPR101 gene has not been reported in patients with pituitary tumors. In silico predictions were performed using Polyphen-2, Mutation Taster and PROVEAN, and all of the programs reported it to be pathogenic. The GPR101 gene encodes an orphan G protein-coupled receptor (GPCR) and microduplication encompassing the gene has been proven to be the cause of X-linked acrogigantism (XLAG) [15]. XLAG is characterized by the early onset of pituitary GH-secreting macroadenomas. Point mutations of GPR101 have been found in patients with PAs that are mostly GH-secreting [15,16,17]. Although their prevalence is very low, an in vitro study supported the pathogenic role of p.E308D, the most common mutation of GPR101. This led to increased cell proliferation and GH production in rat pituitary GH3 cells [15]. Rare cases of PRL, ACTH or TSH-secreting PAs with GPR101 variants were also documented [1618]. To date, there have been five cases of ACTH-secreting PAs with four different germline GPR101 mutations: two cases of p.E308D, p.I122T, p.T293I and p.G31S, although in silico predictions and in vitro evaluations using AtT-20 cells have respectively determined the latter two mutations to be non-pathogenic [1618]. These patients were mainly children and young adults. Unlike pituitary GH-secreting tumors, the role of GPR101 mutations in the pathophysiology of CD is still questionable. Trivellin et al. demonstrated no statistically significant difference in GPR101 expression between corticotropinomas and normal human pituitaries. No significant correlation between GPR101 and POMC expression levels was found neither [18].

Given the evidences above, we hypothesize that the somatic USP8 mutation is responsible for the overexpression of ACTH in this CD girl while the germline GPR101 mutation contributes to the early onset and fast-growing nature of the tumor. Similarly, a 27-year-old woman with Nelson’s syndrome originally considered to be associated with a germline AIP variant (p.Arg304Gln) was recently reported to have a somatic USP8 mutation. The patient progressed rapidly and underwent multiple transsphenoidal surgeries [19]. Since germline AIP mutations are more commonly seen in GH-secreting PAs [20], the authors proposed that the USP8 mutation might have shifted the tumor towards ACTH-secreting [19]. Further investigations into the pathogenicity of GPR101 p.Gly169Arg and AIP p.Arg304Gln mutations are required to support the hypothesis.

In summary, we report a novel germline GPR101 and somatic USP8 mutation in a girl with an extremely giant pituitary ACTH adenoma. The concurrent mutations may lead to the growth and function of the tumor, respectively. Further investigations should be carried out to verify the role of the concurrent mutations in the pathogenesis of pediatric CD.

Availability of data and materials

The WES data of the blood sample of the patient is available in the NGDC repository (https://ngdc.cncb.ac.cn/gsa-human/) and the accession number is HRA002396. Any additional information is available from the authors upon reasonable request.

Abbreviations

CD:
Cushing’s disease
ACTH:
adrenocorticotropic hormone
PA:
pituitary adenoma
NRS:
numerical rating scale
24hUFC:
24-hour urine free cortisol
LDDST:
low-dose dexamethasone suppression test
USP8:
ubiquitin-specific protease 8
POMC:
proopiomelanocortin
GPCR:
G protein-coupled receptor
XLAG:
X-linked acrogigantism

References

  1. Weber A, Trainer PJ, Grossman AB, Afshar F, Medbak S, Perry LA, et al. Investigation, management and therapeutic outcome in 12 cases of childhood and adolescent Cushing’s syndrome. Clin Endocrinol (Oxf). 1995;43(1):19–28.

    CAS Article Google Scholar

  2. Storr HL, Alexandraki KI, Martin L, Isidori AM, Kaltsas GA, Monson JP, et al. Comparisons in the epidemiology, diagnostic features and cure rate by transsphenoidal surgery between paediatric and adult-onset Cushing’s disease. Eur J Endocrinol. 2011;164(5):667–74.

    CAS Article Google Scholar

  3. Magiakou MA, Mastorakos G, Oldfield EH, Gomez MT, Doppman JL, Cutler GB Jr, et al. Cushing’s syndrome in children and adolescents. Presentation, diagnosis, and therapy. N Engl J Med. 1994;331(10):629–36.

    CAS Article Google Scholar

  4. Hernández-Ramírez LC, Stratakis CA. Genetics of Cushing’s Syndrome. Endocrinol Metab Clin North Am. 2018;47(2):275–97.

    Article Google Scholar

  5. Trouillas J, Roy P, Sturm N, Dantony E, Cortet-Rudelli C, Viennet G, et al. A new prognostic clinicopathological classification of pituitary adenomas: a multicentric case-control study of 410 patients with 8 years post-operative follow-up. Acta Neuropathol. 2013;126(1):123–35.

    Article Google Scholar

  6. Reincke M, Sbiera S, Hayakawa A, Theodoropoulou M, Osswald A, Beuschlein F, et al. Mutations in the deubiquitinase gene USP8 cause Cushing’s disease. Nat Genet. 2015;47(1):31–8.

    CAS Article Google Scholar

  7. Ma Z-Y, Song Z-J, Chen J-H, Wang Y-F, Li S-Q, Zhou L-F, et al. Recurrent gain-of-function USP8 mutations in Cushing’s disease. Cell Res. 2015;25(3):306–17.

    CAS Article Google Scholar

  8. Perez-Rivas LG, Theodoropoulou M, Ferrau F, Nusser C, Kawaguchi K, Stratakis CA, et al. The Gene of the Ubiquitin-Specific Protease 8 Is Frequently Mutated in Adenomas Causing Cushing’s Disease. J Clin Endocrinol Metab. 2015;100(7):E997–1004.

    CAS Article Google Scholar

  9. Hayashi K, Inoshita N, Kawaguchi K, Ibrahim Ardisasmita A, Suzuki H, Fukuhara N, et al. The USP8 mutational status may predict drug susceptibility in corticotroph adenomas of Cushing’s disease. Eur J Endocrinol. 2016;174(2):213–26.

    CAS Article Google Scholar

  10. Faucz FR, Tirosh A, Tatsi C, Berthon A, Hernandez-Ramirez LC, Settas N, et al. Somatic USP8 Gene Mutations Are a Common Cause of Pediatric Cushing Disease. J Clin Endocrinol Metab. 2017;102(8):2836–43.

    Article Google Scholar

  11. Albani A, Perez-Rivas LG, Dimopoulou C, Zopp S, Colon-Bolea P, Roeber S, et al. The USP8 mutational status may predict long-term remission in patients with Cushing’s disease. Clin Endocrinol (Oxf). 2018;89:454–8.

    CAS Article Google Scholar

  12. Ballmann C, Thiel A, Korah HE, Reis AC, Saeger W, Stepanow S, et al. USP8 Mutations in Pituitary Cushing Adenomas-Targeted Analysis by Next-Generation Sequencing. J Endocr Soc. 2018;2(3):266–78.

    CAS Article Google Scholar

  13. Losa M, Mortini P, Pagnano A, Detomas M, Cassarino MF, Pecori Giraldi F. Clinical characteristics and surgical outcome in USP8-mutated human adrenocorticotropic hormone-secreting pituitary adenomas. Endocrine. 2019;63(2):240–6.

    CAS Article Google Scholar

  14. Weigand I, Knobloch L, Flitsch J, Saeger W, Monoranu CM, Hofner K, et al. Impact of USP8 Gene Mutations on Protein Deregulation in Cushing Disease. J Clin Endocrinol Metab. 2019;104(7):2535–46.

    Article Google Scholar

  15. Trivellin G, Daly AF, Faucz FR, Yuan B, Rostomyan L, Larco DO, et al. Gigantism and acromegaly due to Xq26 microduplications and GPR101 mutation. N Engl J Med. 2014;371(25):2363–74.

    CAS Article Google Scholar

  16. Lecoq AL, Bouligand J, Hage M, Cazabat L, Salenave S, Linglart A, et al. Very low frequency of germline GPR101 genetic variation and no biallelic defects with AIP in a large cohort of patients with sporadic pituitary adenomas. Eur J Endocrinol. 2016;174(4):523–30.

    CAS Article Google Scholar

  17. Iacovazzo D, Caswell R, Bunce B, Jose S, Yuan B, Hernández-Ramírez LC, et al. Germline or somatic GPR101 duplication leads to X-linked acrogigantism: a clinico-pathological and genetic study. Acta Neuropathol Commun. 2016;4(1):56.

    Article Google Scholar

  18. Trivellin G, Correa RR, Batsis M, Faucz FR, Chittiboina P, Bjelobaba I, et al. Screening for GPR101 defects in pediatric pituitary corticotropinomas. Endocr Relat Cancer. 2016;23(5):357–65.

    CAS Article Google Scholar

  19. Perez-Rivas LG, Theodoropoulou M, Puar TH, Fazel J, Stieg MR, Ferrau F, et al. Somatic USP8 mutations are frequent events in corticotroph tumor progression causing Nelson’s tumor. Eur J Endocrinol. 2018;178(1):57–63.

    CAS Article Google Scholar

  20. Tatsi C, Stratakis CA. The Genetics of Pituitary Adenomas. J Clin Med. 2019;9(1).

Download references

Acknowledgements

We thanked Dr. Xiaohua Shi and Dr. Yu Xiao from the Department of Pathology, Peking Union Medical College Hospital for their expertise in pituitary pathology and critical help in accomplishment of our manuscript.

Funding

This research was supported by “The National Key Research and Development Program of China” (No. 2016YFC0901501), “CAMS Innovation Fund for Medical Science” (CAMS-2017-I2M–1–011). They mainly covered the fees for genetic analysis and publications.

Author information

Authors and Affiliations

  1. Department of Pediatrics, Peking Union Medical College Hospital, Chinese Academy of Medical Science and Peking Union Medical College, Beijing, 100730, China

    Xu-dong Bao

  2. Department of Endocrinology, Key Laboratory of Endocrinology of National Health Commission, Peking Union Medical College Hospital, Chinese Academy of Medical Science and Peking Union Medical College, Beijing, 100730, China

    Lin Lu, Hui-juan Zhu, Xiao Zhai, Yong Fu, Feng-ying Gong & Zhao-lin Lu

  3. Department of Neurosurgery, Peking Union Medical College Hospital, Chinese Academy of Medical Science and Peking Union Medical College, Beijing, 100730, China

    Yong Yao, Ming Feng & Ren-zhi Wang

Contributions

XB and LL contributed to the study design and manuscript writing. HZ and FG performed genetic analysis. XZ and YF collected the clinical data. YY, MF and RW provided the tumor tissue and histopathology data. ZL revised the manuscript. All authors have read and approved the final manuscript.

Corresponding author

Correspondence to Lin Lu.

Ethics declarations

Ethics approval and consent to participate

This study was approved by the Ethics Committee of Peking Union Medical College Hospital. The parents of the patient provided written informed consent for research participation.

Consent for publication

The parents of the patient provided written informed consent for the publication of indirectly identifiable data in this research.

Competing interests

The authors declare that they have no competing interests.

Additional information

Publisher’s note

Springer Nature remains neutral with regard to jurisdictional claims in published maps and institutional affiliations.

Results Reinforce Efficacy of Recordati’s Isturisa in Cushing’s Disease

Recordati Rare Diseases, a US biopharma that forms part of the wider Italian group, has presented multiple positive data sets on Isturisa (osilodrostat) at the annual ENDO 2022 meeting in Atlanta, Georgia.

Isturisa is a cortisol synthesis inhibitor indicated for the treatment of adult patients with Cushing’s disease for whom pituitary surgery is not an option or has not been curative.

Among the data presented, the Phase III LINC 4 study demonstrated that Isturisa maintained normal mean urinary free cortisol long-term in patients with Cushing’s disease while the Phase III LINC 3 study found adrenal hormone levels changed during early treatment with the drug while stabilizing during long-term treatment.

The ILLUSTRATE study also showed patients treated with a prolonged titration interval tended to have greater persistence with therapy.

Mohamed Ladha, president and general manager for North America, Recordati Rare Diseases, said: “The data from these studies reinforces the efficacy and safety of Isturisa as a treatment for patients with Cushing’s disease.

“We are pleased to share these data with the endocrine community and are excited to provide patients with a much-needed step forward in the management of this rare, debilitating, and potentially life-threatening condition.”

Cushing’s disease is a rare, serious illness caused by a pituitary tumor that leads to overproduction of cortisol by the adrenal glands. Excess cortisol can contribute to an increased risk of morbidity and mortality. Treatment for the condition seeks to lower cortisol levels to a normal range.

Isturisa, which was approved by the US Food and Drug Administration in March 2020, works by inhibiting 11-beta-hydroxylase, an enzyme responsible for the final step of cortisol biosynthesis in the adrenal gland.

From https://www.thepharmaletter.com/article/results-reinforce-efficacy-of-recordati-s-isturisa-in-cushing-s-disease

Altered Hippocampal Volume and Functional Connectivity in Patients with Cushing’s Disease

Abstract

Introduction

Stress-related brain disorders can be associated with glucocorticoid disturbance and hippocampal alteration. However, it remains largely unknown how cortisol affects the structure and function of hippocampus. Cushing’s disease (CD) provides a unique “hyperexpression model” to explore the effects of excessive cortisol on hippocampus as well as the relation between these effects and neuropsychological deficits.

Methods

We acquired high-resolution T1-weighted and resting-state functional magnetic resonance imaging in 47 CD patients and 53 healthy controls. We obtained the volume and functional connectivity of the hippocampal rostral and caudal subregions in both groups. Relationships between hippocampal alterations, neuroendocrine, and neuropsychological assessments were identified.

Results

Relative to control subjects, the CD patients had smaller volumes of all four hippocampal subregions. Furthermore, whole brain resting-state functional connectivity analyses with these four different hippocampal regions as seeds revealed altered hippocampal functional connectivity with high-order networks, involving the DMN, frontoparietal, and limbic networks in CD patients. The intrinsic hippocampal functional connectivity was associated with the quality of life of the CD patients.

Conclusions

Our findings elucidate the cumulative effect of excess cortisol on the morphology and function of hippocampus and reinforce the need for effective interventions in stress-related brain disease to halt potential hippocampal damage.

1 INTRODUCTION

Converging evidence has pointed to a strong linkage between the cortisol and human brain and stress-related neuropsychiatry disorders, such as major depression disorder and posttraumatic stress disorder (de Kloet et al., 2005). However, it remains to be established how this stress hormone influences specific brain structures and functions, particularly in humans, which is of particular importance for both treatment of stress-related disorders and research on cortisol effects in the brain.

Cushing’s disease (CD) is caused by an adrenocorticotropic hormone pituitary adenoma and characterized by chronic hypercortisolism. This condition is therefore a unique and natural “hyperexpression model” to investigate the chronic effects of cortisol on brain physiology and cognition (Zhang et al., 2021). By applying multimodal neuroimaging techniques to CD patients, previous studies have observed that chronic hypercortisolism could cause a number of abnormalities in various brain phenotypes. Among these neural changes of CD patients, hippocampal anomalies are the most replicated findings. Studies on CD patients report hippocampal changes that converge with morphologic alterations such as reduction in volume (Burkhardt et al., 2015; Toffanin et al., 2011). Moreover, abnormal cerebral blood flow and glucose metabolism in hippocampus have also been found in CD patients. Both structural and functional alterations in the hippocampus might contribute to the psychotic symptoms in CD patients (Frimodt-Møller et al., 2019). However, it is well established that psychosis is better described as a brain connectional diaschisis rather than isolated regional dysfunctions (Matthews & Hampshire, 2016). These current hippocampus-related findings were mainly obtained by voxel-based or regional analyses of brain volume or metabolism properties, and researchers have not determined whether the organizational patterns of hippocampal functional connectivity are disrupted in CD patients.

The hippocampus is easily targeted by long-term hypercortisolism because this area is a part of the stress response system and is abundant in mineralocorticoid receptors and glucocorticoid receptors (McEwen et al., 2016). Also recently, studies on macaques and humans have observed that hippocampus is an anatomically and functionally heterogeneous region along the rostral/caudal-dorsal/ventral axis (Schultz & Engelhardt, 2014). Specifically, the rostral hippocampus has connections with prefrontal regions and relates to stress, emotion, and affect. In contrast, the caudal hippocampus mainly connects to sensory cortical areas and performs primarily cognitive functions (Fanselow & Dong, 2010). Therefore, the hippocampus should be studied in a set of separate structures with rostral and caudal hippocampus. Whether the hippocampal subregions exhibit differentially altered connectivity patterns responding to chronic hypercortisolism remains largely unknown.

The present study further extends this work by examining the relationship between hippocampal subregions and resting-state functional connectivity in large-scale brain networks, as measured by resting-state fMRI (rs-fMRI) (Park & Friston, 2013). We focus on default mode network (DMN), frontoparietal, and limbic networks, given their involvement in stress related psychiatric illnesses. The first is the DMN, which supports self-related cognitive functions. Complementing the DMN is the frontoparietal network, which supports the cognitive regulation of behavior and emotion. Finally, the limbic networks play a key role in emotion regulation.

In this study, first, to explore the structural changes of hippocampal subregions in CD patients, we performed a volumetric MRI analysis of the four subregions (left rostral hippocampus, left caudal hippocampus, right rostral hippocampus, and right caudal hippocampus). Given the known direct neurotoxic effects of cortisol on hippocampus, we predicted that chronic hypercortisolism caused smaller hippocampal volumes in CD patients. Second, we used these four subregions as seed regions separately and mapped whole-brain functional connectivity patterns associated with each subregion to examine alterations in hippocampal functional connectivity in CD patients. Considering the psychiatric symptoms in CD patients, it is reasonable to expect the presence of altered hippocampal functional connectivity with high-order networks.

2 MATERIAL AND METHODS

2.1 Participants

A total of 47 participants with a diagnosis of CD and 53 healthy control (HC) subjects were included in this study. The CD patients underwent transsphenoidal surgery at the Department of Neurosurgery, The First Medical Center of Chinese People’s Liberation Army (PLA) General Hospital between May 2017 and November 2019. According to the clinical practice guideline (Nieman et al., 2015), CD was diagnosed by experienced endocrinologists and confirmed by postsurgical pathology. The detailed preoperative assessments of diagnostic criteria have been reported in our previous study. HCs were recruited from the local community and were controlled for any history of psychopathology abnormalities. All participants were right-handed and had normal vision and auditory sensation. The study was approved by the local ethics committee of the Chinese PLA General Hospital and written informed consent was obtained from each participant. The data of these 47 CD and 53 HC subjects have been partially used in our previous studies (Wang et al., 2019; Zhang et al., 2021).

2.2 Neuroendocrine and neuropsychological assessment

All participants underwent biochemical evaluation to assess their cortisol level. We quantified the levels of 24-h urinary free cortisol (24hUFC, nmol/24h); serum cortisol (nmol/L) at 0:00, 8:00, and 16:00. Cortisol was detected with an ADVIA Centaur Analyzer (Siemens Healthcare Diagnostics, Tarrytown, NY, USA). Cortisol levels at 8:00 as well as 24hUFC were also measured in 51 HC subjects.

All participants underwent a comprehensive neuropsychological assessment with an expert psychiatrist, including Self-Rating Depression Scale (SDS), Self-Rating Anxiety Scale (SAS), Mini-mental State Examination (MMSE), and Montreal Cognitive Assessment (MoCA). Moreover, health-related quality of life and neuropsychiatric symptoms of CD patients were evaluated with the Cushing’s Quality-of-Life (CushingQoL) questionnaire (Nelson et al., 2013) and Chinese version of the neuropsychiatric inventory (CNPI) (Leung et al., 2001), respectively.

2.3 Image acquisition

Structural and functional MRI data were acquired on a 3.0-Tesla MR system (Discovery MR750, General Electric) with an 8-channel head coil. High-resolution structural 3D T1-weighted images were conducted using a sagittal Fast Spoiled Gradient-Echo (FSPGR) sequence with the following parameters: repetition time = 6.7 ms, echo time = 2.9 ms, flip angle = 7°, field of view = 250 × 250 mm2, number of slices = 192, voxel size = 1 × 1 × 1 mm3 with no gap. The functional images were acquired using an echo-planar imaging (EPI) sequence with repetition time = 2000 ms, echo time = 30 ms, flip angle = 90°, thickness/gap = 3.5 mm/0.5 mm, slices = 36, field of view = 224 × 224 mm2, voxel size = 3.5 × 3.5 × 3.5 mm3, number of total volumes = 240. Soft earplugs were used to attenuate scanner noise and head motion was restrained with foam padding. During functional scanning, all participants were requested to keep their eyes closed and stay awake.

2.4 rs-fMRI data preprocessing

Preprocessing of the rs-fMRI images was conducted using SPM12 and Data Processing Assistant for Resting-State fMRI (DPABI, http://www.restfmri.net/forum/DPARSF). The first 10 volume of the functional images were removed to avoid initial steady-state problems. Then functional images were spatially realigned to the first image for motion correction, and reslicing for acquisition temporal delay. The head motion of all participants in this study had no more than 2-mm translation or 2° rotation in any direction. Next, functional images were coregistered to each participant’s segmented gray matter T1 image, and then spatially normalized to the MNI space, resampled to 3-mm isotropic voxels. Subsequently, the global signal, white matter signal, cerebrospinal fluid signal and 24-motion vectors were regressed from the data. Finally, linear detrending and bandpass filter (0.01−0.08 Hz) were carried out to reduce the effects of low-frequency drift and high-frequency physiological noise.

2.5 Hippocampal functional connectivity

The hippocampus has been functionally parcellated into four subregions (left rostral hippocampus, left caudal hippocampus, right rostral hippocampus, and right caudal hippocampus) based on Human Brainnetome Atlas (Fan et al., 2016). On each hippocampal subregion, we performed seed-based functional connectivity analysis. Briefly, hippocampal functional connectivity maps were obtained by computing the Pearson correlation coefficient for each voxel’s time course with the average time course inside the region of interest. Notably, the computation was constrained within a gray-matter mask which was generated by thresholding (a threshold of 0.2) a prior gray-matter probability map in SPM12. The resulting correlation coefficients were further converted to z scores using Fisher’s r-to-z transform to improve normality. For each subject, we obtained 4 z-score maps indicative of the intrinsic functional connectivity patterns of the four hippocampal subregions. To exclude the possible confounding effect of hippocampal volume in CD patients, we performed a voxel-based morphometry analysis on structural MRI images and took the volume of hippocampal subregions as a covariate in the functional connectivity statistical analyses.

2.6 Statistical analysis

All demographic and clinical variables including neuroendocrine and neuropsychological scores were compared by two-sample t-tests. Sex composition of the two groups was compared using a Pearson’s chi-square test (two-tailed). To explore differences in hippocampal functional connectivity between CD patients and HCs, general linear models were performed in a voxel-wise fashion. To exclude the possible confounding effects of age, gender, education level, and volume of hippocampal subregions, we used these measures as covariates in the general linear models. Multiple comparison correction was performed using a FDR of 0.05 within the grey matter mask.

In CD patients group, a linear regression analysis was further performed to explore the relationship between functional connectivity of the clusters showing significant group differences and neuropsychological scores as well as the endocrinological indicators (cortisol and 24hUFC). Multiple comparisons were also corrected using the FDR method with a corrected threshold of q < 0.05.

3 RESULTS

3.1 Demographic, endocrinological, and neuropsychological results

Table 1 shows the demographic characteristics of the CD patients and the HCs. There were no significant differences in terms of age, sex distribution, and years of education between groups. Compared with HCs, CD patients had significantly lower MoCA scores and higher SDS and SAS scores (Table 1). As expected, the CD patients had significantly higher levels of serum cortisol and 24hUFC (p < .001). Moreover, we calculated the volumes of the four hippocampal subregions and found smaller volumes of all four hippocampal subregions in the CD patients.

TABLE 1. Participant characteristics
CDs (n = 47) HCs (n = 53) p Value
Age (years) 37.38 ± 10.61 (20–59) 34.79 ± 10.72 (21–63) .113
Gender (male/female) 4/43 4/49 .859
Education (years) 11.00 ± 4.11 11.74 ± 3.10 .311
Illness duration (months) 41.62 ± 53.71
Neuropsychological tests
MoCA 22.47 ± 3.98 (n = 45) 27.72 ± 2.00 <.001
SDS 40.18 ± 9.96 (n = 45) 27.13 ± 4.42 <.001
SAS 38.27 ± 7.90 (n = 45) 26.98 ± 4.47 <.001
CNPI 11.93 ± 9.68 (n = 45)
Cushing QOL 37.76 ± 8.29 (n = 45)
Endocrinological tests
Serum cortisol (nmol/L)
0:00 am 633.81 ± 237.59 (n = 46)
8:00 am 735.34 ± 279.44 (n = 47) 358.51 ± 107.43 (n = 51) <.001
16:00 pm 671.05 ± 273.56 (n = 47)
24hUFC (nmol/24 h) 2381.59 ± 1653.16 (n = 41) 252.03 ± 119.47 (n = 47) <.001
Volume of hippocampal subregions (mm3)
Left rostral hippocampus 343.75 ± 39.15 (257.18–423.27) 365.69 ± 27.19 (313.21–442.06) .001
Left caudal hippocampus 272.69 ± 32.74 (206.63–339.04) 296.39 ± 23.13 (249.62–347.61) <.001
Right rostral hippocampus 305.10 ± 33.71 (229.67–396.89) 336.76 ± 25.98 (274.95–415.16) <.001
Right caudal hippocampus 320.42 ± 32.60 (238.16–396.58) 347.87 ± 27.16 (294.00–415.80) <.001
  • Abbreviations: 24hUFC, 24-h urinary free cortisol.; CDs, Cushing’s disease patients; CNPI, Chinese version of neuropsychiatric inventory; Cushing QOL, Cushing Quality of Life Scale; HCs, healthy controls; MoCA, Montreal Cognitive Assessment; SAS, Self-Rating Anxiety Scale; SDS, Self-Rating Depression Scale.
  • Note: All values are expressed as mean ± SD. Group differences in sex between CDs and HCs were examined using chi-square test. Group differences in the other demographic and clinical characteristics between CDs and HCs were examined using two-sample t-tests (two-tailed).

3.2 Spatial distribution of hippocampal functional connectivity

The hippocampal functional connectivity maps of both CD patients and HCs are presented in Figure 1. Visually, the spatial distributions of hippocampal functional connectivity were highly similar between groups, in spite of some differences in strength. We observed that the brain regions significantly positively connecting to hippocampus were primarily distributed in several limbic network regions (the orbital frontal cortex, bilateral medial temporal regions, and temporal pole) and DMN regions (bilateral medial frontal cortex, posterior cingulate gyrus/precuneus, and anterior cingulate cortex). Brain regions with negative connectivity to hippocampus were chiefly distributed in the frontoparietal network regions (dorsolateral prefrontal cortex, supramarginal gyrus, and angular gyrus).

Details are in the caption following the image

Between-group differences in functional connectivity of the hippocampal subregions. The first column shows the hippocampal functional connectivity subregions. The second and third columns show the hippocampal functional connectivity maps within CD and HC groups, respectively. Further between-group comparisons showed that CD patients had significantly altered hippocampal functional connectivities relative to HCs, with a corrected statistical threshold of < .05. ROI1, left rostral hippocampus; ROI2, left caudal hippocampus; ROI3, right rostral hippocampus; ROI4, right caudal hippocampus; ROI, region of interest; CD, Cushing’s disease; HC, healthy control

3.3 Altered hippocampal functional connectivity in CD patients

The significant differences in functional connectivity with each hippocampal subregion between the CD patients and HCs groups are illustrated in third column of Figure 1. Both the right and left rostral hippocampus exhibited significantly decreased functional connectivity with the superior parietal lobe (SPL), a component of the frontoparietal network. Moreover, right rostral hippocampus exhibited additional increased functional connectivity with right inferior frontal gyrus, a component of DMN. For the left caudal hippocampus, significantly altered functional connectivity was found to the DMN regions, including (bilateral medial frontal cortex, angular gyrus, anterior, and posterior cingulate cortex). We also observed decreased functional connectivity between the right caudal hippocampus and anterior cingulate cortex. Additionally, the right caudal hippocampus exhibited increased functional connectivity with some limbic regions including the right orbital frontal cortex and temporal pole (Table 2).

TABLE 2. Brain regions showing changed RSFC between CDs and HCs groups
Peak MNI coordinate
Brain regions BA Cluster size (voxels) x y z Peak T
ROI-based RSFC
ROI1 R IFG 48 219 57 21 —3 4.598
L angular 39 423 −27 −72 51 −5.530
RIO2 R thalamus 114 9 −6 3 −5.905
L angular 39 195 −27 −72 54 −4.830
R angular 39 384 36 −66 48 −5.607
ROI3 R MTG 20 633 39 6 −21 4.410
L angular 39 195 −27 −72 54 −4.830
R angular 39 384 36 −66 48 −5.607
MFG/ACC 10/32 572 −3 42 −3 −4.033
PCC/PreCUN 26/23 709 12 −45 27 −4.502
ROI4 MFG/ACC 32 465 3 48 6 −4.670
R MTG/OFC 48/21 747 30 3 −21 4.208
  • Note: Statistical threshold was set at p < .05, corrected.
  • Abbreviations: CDs, Cushing’s disease patients; HCs, healthy controls; ROI, regions of interest; BA, Brodmann areas; MNI, Montreal Neurological Institute; RSFC, resting-state functional connectivity; SFG, superior frontal gyrus; MFG, middle frontal gyrus; dMFG, dorsal medial frontal gyrus; IPL, inferior parietal lobule; AG, angular gyrus; ROL, rolandic operculum; Ins, insular; PrCG, precentral gyrus; L, left; R, right; ROI1, left rostral hippocampus; ROI2, left caudal hippocampus; ROI3, right rostral hippocampus; ROI4, right caudal hippocampus.

3.4 Brain–behavior relationships in the CD patients

In the correlation analyses of CD patients, the mean values of the functional connectivity between the left caudal hippocampus and anterior cingulate cortex correlated positively with the Cushing’s QoL scores (r = .327, p < .05) (Figure 2). No other correlations were found for volumes and functional connectivity of the four hippocampal subregions with neuroendocrine and neuropsychological assessment in the CD patients.

Details are in the caption following the image

Significant correlations between left hippocampal functional connectivity and the quality of life in CD patients. CD, Cushing’s disease; Hip, hippocampus; ACC, anterior cingulate cortex

4 DISCUSSION

Using a cohort of CD patients and HCs, the present study performed a comprehensive investigation to reveal how the chronic hypercortisolism affects the morphology and connectivity of hippocampal subregions and their relationships with neuroendocrine and neuropsychological assessment. Compared with the HCs, the CD patients had smaller volumes of all four hippocampal subregions. Furthermore, CD patients exhibited differential patterns of altered hippocampal functional connectivity with high-order networks, involving the DMN, frontoparietal, and limbic networks. The intrinsic hippocampal functional connectivity was associated with the quality of life of the CD patients. Together, these findings elucidate the cumulative effect of cortisol on the morphology and function of hippocampus and provide important information to further understand the role of hippocampus in stress-related brain disease.

Cortisol, the end product of the hypothalamic–pituitary–adrenal axis, plays a critical role in the body’s response to stress and maintenance of homeostasis (Sapolsky et al., 2000); however, chronic hypercortisolism is known to impair neurons in the hippocampus. CD patients naturally demonstrate chronic excessive amounts of cortisol; therefore these patients serve as a natural “hyperexpression model” to investigate the chronic effects of cortisol on human hippocampus. Importantly, we showed the CD patients are associated with smaller hippocampal volumes in all four subregions. In line with our study, previous structural imaging studies have shown hippocampal volume decreases in CD patients (Frimodt-Møller et al., 2019; Toffanin et al., 2011). Furthermore, Brown et al. found that healthy volunteers were associated with a significant reduction in hippocampal volume following only 3-day stress doses of corticosteroid administration, strongly suggesting the effects of cortisol on hippocampal size. It is important to note that chronic hypercortisolism can affect the hippocampus in at least two ways: by direct neurotoxic effects on the hippocampus (Lupien et al., 2018; Uno et al., 1994) and by reduction in hippocampal neurogenesis (Saaltink & Vreugdenhil, 2014). Moreover, cortisol stimulates the release of excitatory amino acids glutamate on hippocampal cells (de Kloet et al., 2005). On the other hand, chronic elevations of cortisol also reduce neurotrophic factors that includes nerve growth factor and brain-derived neurotrophic factor (McEwen et al., 2015).

The different patterns of functional connectivity in rostral hippocampus versus caudal hippocampus might be associated to the specific cytoarchitecture along the rostral/caudal hippocampus. Accumulated evidence from both animal and human studies suggests that different parts of the hippocampus display distinctive gene expression and anatomical projections patterns (Fanselow & Dong, 2010). In detail, gene expression in the rostral hippocampus correlates with regions involved in emotion and stress (amygdala and hypothalamus). Moreover, the rostral hippocampus has connections with prefrontal regions, exerts strong regulatory control of the hypothalamic–pituitary–adrenal axis with a negative feedback (Toffanin et al., 2011). Accordingly, as demonstrated in this study, chronic hypercortisolism predominantly disrupted the functional connectivity in rostral hippocampus.

Another major finding in this study was altered hippocampal functional connectivity with DMN, frontoparietal, and limbic networks in CD individuals relative to that in HCs. Emerging evidence proposes that interactions within and between these large-scale brain networks play important roles on brain functions and may be affected in multiple psychiatric disorders (Menon, 2011; Sha et al., 2019). Among these brain networks, the DMN is anchored in the medial prefrontal cortex and posterior cingulate cortex and is implicated in internally directed attention and self-referential processing (Raichle, 2015), while the frontoparietal and limbic networks support the cognitive regulation of emotion, attention, and behavior (Buhle et al., 2014; Kohn et al., 2014). The engagement of these high-level functional networks may suggest the linkage of abnormal stress hormone cortisol to cognitive deficits in CD patients. In line with our study, previous studies have shown stress-induced cortisol increase was associated with altered connectivity within the major brain networks (Zhang et al., 2019, 20202020). Meanwhile, structural and functional alterations in these brain systems are also found in CD patients. For example, many functional imaging studies have consistently demonstrated altered brain activities and functional connectivity involving in DMN, frontoparietal, and limbic networks (Jiang et al., 2017; Wang et al., 2019; Zhang et al., 2021), even in the patients with long-term remission of CD (van der Werff et al., 2015). Importantly, previous studies have shown that the CD patients had widespread reductions of white matter integrity, which provide further evidence for the structural substrate for the persistence of these functional deficits (Pires et al., 2015; van der Werff et al., 2014). Here, we propose that by altering hippocampal processes via the abundant glucocorticoid and mineralocorticoid receptors, exposure to hypercortisolism disrupts the interactions with DMN, frontoparietal, and limbic networks in CD patients, thus engender vulnerability for emotional and cognitive problems. In line with this view is evidence that altered hippocampal functional connectivity is associated with the quality of life in CD patients. Because impaired quality of life is a persistent complaint from CD patients (Webb et al., 2018), it is important to accurately assess which aspects of QoL are affected in order to better understand the severity of hypercortisolism on patients and the potential efficacy of treatment. CushingQoL questionnaire has proven to be a valuable resource for assessing health-related QoL in CD patients, based on the combination of psychosocial issues and physical problems (Nelson et al., 2013). A better understanding of the neuroplasticity and continuing quality of life change may in turn facilitate advances in management and intervention.

Several issues need to be addressed further. First, although the sample size of this study was relatively large, the findings still need to be further replicated in an independent sample. Second, the cross-sectional, observational nature of our study design precludes any causal conclusions. Therefore, studies tracking dynamic changes in hippocampal functional connectivity following the remission of hypercortisolism are needed. We are currently following up participants as part of a longitudinal study. Finally, a combined analysis of multimodal imaging including structural and metabolic data would provide integrated information on the effect of cortisol excess on human brain.

In short, we demonstrate that CD patients present atypical morphology and functional connectivity of hippocampus. Here we observed the chronic hypercortisolism caused smaller volumes of all hippocampal subregions. This volume change was in line with the preclinical research that excess cortisol cause dendritic shrinkage and loss of spines in the hippocampus. Functionally, CD patients demonstrated altered hippocampal connectivity whose nodes include key components of the DMN, frontoparietal, and limbic networks. These multimodal results reinforce the need for effective therapeutic interventions in stress-related brain disease to halt possible hippocampal damage.

ACKNOWLEDGMENTS

This study was supported by the National Natural Science Foundation of China (No. 82001798 and No. 81871087), Military Young Scholar Medical Research Fund of Chinese PLA General Hospital (No. QNF19071), and Medical Big Data and Artificial Intelligence Development Fund of Chinese PLA general Hospital (No. 2019MBD-039).

CONFLICT OF INTEREST

The authors report no biomedical financial interests or potential conflicts of interest.

Read more, including references, at https://onlinelibrary.wiley.com/doi/10.1002/brb3.2507

Crinetics Pharmaceuticals (CRNX) Reports Positive Top-line Results Including Strong Adrenal Suppression from CRN04894 Phase 1 Study

Crinetics Pharmaceuticals, Inc. (Nasdaq: CRNX) today announced positive results from the multiple-ascending dose (MAD) portion of a first-in-human Phase 1 clinical study of CRN04894, the company’s first-in-class, investigational, oral, nonpeptide adrenocorticotropic hormone (ACTH) antagonist that is being developed for the treatment of Cushing’s disease, congenital adrenal hyperplasia (CAH) and other conditions of excess ACTH. Following administration of CRN04894, results showed serum cortisol below normal levels and a marked reduction in 24-hour urine free cortisol excretion in the presence of sustained, disease-like ACTH concentrations.

“The design of our Phase 1 healthy volunteer study allowed us to demonstrate CRN04894’s potent pharmacologic activity in the presence of ACTH levels that were in similar range to those seen in CAH and Cushing’s disease patients,” said Alan Krasner, M.D., Crinetics’ chief medical officer. “The observation of dose-dependent reductions in serum cortisol levels to below the normal range even in the presence of high ACTH indicates that CRN04894 was effective in blocking the key receptor responsible for regulating cortisol secretion. We believe this is an important finding that may be predictive of CRN04894’s efficacy in patients.”

ACTH is the key regulator of the hypothalamic-pituitary adrenal (HPA) axis controlling adrenal activation. It is regulated by cortisol via a negative feedback loop that acts to inhibit ACTH secretion. This feedback loop is dysregulated in diseases of excess ACTH. In Cushing’s disease, a benign pituitary tumor drives excess ACTH secretion even in the presence of excess cortisol. While in CAH, an enzyme deficiency results in excess androgen synthesis without normal cortisol synthesis, allowing unchecked ACTH production and requiring lifelong glucocorticoid use. In both diseases, excess ACTH drives over-stimulation of the adrenal gland and leads to a host of symptoms including infertility, adrenal rest tumors, and metabolic complications in CAH and, in Cushing’s disease, symptoms include hypertension, central obesity, neuropsychiatric disorders and metabolic complications. To our knowledge, no other ACTH antagonists are currently in clinical development for diseases of ACTH excess such as Cushing’s disease or CAH.

The 49 healthy adults evaluated in the multiple ascending dose portion of the Phase 1 study were administered 40, 60 or 80 mg doses of CRN04894, or placebo, daily for 10 days. After 10 days of dosing was complete, evaluable participants were administered an ACTH challenge to stimulate adrenal activation to disease relevant levels. Safety and pharmacokinetic data were consistent with expectations from the single-ascending dose cohorts in the Phase 1 study. There were no discontinuations due to treatment-related adverse events and no serious adverse events reported. Glucocorticoid deficiency was the most common treatment-related adverse event in the MAD cohorts. This was an expected extension of pharmacology given the mechanism of action of CRN04894. CRN04894 showed consistent oral bioavailability in the MAD cohorts with a half-life of approximately 24 hours, which is anticipated to support once-daily dosing.

Participants in the MAD cohorts who were administered once nightly CRN04894 experienced a dose-dependent suppression of adrenal function as measured by suppression of serum cortisol production of 17%, 29% and 37% on average from baseline over 24 hours for the 40, 60 or 80 mg dosing groups respectively, (despite requirement for glucocorticoid supplementation in some of these subjects to prevent clinical adrenal insufficiency), compared to an average 2% increase in serum cortisol for individuals receiving placebo. The strong, dose-dependent suppression of serum and urine free cortisol was achieved despite ACTH levels in subjects in the 60 and 80 mg cohorts similar to those typically seen in patients with CAH and Cushing’s disease. Even when an additional exogenous ACTH challenge was administered on top of the already increased ACTH levels, cortisol levels remained below the normal range in subjects receiving CRN04894, indicating clinically significant suppression of adrenal activity.

“Due to its central position in HPA axis, ACTH is the obvious target for inhibiting excessive stimulation of the adrenal in diseases of ACTH excess. Even though the field of endocrinology has known about its clinical significance for more than 100 years, we are not aware of any other ACTH antagonist that has entered clinical development. This is an important milestone for endocrinology and for our company.” said Scott Struthers, Ph.D., founder and chief executive officer of Crinetics. “We are very excited to initiate patient studies in Cushing’s disease and CAH with CRN04894, which will be our third home-grown NCE to demonstrate pharmacologic proof-of-concept and enter patient trials.”

Crinetics plans to present additional details of safety, efficacy, and biomarker results from the CRN04894 Phase 1 study at an endocrinology-focused medical meeting in 2022.

Data Review Conference Call Crinetics will hold a conference call and live audio webcast today, May 25, 2022, at 8:00 a.m. Eastern Time to discuss results from the MAD cohorts of the Phase 1 study of CRN04894. To participate, please dial 1-877-407-0789 (domestic) or 1-201-689-8562 (international) and refer to conference ID 13730000. To access the webcast, click here. Following the live event, a replay will be available on the Events page of the Company’s website.

About the CRN04894 Phase 1 Study Crinetics has completed enrollment of the 88 healthy volunteers in this double-blind, randomized, placebo-controlled Phase 1 study. Participants were divided into multiple cohorts in the single ascending dose (n=39) and multiple ascending dose (n=49) portions of the study. In both the SAD and MAD portions of the study, safety and pharmacokinetics were assessed. In addition, pharmacodynamic responses were evaluated before and after challenges with injected synthetic ACTH to assess pharmacologic effects resulting from exposure to CRN04894.

From https://www.streetinsider.com/Corporate+News/Crinetics+Pharmaceuticals+(CRNX)+Reports+Positive+Top-line+Results+Including+Strong+Adrenal+Suppression+from+CRN04894+Phase+1+Study/20126484.html

Copeptin Levels Before and After Transsphenoidal Surgery for Cushing Disease: A Potential Early Marker of Remission

Abstract

Context

Arginine-vasopressin and CRH act synergistically to stimulate secretion of ACTH. There is evidence that glucocorticoids act via negative feedback to suppress arginine-vasopressin secretion.

Objective

Our hypothesis was that a postoperative increase in plasma copeptin may serve as a marker of remission of Cushing disease (CD).

Design

Plasma copeptin was obtained in patients with CD before and daily on postoperative days 1 through 8 after transsphenoidal surgery. Peak postoperative copeptin levels and Δcopeptin values were compared among those in remission vs no remission.

Results

Forty-four patients (64% female, aged 7-55 years) were included, and 19 developed neither diabetes insipidus (DI) or syndrome of inappropriate anti-diuresis (SIADH). Thirty-three had follow-up at least 3 months postoperatively. There was no difference in peak postoperative copeptin in remission (6.1 pmol/L [4.3-12.1]) vs no remission (7.3 pmol/L [5.4-8.4], P = 0.88). Excluding those who developed DI or SIADH, there was no difference in peak postoperative copeptin in remission (10.2 pmol/L [6.9-21.0]) vs no remission (5.4 pmol/L [4.6-7.3], P = 0.20). However, a higher peak postoperative copeptin level was found in those in remission (14.6 pmol/L [±10.9] vs 5.8 (±1.4), P = 0.03]) with parametric testing. There was no difference in the Δcopeptin by remission status.

Conclusions

A difference in peak postoperative plasma copeptin as an early marker to predict remission of CD was not consistently present, although the data point to the need for a larger sample size to further evaluate this. However, the utility of this test may be limited to those who develop neither DI nor SIADH postoperatively.

Arginine vasopressin (AVP) and CRH act synergistically as the primary stimuli for secretion of ACTH, leading to release of cortisol [12]. The role of AVP in the hypothalamic-pituitary-adrenal (HPA) axis is via release from the parvocellular neurons of the paraventricular nuclei (and possibly also from the magnocellular neurons of the paraventricular and supraoptic nuclei), the secretion of which is stimulated by stress [3-6]. AVP release results in both independent stimulation of ACTH release and potentiation of the effects of CRH [37-9]. Additionally, there is evidence that glucocorticoids act by way of negative feedback to suppress AVP secretion [1011-20]. Further, parvocellular neurons of the hypothalamic paraventricular nuclei have been shown to increase AVP production and neurosecretory granule size after adrenalectomy, and inappropriately elevated plasma AVP has been reported in the setting of adrenal insufficiency with normalization of plasma AVP after glucocorticoid administration [21-24]. This relationship of AVP and its effect on the HPA axis has been used in the diagnostic evaluation of Cushing syndrome (CS) [14] and evaluation of remission after transsphenoidal surgery (TSS) in Cushing disease (CD) by administration of desmopressin [25].

Copeptin makes up the C-terminal portion of the AVP precursor pre-pro-AVP. Copeptin is released from the posterior pituitary in stoichiometric amounts with AVP, and because of its longer half-life in circulation, it is a stable surrogate marker of AVP secretion [26-28]. Plasma copeptin has been studied in various conditions of the anterior pituitary. In a study by Lewandowski et al, plasma copeptin was measured after administration of CRH in assessment of HPA-axis function in patients with a variety of pituitary diseases. An increase in plasma copeptin was observed only in healthy subjects but not in those with pituitary disease who had an appropriately stimulated serum cortisol, and the authors concluded that copeptin may be a sensitive marker to reveal subtle alterations in the regulation of pituitary function [7]. Although in this study and others, plasma copeptin was assessed after pituitary surgery, it has not, to the best of our knowledge, been studied as a marker of remission of CD before and after pituitary surgery [729].

In this study, plasma copeptin levels were assessed as a surrogate of AVP secretion before and after TSS for treatment of CD. Because there is evidence that glucocorticoids exert negative feedback on AVP, we hypothesized that there would be a greater postoperative increase in plasma copeptin in those with CD in remission after TSS resulting from resolution of hypercortisolemia and resultant hypocortisolemia compared with those not in remission with persistent hypercortisolemia and continued negative feedback. In other words, we hypothesized that an increase in copeptin could be an early marker of remission of CD after TSS. We aimed to complete this assessment by comparison of the peak postoperative copeptin and change in copeptin from preoperative to peak postoperative copeptin for those in remission vs not in remission postoperatively.

Subjects and Methods

Subjects

Adult and pediatric patients with CD who presented at the Eunice Kennedy Shriver National Institute of Child Health and Human Development under protocol 97-CH-0076 and underwent TSS between March 2016 and July 2019 were included in the study. Exclusion criteria included a prior TSS within 6 weeks of the preoperative plasma copeptin sample or a preoperative diagnosis of diabetes insipidus, renal disease, or cardiac failure. Written informed consent was provided by patients aged 18 years and older and by legal guardians for patients aged < 18 years to participate in this study. Written informed assent was provided by patients aged 7 years to < 18 years. The 97-CH-0076 study (Investigation of Pituitary Tumors and Related Hypothalamic Disorders) has been approved by the Eunice Kennedy Shriver National Institute of Child Health and Human Development institutional review board.

Clinical and Biochemical Data

Clinical data were extracted from electronic medical records. Age, sex, body weight, body mass index (BMI), pubertal stage (in pediatric patients only), and history of prior TSS were obtained preoperatively during the admission for TSS. Clinical data obtained postoperatively included TSS date, histology, development of central diabetes insipidus (DI) or (SIADH), time from TSS to most recent follow-up, and clinical remission status at postoperative follow-up.

Preoperatively, serum sodium, 24-hour urinary free cortisol (UFC), UFC times the upper limit of normal (UFC × ULN), midnight (MN) serum cortisol, MN plasma ACTH, and 8 AM plasma ACTH were collected. Postoperatively, serum sodium, serum and urine osmolality, urine specific gravity, serum cortisol, and plasma ACTH were collected. For serum cortisol values < 1 mcg/dL, a value of 0.5 mcg/dL was assigned for the analyses; for plasma ACTH levels < 5 pg/mL, a value of 2.5 pg/mL was assigned.

Additionally, plasma copeptin levels were obtained preoperatively and on postoperative days (PODs) 1 through 8 after TSS at 8:00 AM. Peak postoperative copeptin was the highest plasma copeptin on PODs 1 through 8. The delta copeptin (Δcopeptin) was determined by subtracting the preoperative copeptin from the peak postoperative copeptin; hence, a positive change indicated a postoperative increase in plasma copeptin. Plasma copeptin was measured using an automated immunofluorescent sandwich assay on the BRAHMS Kryptor Compact PLUS Copeptin-proAVP. The limit of detection for the assay was 1.58 pmol/L, 5.7% intra-assay coefficient of variation, and 11.2% inter-assay coefficient of variation, with a lower limit of analytical measurement of 2.8 pmol/L. For those with multiple preoperative plasma copeptin values within days before surgery, an average of preoperative copeptin levels was used for analyses.

Diagnosis of CD was based on guidelines published by the Endocrine Society and as previously described for the adult and pediatric populations [3031]; diagnosis was further confirmed by either histologic identification of an ACTH-secreting pituitary adenoma in the resected tumor specimen, decrease in cortisol and ACTH levels postoperatively, and/or clinical remission after TSS at follow-up evaluation. All patients were treated with TSS at the National Institutes of Health Clinical Center by the same neurosurgeon. Remission after surgical therapy was based on serum cortisol of < 5 μg/dL during the immediate postoperative period, improvement of clinical signs and symptoms of cortisol excess at postoperative follow up, nonelevated 24-hour UFC at postoperative follow-up, nonelevated midnight serum cortisol at postoperative follow up when available, and continued requirement for glucocorticoid replacement at 3 to 6 months’ postoperative follow-up.

Diagnosis of SIADH was based on development of hyponatremia (serum sodium < 135 mmol/L) and oliguria (urine output < 0.5 mL/kg/h). Diagnosis of DI was determined by development of hypernatremia (serum sodium > 145 mmol/L), dilute polyuria (urine output > 4 mL/kg/h), elevated serum osmolality, and low urine osmolality.

Statistical Analyses

Results are presented as median (interquartile range [IQR], calculated as 25th percentile-75th percentile) or mean ± SD, as appropriate, and frequency (percentage). Where appropriate, we compared results using parametric or nonparametric testing; however, the median (IQR) and the mean ± SD were both reported to allow for comparisons with the appropriate testing noted. Subgroup analyses were completed comparing those who developed water balance disorders included patients who developed DI only (but not SIADH), those who developed SIADH only (but not DI), and those with no water balance disorder; hence, for these subgroup analyses, those who developed both DI and SIADH postoperatively (n = 4) were excluded. Preoperative copeptin, peak postoperative copeptin, and Δcopeptin were compared between those with and without remission at follow-up, using either t test or Wilcoxon rank-sum test, depending on the distribution of data. These were done in all patients combined, as well as within each subgroup. The same tests were used for comparing other continuous variables (eg, age, BMI SD score [SDS], cortisol excess measures) between those with and without remission. Categorical data (eg, sex, Tanner stage) were analyzed using the Fisher exact test. Comparisons of copeptin levels among the subgroups (DI, SIADH, neither) were carried out using mixed models and the Kruskal-Wallis test, as appropriate. Post hoc pairwise comparisons were adjusted for multiplicity using the Bonferroni correction, and as applicable, only corrected P values are reported. Mixed models for repeated measures also analyzed copeptin, serum sodium, and cortisol data for PODs 1 through 8. In addition, maximum likelihood estimation (GENMOD) procedures analyzed the effects of copeptin and serum sodium on the remission at follow-up. Correlation analyses were done with Spearman ρ. All analyses were tested for the potential confounding effects of age, sex, BMI SDS, and pubertal status, and were adjusted accordingly. For plasma copeptin reported as < 2.8 pmol/L, a value of 1.4 pmol/L (midpoint of 0 and 2.8 pmol/L) was used; sensitivity analyses repeated all relevant comparisons using the threshold limit of 2.8 pmol/L instead of 1.4 pmol/L. Odds ratios (OR) and 95% CIs, other magnitudes of the effect, data variability, and 2-sided P values provided the statistical evidence for the conclusions. Statistical analyses were performed in SAS version 9.4 software (SAS Institute, Inc, Cary, NC).

Results

Patient Characteristics

Forty-four adult and pediatric patients, aged 7 to 55 years (77.2% were < 18 years old), with CD were included in the study. The cohort included 28 female patients (64%), and the median BMI SDS was 2.2 (1.1-2.5). Thirty-four percent (15/44) had prior pituitary surgery (none within the prior 6 weeks). Seventy-five percent (33/44) had postoperative follow-up evaluations available, with median follow-up of 13.5 months (11.3-16.0). Of those 33 patients, 85% were determined to be in remission at follow-up. Comparing those in remission vs no remission, there was no difference in age, sex, BMI SDS, pubertal status (in pediatric ages only), preoperative measures of cortisol excess (UFC × ULN, PM serum cortisol, MN plasma ACTH, AM plasma ACTH), duration of follow-up, or development of DI or SIADH. There was a lower postoperative serum cortisol nadir in those in remission at follow-up compared with those not in remission at follow-up, as expected, because a postoperative serum cortisol < 5 μg/dL was included in defining remission status. Postoperatively, 8/44 (18%) developed DI, 13/44 (30%) developed SIADH, 4/44 (9%) developed both DI and SIADH, and 19/44 (43%) developed no water balance disorder (Table 1). There were no differences by remission status when assessing these subgroups (ie, DI, SIADH, and no water balance disorder) separately.


Table 1.

Demographic and clinical characteristics of subjects

All subjects, n = 44 All subjects by remission status, n = 33 All subjects by remission status, excluding those with DI or SIADH, n = 13
Remission, n = 28 No remission, n = 5 P Remission,
n = 10
No remission, n = 3 P
Age, median (range), y 14.5 (7-55) 17.4 ± 10.7
14.5 (12.5-17.5)
15.6 ± 13.2
11.0 (9.0-12.0)
0.11 13.7 ± 3.1
14.0 (13.0-15.0)
19.7 ± 16.8
11.0 (9.0-39.0)
0.60a
Sex
Female
28 (64%) 22 (78.6%) 3 (60.0%) 0.57 9 (90.0%) 2 (66.7%) 0.42
BMI SDS 2.2 (1.1-2.5) 1.7 ± 1.0
2.0 (0.9-2.5)
2.2 ± 0.4
2.2 (2.1-2.3)
0.70 1.7 ± 1.1
2.0 (0.7-2.5)
2.0 ± 0.4
2.1 (1.5-2.3)
0.65a
Pubertal status
Female (n = 19) (n = 15) (n = 2) 0.51 (n = 8) (n = 1) 0.44
  Tanner 1-2 6 4 (26.7%) 1 (50.0%) 3 (37.5%) 1 (25.0%)
  Tanner 3-5 13 11 (73.3%) 1 (50.0%) 5 (62.5%) 0
Male (n = 14) (n = 5) (n = 2) (n = 1) (n = 1)
Testicular volume < 12, mL 10 4 (80.0%) 2 (10.00%) 1 (100.0%) 1 (100.0%)
Testicular volume ≥ 12, mL 4 1 (20.0%) 0 1.0 0 0
Preoperative UFC ULN 3.3 (1.2-6.1) 4.9 ± 6.1
2.6 (1.0-7.6)
3.2 ± 1.3
3.7 (3.0-3.9)
0.70 7.2 ± 8.4
3.9 (1.8-9.1)
3.8 ± 0.7
3.9 (3.0-4.4)
0.93
Preoperative PM cortisol 11.9 (9.2-14.8) 13.3 ± 4.7
12.2 (9.2-16.8)
10.8 ± 2.1
11.5 (9.0-11.6)
0.30 13.3 ± 6.0
11.2 (8.4-16.5)
11.1 ± 2.6
11.6 (8.3-13.6)
0.57a
Preoperative MN ACTH 43.4 (29.3-51.6) 44.2 ± 25.5
46.1 (27.6-50.5)
40.9 ± 15.3
11.5 (9.0-11.6)
0.74 36.6 ± 16.6
37.4 (29.1-48.8)
34.0 ± 9.4
39.3 (23.1-39.5)
0.67
Preoperative AM ACTH 44.6 (31.4-60.5) 46.9 ± 28.9
44.0 (29.8-56.2)
48.6 ± 28.8
58.7 (21.7-60.5)
0.84 35.2 ± 16.2
40.3 (28.0-44.0)
45.4 ± 24.6
58.7 (17.0-60.5)
0.41a
Postoperative cortisol nadir 0.5 (0.5-0.5) 0.7 ± 0.7
0.5 (0.5-0.5)
7.8 ± 6.6
5.2 (2.2-12.3)
<0.001 0.6 ± 0.3
0.5 (0.5-0.5)
8.1 ± 7.9
5.2 (2.1-17.0)
0.003
Duration of follow-up 13.5 (11.3-16.0) 15.3 ± 7.9
14.0 (12.0-16.5)
14.0 ± 13.0
11.0 (6.0-14.0)
0.30 18.6 ± 11.2
15.5 (12.0-27.0)
16.7 ± 17.2
11.0 (3.0-36.0)
0.82a
DI only 8 (18%) 7/8 (87.5%) 1/8 (12.5%) 0.91
SIADH only 13 (30%) 8/9 (88.9%) 1/9 (11.1%)
Neither DI/SIADH 19 (43%) 10/13 (76.9%) 3/13 (23.1%)
Both DI and SIADH 4 (9%) 3/3 (100%) 0/3

Demographic and clinical characteristics of all subjects (n = 44) with Cushing disease. Data are also presented by remission status for all subjects with postoperative follow-up (n = 33) and by remission status after excluding those who developed DI or SIADH postoperatively with postoperative follow-up (n = 13). Both median (IQR) and mean ± SD reported to allow for comparisons, with P value provided using appropriate testing depending on distribution of data sets. Data are mean ± SD, median (25th-75th IQR), or frequency (percentage) are reported, except for age, which is presented as median (range).

Abbreviations: AM, 7:30-8 PM; BMI, body mass index; DI, diabetes insipidus; IQR, interquartile range; MN, midnight; N/A, not applicable; SDS, SD score; SIADH, syndrome of inappropriate antidiuresis; UFC, urinary free cortisol; ULN, upper limit of normal. p-values below the threshold of 0.05 are in bold.

aP value indicates comparison using parametric testing, as appropriate for normally distributed data.

Preoperative copeptin levels were higher in males (7.0 pmol/L [5.1-9.6]) than in females (4.0 pmol/L [1.4-5.8], P = 0.004) (Fig. 1). Age was inversely correlated with preoperative copeptin (rs = -0.35, P = 0.030) and BMI SDS was positively correlated with preoperative copeptin (rs = 0.54, P < 0.001) (Fig. 2).


Figure 1.

Preoperative plasma copeptin and sex. Preoperative plasma copeptin in all patients, comparing by sex. A higher preoperative plasma copeptin was found in males (7.0 pmol/L [5.1-9.6]) than in females (4.0 pmol/L [1.4-5.8], P = 0.004). Horizontal lines = median. Whiskers = 25th and 75th interquartile ranges.

Preoperative plasma copeptin and sex. Preoperative plasma copeptin in all patients, comparing by sex. A higher preoperative plasma copeptin was found in males (7.0 pmol/L [5.1-9.6]) than in females (4.0 pmol/L [1.4-5.8], P = 0.004). Horizontal lines = median. Whiskers = 25th and 75th interquartile ranges.


Figure 2.

Preoperative plasma copeptin and BMI SDS. Association of preoperative plasma copeptin and BMI SDS in all patients. A BMI SDS was positively associated with a preoperative plasma copeptin (rs = 0.54, P < 0.001). Shaded area = 95% confidence interval.

Preoperative plasma copeptin and BMI SDS. Association of preoperative plasma copeptin and BMI SDS in all patients. A BMI SDS was positively associated with a preoperative plasma copeptin (rs = 0.54, P < 0.001). Shaded area = 95% confidence interval.

Copeptin Before and After Transsphenoidal Surgery for CD

Among the 33 patients with postoperative follow-up, there was no difference in peak postoperative copeptin for patients in remission vs those not in remission (6.1 pmol/L [4.3-12.1] vs 7.3 pmol/L [5.4-8.4], P = 0.88). There was also no difference in the Δcopeptin for those in remission vs not in remission (2.3 pmol/L [-0.5 to 8.2] vs 0.1 pmol/L [-0.1 to 2.2], P = 0.46) (Fig. 3). Including all subjects, the mean preoperative copeptin was 5.6 pmol/L (±3.4). For patients with follow-up, there was no difference in preoperative copeptin for those in remission (4.8 pmol/L [±2.9]) vs no remission (6.0 pmol/L [±2.0], P = 0.47). POD 1 plasma copeptin ranged from < 2.8 to 11.3 pmol/L.


Figure 3.

(A) Peak postoperative plasma copeptin in all patients, comparing those in remission with no remission (6.1 pmol/L [4.3-12.1] vs 7.3 pmol/L [5.4-8.4], P = 0.88). (B) ΔCopeptin (preoperative plasma copeptin subtracted from postoperative peak plasma copeptin) in all patients, comparing those in remission with no remission (2.3 pmol/L [-0.5 to 8.2] vs 0.1 pmol/L [-0.1 to 2.2], P = 0.46). Horizontal lines = median. Whiskers = 25th and 75th interquartile ranges.

(A) Peak postoperative plasma copeptin in all patients, comparing those in remission with no remission (6.1 pmol/L [4.3-12.1] vs 7.3 pmol/L [5.4-8.4], P = 0.88). (B) ΔCopeptin (preoperative plasma copeptin subtracted from postoperative peak plasma copeptin) in all patients, comparing those in remission with no remission (2.3 pmol/L [-0.5 to 8.2] vs 0.1 pmol/L [-0.1 to 2.2], P = 0.46). Horizontal lines = median. Whiskers = 25th and 75th interquartile ranges.

When those who developed DI or SIADH were excluded, there was no difference in peak postoperative copeptin in those in remission vs no remission (10.2 pmol/L [6.9-21.0] vs 5.4 pmol/L [4.6-7.3], P = 0.20). However, because the distribution of the peak postoperative copeptins was borderline normally distributed, parametric testing was also completed for this analysis, which showed a higher peak postoperative copeptin in remission (14.6 pmol/L [±10.9]) vs no remission (5.8 [±1.4], P = 0.03). There was no difference in the Δcopeptin for those in remission vs not in remission (5.1 pmol/L [0.3-19.5] vs 1.1 pmol/L [-0.1 to 2.2], P = 0.39) (Fig. 4). Preoperative copeptin was not different for those in remission (4.7 pmol/L [±2.4]) vs no remission (4.9 pmol/L [±20.3], P = 0.91). There was no association between serum cortisol and plasma copeptin over time postoperatively (Fig. 5).


Figure 4.

(A) Peak postoperative plasma copeptin excluding those who developed DI or SIADH, comparing those in remission with no remission (10.2 pmol/L [6.9-21.0] vs 5.4 pmol/L [4.6-7.3], P = 0.20). (B) ΔCopeptin (preoperative plasma copeptin subtracted from postoperative peak plasma copeptin) excluding those who developed DI or SIADH, comparing those in remission with no remission (5.1 pmol/L [0.3-19.5] vs 1.1 pmol/L [-0.1 to 2.2], P = 0.39). Horizontal lines = median. Whiskers = 25th and 75th interquartile ranges.

(A) Peak postoperative plasma copeptin excluding those who developed DI or SIADH, comparing those in remission with no remission (10.2 pmol/L [6.9-21.0] vs 5.4 pmol/L [4.6-7.3], P = 0.20). (B) ΔCopeptin (preoperative plasma copeptin subtracted from postoperative peak plasma copeptin) excluding those who developed DI or SIADH, comparing those in remission with no remission (5.1 pmol/L [0.3-19.5] vs 1.1 pmol/L [-0.1 to 2.2], P = 0.39). Horizontal lines = median. Whiskers = 25th and 75th interquartile ranges.


Figure 5.

Plasma copeptin and serum cortisol vs postoperative day for patients who did not develop DI or SIADH. Plasma copeptin (indicated by closed circle) and serum cortisol (indicated by “x”). Results shown as (median, 95% CI).

Plasma copeptin and serum cortisol vs postoperative day for patients who did not develop DI or SIADH. Plasma copeptin (indicated by closed circle) and serum cortisol (indicated by “x”). Results shown as (median, 95% CI).

All analyses here were repeated adjusting for serum sodium, and there were no differences by remission status for preoperative, peak postoperative, or Δcopeptin for all subjects or after excluding those who developed a water balance disorder (data not shown).

Copeptin and Water Balance Disorders

As expected, peak postoperative copeptin appeared to be different among patients who developed DI, SIADH, and those without any fluid balance disorder (P = 0.029), whereas patients with DI had lower median peak postoperative copeptin (4.4 pmol/L [2.4-6.9]) than those who developed no fluid abnormality (10.0 pmol/L [5.4-16.5], P = 0.04), the statistical difference was not present after correction for multiple comparisons (P = 0.13). Peak postoperative copeptin of patients with SIADH was 9.4 pmol/L (6.5-10.4) and did not differ from patients with DI (P = 0.32) or those with no fluid abnormality (P = 1.0). There was a difference in Δcopeptin levels among these subgroups (overall P = 0.043), which appeared to be driven by the lower Δcopeptin in those who developed DI (-1.2 pmol/L [-2.6 to 0.1]) vs in those with neither DI or SIADH (3.1 pmol/L [0-9.6], P = 0.05). However, this pairwise comparison did not reach statistical significance, even before correction for multiple comparisons (P = 0.16) (Fig. 6). Preoperative copeptin levels were also not different among the subgroups (P = 0.54).


Figure 6.

(A) Peak postoperative plasma copeptin, comparing those who developed DI, SIADH, or neither (P = 0.029 for comparison of all 3 groups). (B) ∆ Copeptin (preoperative plasma copeptin subtracted from postoperative peak plasma copeptin), comparing those who developed DI, SIADH, or neither (P = 0.043 for comparison of all 3 groups). Horizontal lines = median. Whiskers = 25th and 75th interquartile ranges. Top brackets = pairwise comparisons. P values presented are after Bonferroni correction for multiple comparisons.

(A) Peak postoperative plasma copeptin, comparing those who developed DI, SIADH, or neither (P = 0.029 for comparison of all 3 groups). (B) ∆ Copeptin (preoperative plasma copeptin subtracted from postoperative peak plasma copeptin), comparing those who developed DI, SIADH, or neither (P = 0.043 for comparison of all 3 groups). Horizontal lines = median. Whiskers = 25th and 75th interquartile ranges. Top brackets = pairwise comparisons. P values presented are after Bonferroni correction for multiple comparisons.

Association of Sodium and Copeptin

Longitudinal data, adjusting for subgroups (ie, DI, SIADH, neither), were analyzed. As expected, there was a group difference (P = 0.003) in serum sodium over time (all DI was missing preoperative serum sodium), with the difference being driven by DI vs SIADH (P = 0.007), and SIADH vs neither (P = 0.012). There was no group difference in plasma copeptin over POD by water balance status (P = 0.16) over time (Fig. 7). There was also no effect by remission status at 3 to 6 months for either serum sodium or plasma copeptin.


Figure 7.

(A) Serum sodium and (B) plasma copeptin by POD and water balance status longitudinal data, adjusting for subgroups (ie, DI, SIADH, neither). Data points at point 0 on the x-axis indicate preoperative values. As expected, there was a group difference (P = 0.003) in serum sodium over time (all with DI were missing preoperative serum sodium), with the difference being driven by DI vs SIADH (P = 0.007), and SIADH vs neither (P = 0.012). There was no group difference in plasma copeptin over POD by water balance status (P = 0.16) over time.

(A) Serum sodium and (B) plasma copeptin by POD and water balance status longitudinal data, adjusting for subgroups (ie, DI, SIADH, neither). Data points at point 0 on the x-axis indicate preoperative values. As expected, there was a group difference (P = 0.003) in serum sodium over time (all with DI were missing preoperative serum sodium), with the difference being driven by DI vs SIADH (P = 0.007), and SIADH vs neither (P = 0.012). There was no group difference in plasma copeptin over POD by water balance status (P = 0.16) over time.

Higher serum sodium levels from PODs 1 through 8 itself decreased the odds of remission (OR, 0.56; 95% CI, 0.42-0.73; P < 0.001) in all CD patients. Copeptin levels from these repeated measures adjusting for serum sodium did not correlate with remission status at 3 to 6 months’ follow-up (P = 0.38). There were no differences in preoperative, peak postoperative, or delta sodium levels by remission vs no remission in all patients and in those with no water balance disorders.

Discussion

AVP and CRH act synergistically to stimulate the secretion of ACTH and ultimately cortisol [12], and there is evidence that glucocorticoids act by way of negative feedback to suppress AVP secretion [1011-20]. Therefore, we hypothesized that a greater postoperative increase in plasma copeptin in those with CD in remission after TSS because of resolution of hypercortisolemia and resultant hypocortisolemia, compared with those not in remission with persistent hypercortisolemia and continued negative feedback, would be observed. Although a clear difference in peak postoperative and Δcopeptin was not observed in this study, a higher peak postoperative copeptin was found in those in remission after excluding those who developed DI/SIADH when analyzing this comparison with parametric testing, and it is possible that we did not have the power to detect a difference by nonparametric testing, given our small sample size. Therefore, postoperative plasma copeptin may be a useful early marker to predict remission of CD after TSS. The utility of this test may be limited to those who do not develop water balance disorders postoperatively. If a true increase in copeptin occurs for those in remission after treatment of CD, it is possible that this could be due to the removal of negative feedback from cortisol excess on pre-pro-AVP secretion, as hypothesized in this study. However, it is also possible that other factors may contribute to an increase in copeptin postoperatively, including from the stress response of surgery and postoperative hypocortisolism and resultant stimulation of pre-pro-AVP secretion from these physical stressors and/or from unrecognized SIADH.

It was anticipated that more severe hypercortisolism to be negatively correlated with preoperative plasma copeptin because of greater negative feedback on AVP. However, no association was found between preoperative plasma copeptin and markers of severity of hypercortisolism (MN cortisol, AM ACTH, UFC × ULN) in this study. Similarly, we would expect that the preoperative plasma copeptin would be lower compared with healthy individuals. However, comparisons of healthy individuals may be difficult because the fluid and osmolality status at the time of the sample could influence the plasma copeptin, and depending on those factors, copeptin could be appropriately low. A healthy control group with whom to compare the preoperative values was not available for this study, and the thirsted state was not standardized for the preoperative copeptin measurements. Future studies could be considered to determine if preoperative plasma copeptin is lower in patients with CD, or other forms of CS, compared with healthy subjects, with all subjects thirsted for an equivalent period. Further, if preoperative plasma copeptin is found to be lower in thirsted subjects with CS than a thirsted healthy control group, the plasma copeptin could potentially be a diagnostic test to lend support for or against the diagnosis of endogenous CS.

In the comparisons of those who developed DI, SIADH, or neither, no difference was found in the Δcopeptin. Peak copeptin was lower in DI compared with those without DI or SIADH (but not different from SIADH). Again, it is possible that there is a lower peak postoperative copeptin and change in copeptin in those with DI, but we may not have had the power to detect this in all of our analyses. These comparisons of copeptin among those with or without water balance disorders postoperatively are somewhat consistent with a prior study showing postoperative copeptin as a good predictor of development of DI, in which a plasma copeptin < 2.5 pmol/L measured on POD 0 accurately identified those who developed DI, and plasma copeptin > 30 pmol/L ruled out the development of DI postoperatively [29]. In the current study, 3 of 6 subjects with DI had a POD 1 plasma copeptin < 2.5 pmol/L, and none had a POD 1 plasma copeptin > 30 pmol/L. However, the study by Winzeler et al found that copeptin measured on POD 0 (within 12 hours after surgery) had the greatest predictive value, and POD 0 plasma copeptin was not available in our study. Further, we used the preoperative, peak, and delta plasma copeptin for analyses, so the early low copeptin levels may not have been captured in our data and analyses.

Additionally, this study revealed that increasing levels of serum sodium have lower odds of remission. Those who have an ACTH-producing adenoma that is not identified by magnetic resonance imaging and visual inspection intraoperatively have lower rates of remission and are more likely to have greater manipulation of the pituitary gland intraoperatively [32-36], and the latter may result in greater damage to the pituitary stalk or posterior pituitary, increasing the risk for development of DI and resultant hypernatremia.

A higher preoperative copeptin was associated with male sex and increasing BMI SDS. Increasing preoperative copeptin was also found in pubertal boys compared with pubertal girls, with no difference in copeptin between prepubertal boys and girls. It is particularly interesting to note that these associations were only in the preoperative plasma copeptin levels, but not the postoperative peak copeptin or Δcopeptin. Because the association of higher plasma in adult males and pubertal males in comparison to adult females and pubertal females, respectively, have been reported by others [2637-40], it raises the question of a change in the association of sex and BMI with plasma copeptin in the postoperative state. An effect of BMI or sex was not found by remission status, so it does not seem that the postoperative hypocortisolemic state for those in remission could explain this loss of association. However, this study may not have been powered to detect this.

Strengths of this study include the prospective nature of the study. Further, this is the first study assessing the utility of copeptin to predict remission after treatment of CD. Limitations of this study include the small sample size because of the rarity of the condition, difficulty in clinically diagnosing DI and SIADH, potential effect of post-TSS fluid balance disorders (particularly for those who may have developed transient partial DI or transient SIADH), lack of long-term follow-up, lack of any postoperative follow-up in 11 of the 44 total subjects, as well the observational nature of the study. Further, it is possible that pubertal status, sex, and BMI may have affected copeptin levels, which may have not been consistently detected because of lack of power. Lack of data on the timing of hydrocortisone replacement is an additional limitation of this study because postoperative glucocorticoid replacement could affect AVP secretion via negative feedback. Additional studies are needed to assess to further assess the role of vasopressin and measurement of copeptin in patients before and after treatment of CD.

A clear difference in peak postoperative plasma copeptin as an early marker to predict remission of CD after TSS was not found. Further studies with larger sample sizes are needed to further evaluate postoperative plasma copeptin as an early marker to predict remission of CD, though the utility of this test may be limited to those who do not develop water balance disorders postoperatively. Future studies comparing copeptin levels before and after treatment of adrenal CS would be of particular interest because this would minimize the risk of postoperative DI or SIADH which also influence copeptin levels. Additionally, comparison of thirsted preoperative plasma copeptin in those with endogenous CS and thirsted plasma copeptin in healthy controls could potentially provide evidence of whether or not preoperative plasma copeptin is lower in patients with CD, or other forms of CS, compared with healthy subjects. Further, if this is found to be true, it could potentially be a diagnostic test to lend support for or against endogenous CS.

Abbreviations


  • AVP

    arginine vasopressin

  • BMI

    body mass index

  • CD

    Cushing disease

  • CS

    Cushing syndrome

  • DI

    diabetes insipidus

  • HPA

    hypothalamic-pituitary-adrenal

  • IQR

    interquartile range

  • MN

    midnight

  • OR

    odds ratio

  • POD

    postoperative day

  • SDS

    SD score

  • SIADH

    syndrome of inappropriate antidiuresis

  • TSS

    transsphenoidal surgery

  • UFC

    urinary free cortisol

  • ULN

    upper limit of normal

Acknowledgments

The authors thank the patients and their families for participating in this study.

Funding

This work was supported by the Intramural Research Program, Eunice Kennedy Shriver National Institute of Child Health & Human Development (NICHD), National Institutes of Health.

Disclosures

C.A.S. holds patents on technologies involving PRKAR1A, PDE11A, GPR101, and related genes, and his laboratory has received research funding support by Pfizer Inc. for investigations unrelated to this project. C.A.S. is associated with the following pharmaceutical companies: ELPEN, Inc., H. Lunbeck A/S, and Sync. Inc.

Clinical Trial Information

ClinicalTrials.gov registration no. NCT00001595 (registered November 4, 1999).

Data Availability

Some or all datasets generated during and/or analyzed during the current study are not publicly available but are available from the corresponding author on reasonable request.

Published by Oxford University Press on behalf of the Endocrine Society 2022.
This work is written by (a) US Government employee(s) and is in the public domain in the US.