


Abstract
Introduction
Prostate cancer is the second most common cancer in males accounting for more than 900,000 cases per year (1). Adenocarcinoma is by far the most common subtype and affects more than 95% of the patients (2). Androgen deprivation therapy (ADT) remains the cornerstone of treatment for metastatic prostatic adenocarcinoma. Despite the initial response to androgen blockade, castration resistance often occurs via multiple mechanisms through androgen receptor (AR) pathway or others. Neuroendocrine dedifferentiation is one of the AR-independent castration resistance mechanisms that lead to an aggressive phenotype (3,4). While neuroendocrine differentiation in prostate cancer (NEPC) is a rare phenomenon in primary prostate cancer (<2%), it is detected in up to 10–17% of metastatic castrate-resistant prostate cancer (3). In addition, NEPC is often observed among males who have been previously treated with ADT or radiotherapy for prostate cancer (4,5). These types of tumors express typical neuroendocrine markers such chromogranin, synaptophysin (SYP) and specific neuronal enolase (NSE) but lack the expression of AR and AR-mediated genes (3,5). These tumors may originate de novo from a small population of neuroendocrine cells present in the prostate but usually occur from a population of luminal-derived castration-resistant cells through a neuroendocrine differentiation (NED) or trans-differentiation process. This phenotypic change can lead to a more aggressive clinical presentation with atypical manifestations and fewer effective treatment options. Bioactive substances produced by these cells can lead to paraneoplastic syndromes, including ectopic adrenocorticotropic hormone (ACTH) secretion. In the present study, a case of paraneoplastic Cushing syndrome (CS) in a patient with metastatic prostate cancer is presented. A review of the literature on this rare clinical entity is also presented to improve characterization of the clinical features and prognosis.
Case report
A 76-year old patient with a four-year history of metastatic prostate adenocarcinoma presented to the emergency department due to rapid-onset lower extremity weakness. The patient was first diagnosed with de novo metastatic prostate cancer in 2019 and was under ADT with enzalutamide and luteinizing hormone-releasing hormone analogue for the last four years. Biopsy of the prostate was performed in 2019 and revealed an adenocarcinoma Gleason 8 (5+3) of the prostate. Prostate-specific antigen (PSA) at initial diagnosis was 12.5 ng/ml and declined progressively to 0.007 ng/ml in 2022 after the initiation of enzalutamide. The patient now presented with lumbar pain and thus a magnetic resonance imaging (MRI) of the lumbar spine was performed which revealed the presence of an intraspinal metastasis in front of the fourth lumbar vertebra causing spinal cord compression. CT scans of the chest and abdomen showed an additional soft tissue metastasis on the left iliac bone and regional lymph node metastases. The patient started palliative radiotherapy at the metastatic foci of the O4 lumbar vertebrae and left iliac bone and was about to initiate chemotherapy with docetaxel. Of note, baseline PSA at disease progression was 0.48 ng/ml before the administration of chemotherapy.
The patient presented at the Emergency Department on the 13th of June 2023 with lower extremity muscle weakness and hypokalemia (2 mEq/l). He was hemodynamically stable and on inspection he appeared pale. Neurologically, he was oriented but exhibited emotional lability with bradypsychia. There were no focal neurological deficits in the lower extremities. Laboratory findings showed marked hypokalemia with serum potassium level of 2 mEq/l (3,5-5,1 mEq/l), metabolic alkalosis (HCO3: 48,5 mEq/l) and an elevated lactate dehydrogenase level of 461 U/l (135–225 U/l). Electrocardiogram revealed a prolonged QT interval with a corrected QT interval of 473 ms. The patient received intravenous and oral potassium supplements to prevent life-threatening arrhythmias and further investigation of hypokalemic alkalosis was initiated. The laboratory findings of the initial assessment are demonstrated in Table I.
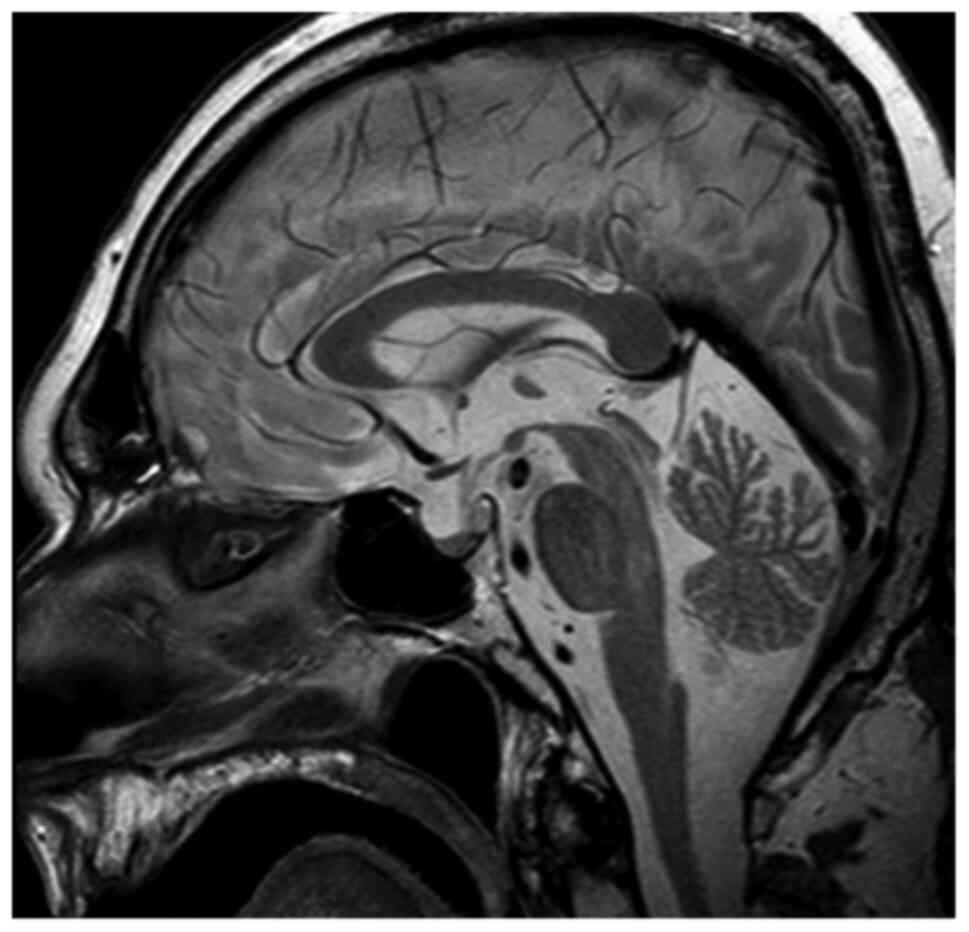
No episodes of diarrhea or vomiting were reported from recent medical history, thus potassium loss from the gastrointestinal tract was excluded. Additionally, urine electrolytes were within normal limits, hence renal potassium loss was also excluded. Therefore, endocrinological causes of hypokalemia were investigated. An adrenal protocol CT scan was performed which revealed no pathologic findings. Based on the aforementioned findings, evaluation of renin, aldosterone, ACTH and cortisol levels was requested. Τhe aforementioned tests revealed normal renin and aldosterone levels but elevated plasma cortisol levels >1,380 nmol/l (138–690 nmol/l) along with elevated plasma ACTH levels 194 pg/ml (<46 pg/ml). Measurement of 24 h urinary free cortisol revealed a value of 20,600.00 µg/gCr (1.00–119.00 µg/gCr). There was no suppression after both low-dose and high-dose dexamethasone challenge. Pituitary MRI was performed but revealed no pathologic findings (Fig. 1). Consequently, the patient was diagnosed with CS and ectopic ACTH production was considered the most likely diagnosis associated with paraneoplastic syndrome in the context of metastatic prostate adenocarcinoma.
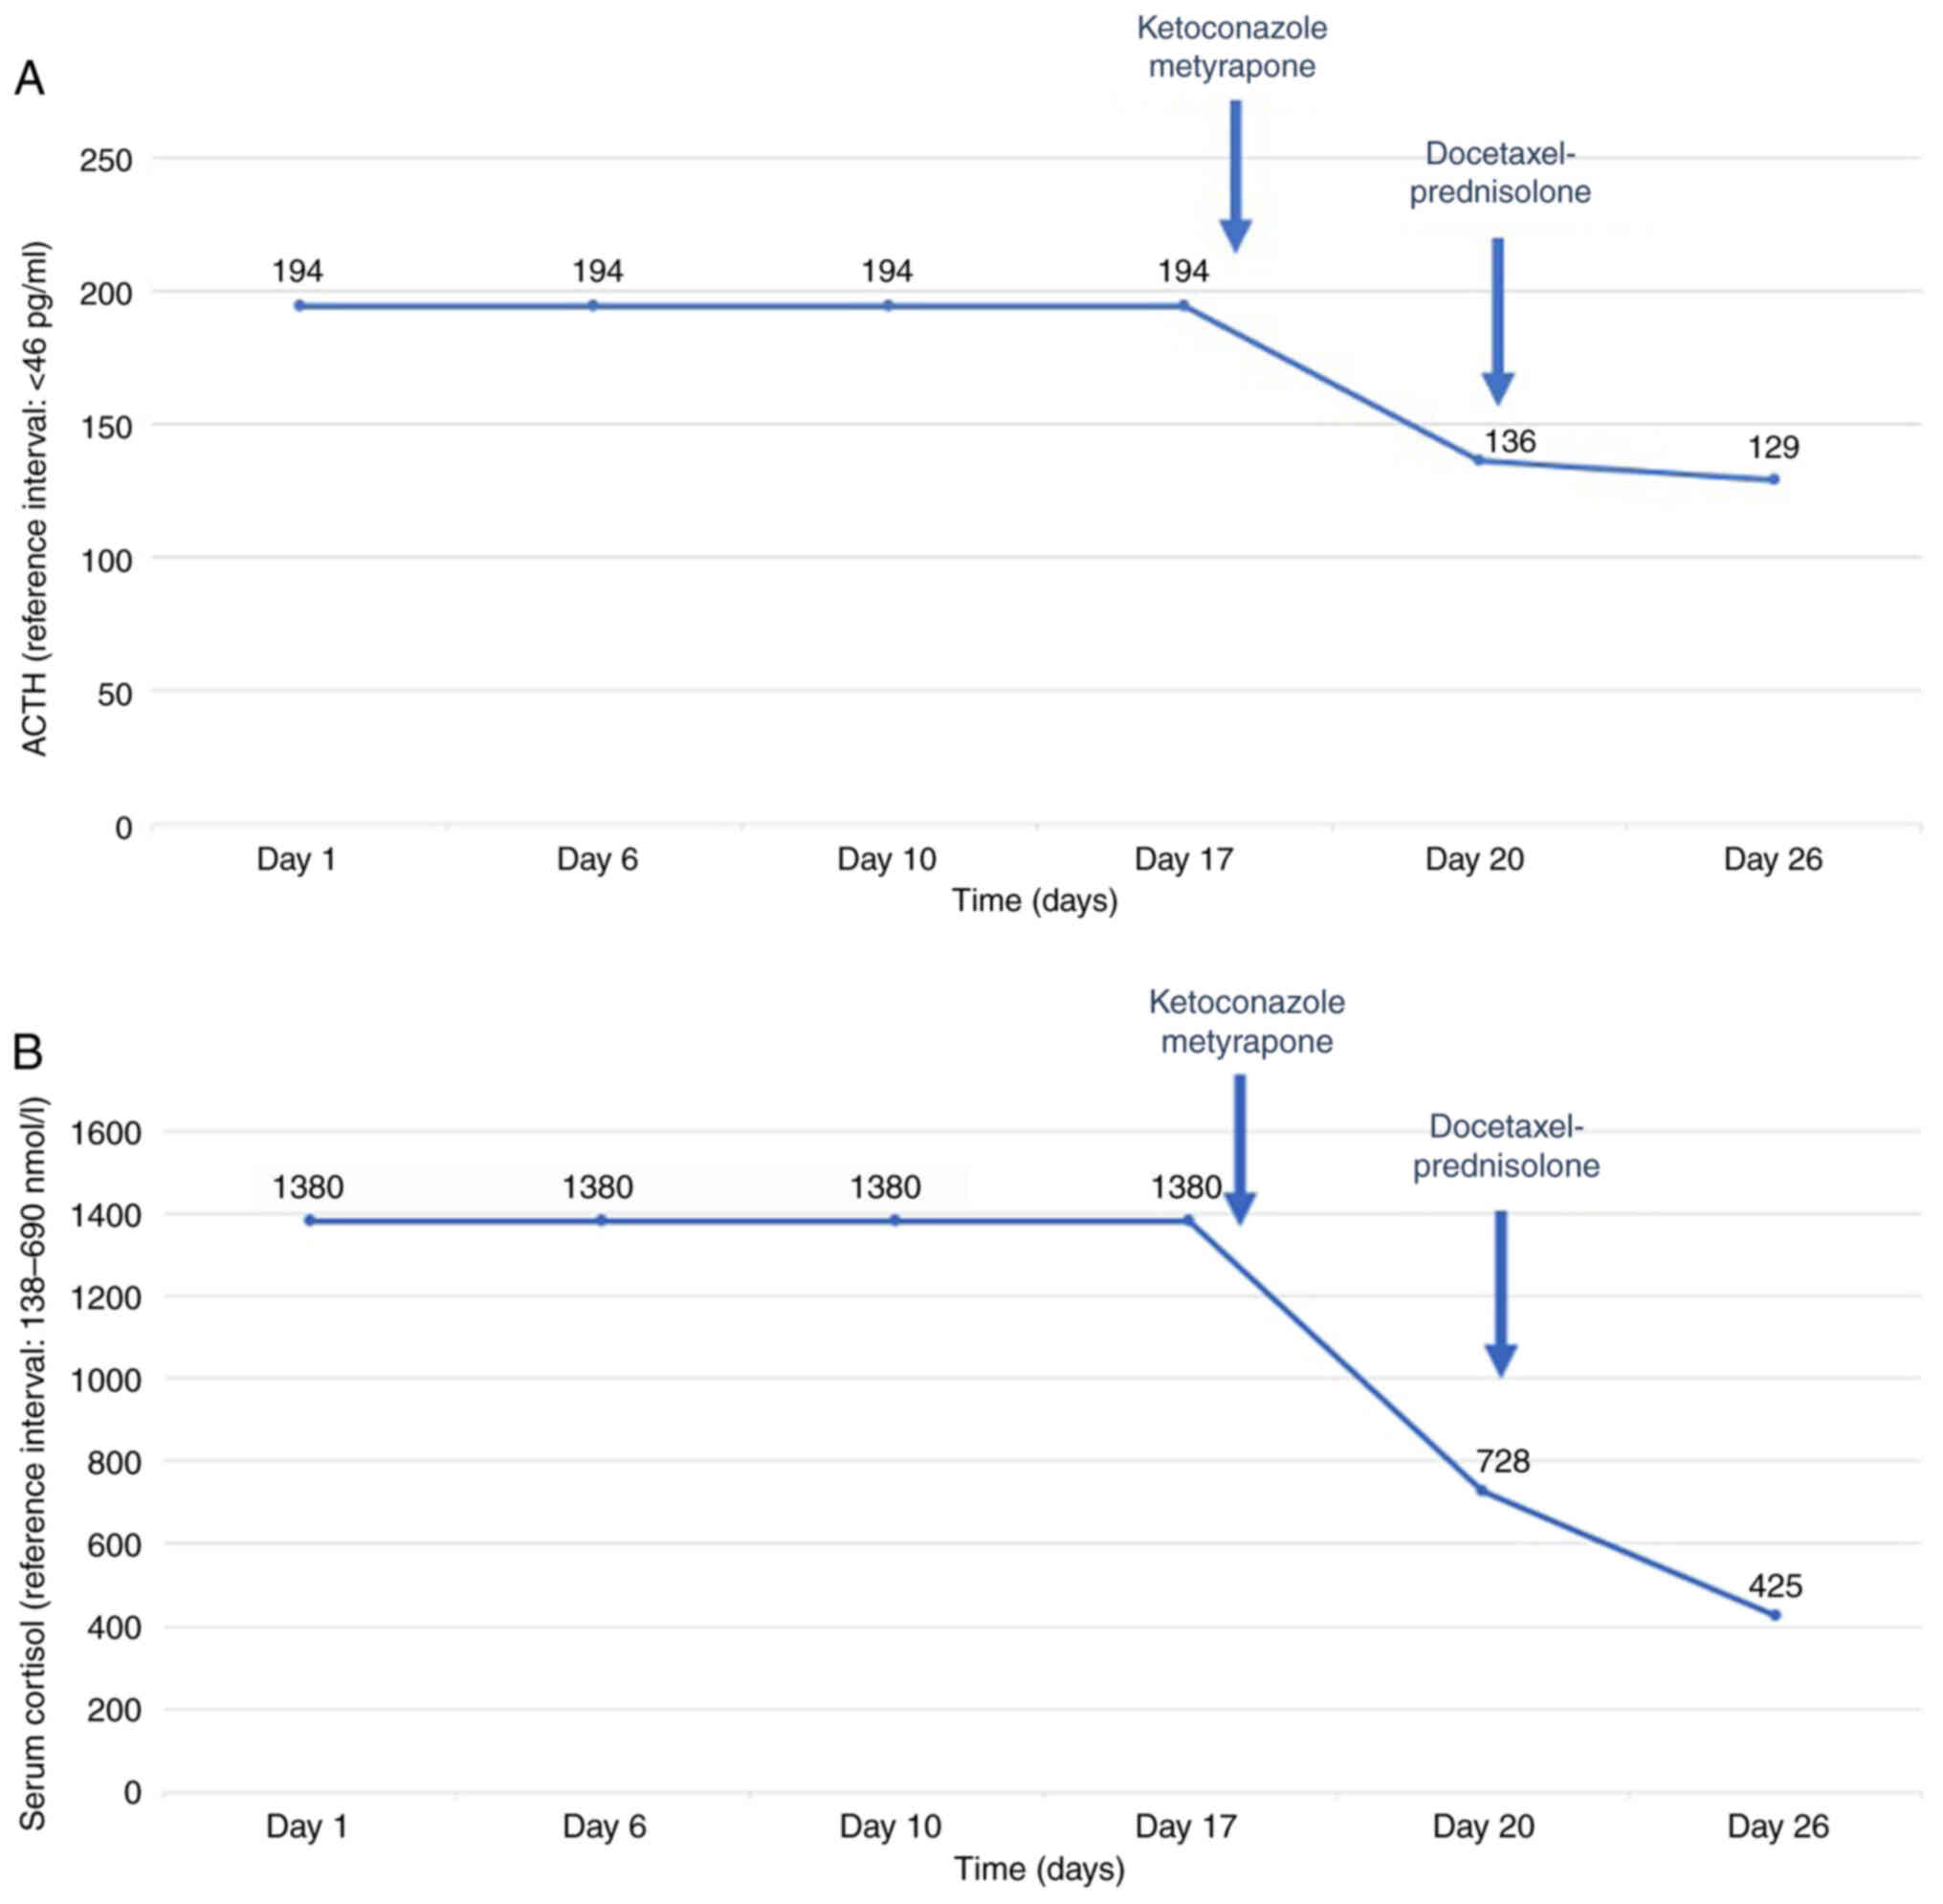
Clinical deterioration was acute and thus both symptomatic treatment and chemotherapy were initiated. Symptomatic treatment included oral potassium supplements, potassium-sparing diuretics, along with mineralocorticoid blockade (spironolactone). Treatment with ketoconazole 200 mg and metyrapone 500 mg three times per day, which block the steroid biosynthetic pathway, was initiated. Additionally, anticoagulant therapy was administered due to increased risk of thromboembolism. The patient remained under close monitoring throughout the course of his treatment and did not experience any treatment-related adverse events, including hepatotoxicity, which is most commonly reported. On the 10th day of treatment with ketoconazole and metyrapone, lab tests revealed a decrease in serum cortisol levels (425 nmol/l) and ACTH levels (129 pg/ml) along with the stabilization of potassium levels (Fig. 2A and B). Following the clinical and laboratory stabilization of the patient, chemotherapy with docetaxel 75 mg/m2 and prednisolone 5 mg bid was initiated. The patient was discharged from hospital after one month of hospitalization and continued chemotherapy. PSA declined from 0.48 to 0.22 ng/ml after three cycles of docetaxel administration. However, the patient died three months after initial presentation despite his initial response to treatment.
Discussion
Ectopic CS constitutes a rare paraneoplastic entity in prostate cancer. Ectopic CS as a paraneoplastic syndrome accounts for only 10–15% of CS cases and is mostly related to small cell lung cancer, pancreatic, thymus or thyroid carcinoma (6). This case highlights the urgency of diagnosing this entity and the importance of initiating treatment promptly. A case of ectopic ACTH production in a patient with castration-resistant metastatic prostate cancer who had previously received enzalutamide plus ADT is presented in the current study. Despite prompt diagnosis of ectopic Cushing disease and immediate initiation of treatment with ketoconazole and metyrapone, the patient deteriorated and eventually succumbed at three months after initial presentation with CS.
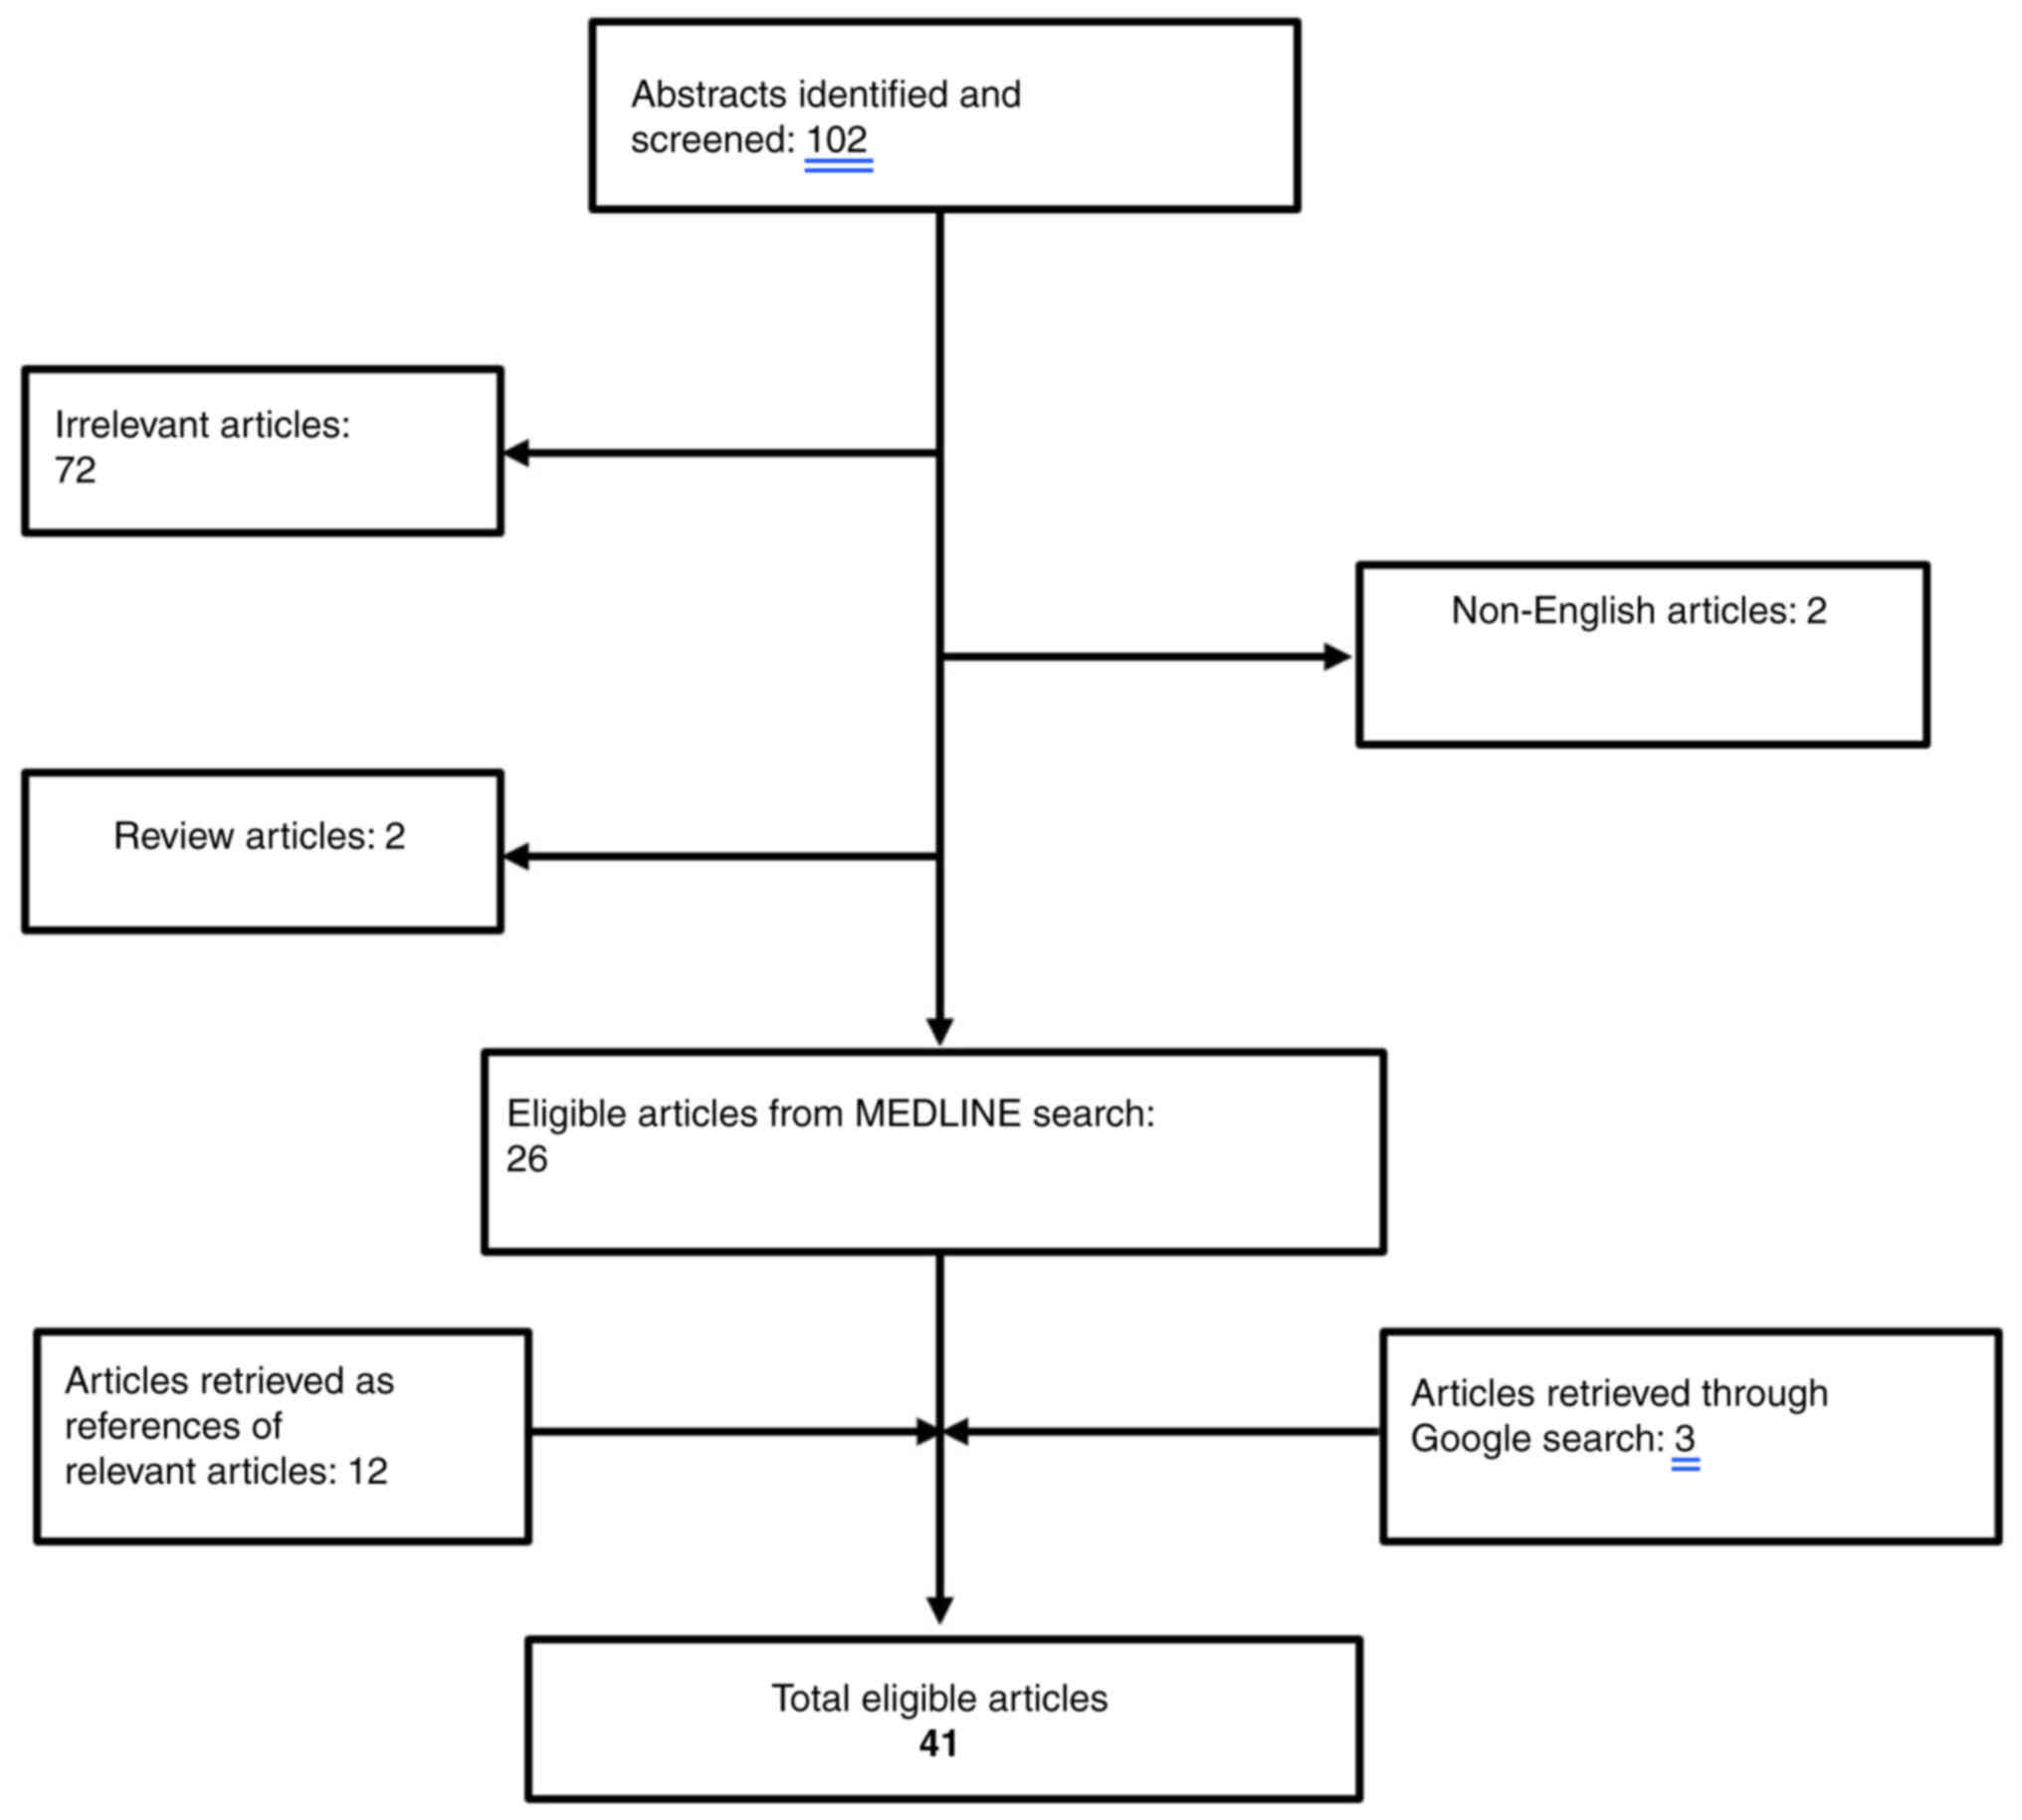
The existing literature for cases of CS related to prostate cancer was reviewed. The search strategy consisted of the following keywords: ‘cushing syndrome’ AND ‘prostate cancer’ that was applied to PUBMED bibliographical database (https://pubmed.ncbi.nlm.nih.gov/). Overall, a total of 102 papers were retrieved from the search algorithm. After the removal of two review articles (7,8) as well as two non-English papers (9,10), a total of 26 articles were considered eligible for this review (11–36). An additional search of the literature cited in the aforementioned papers revealed 12 more eligible papers (37–48). Finally, a google research was performed that revealed three additional papers (49–52). The search algorithm is illustrated in Fig. 3 and all the cases identified are summarized in Table II. Papers reporting neuroendocrine differentiation of the prostate with positive ACTH staining without clinical manifestations of ACTH serum production were excluded (53–58).
The first case reports of ectopic ACTH production in patients with prostatic carcinoma date back to the 1960s written by Webster et al (38) and Jarett et al (56). However, either tissue staining for ACTH was not available (38) or the primary tumor displayed no staining with the fluorescent anti-ACTH (56). The first well-documented case report of a patient with prostatic adenocarcinoma producing ACTH was presented by Newmark et al (37). Since then, several other cases of ectopic CS related to prostate cancer have been reported and are summarized in Table II. CS is a result of the ectopic production of ACTH in all of the cases except for two cases where corticotropin-releasing hormone (CRH) produced by the prostatic tumor is the driving cause (13,14). Indeed, CRH production from prostate cancer implicates 14% of the cases and is considered as an extremely rare source of ectopic ACTH (1–3%) (59). Histologically, CS emerged from small cell carcinoma of the prostate in 18 cases (11,13–15,20–22,24,25,27,29–31,33,34,47,50,51), neuroendocrine carcinoma of the prostate in five cases (17,21,26,28,32), prostate adenocarcinoma usually poorly differentiated/undifferentiated in 16 cases (16,18,19,23,35–39,41,42,44–46,49,52), anaplastic carcinoma in two cases (12,19) and carcinoid tumor of the prostate in another two cases (40,43). In the vast majority of the cases disease was metastatic with distant visceral metastases except for 11 cases (11,18,19,22,30,33,40,41,47,49,51) where disease was either locally advanced or metastatic only to lymph nodes.
Interestingly, the typical clinical manifestations of CS with centripetal obesity, moon facies, purple striae, buffalo hump and skin hyperpigmentation are rarely present (12,17,23,31,36,47). In most cases, muscle weakness, mental changes mild hypertension and edema are the presenting symptoms along with hypokalemic alkalosis and elevated glucose levels from laboratory tests (11,13–16,18–22,24–30,32–35,37–41,43–46,49–52). In the present case, the main clinical feature was limb muscle weakness combined with severe hypokalemic alkalosis. This comes in agreement with the existing literature which identifies hypokalemic alkalosis as often the only initial manifestation of the syndrome. This clinical picture reflects the rapid onset and aggressiveness of the syndrome. Most patients die early because of the underlying malignancy before the development of typical Cushing’s symptoms. Indeed, typical Cushing’s signs and symptoms develop under the condition of long-term hypercortisolism, so ectopic CS tends to present with less dramatic features, but higher blood pressure and more profound electrolyte abnormalities. Laboratory findings typically include hypokalemic alkalosis, elevated plasma glucose along with elevated plasma cortisol and ACTH levels and increased glucocorticoid excretion in urine as in the present case.
Initiation of supportive medication with oral or intravenous potassium supplements may be required. Treatment of CS is based on adrenal steroidogenesis inhibitors, including ketoconazole, metyrapone, mitotane or mifepristone (14,16–23,25–28,31–35,37,43–45,47,49–52) in over half of the cases (28/43; 65%) and more rarely etomidate (17,33) (2/43; 5%), as well as the newest therapeutic agent osilodrostat. Hypercortisolism may be controlled by blocking one or more adrenal enzymes, such as mitotane and metyrapone that inhibit 11β-hydroxylase or ketoconazole that inhibits both 17α-hydroxylase and 17,20-lyase. Interestingly, the somatostatin receptor ligand pasireotide is approved for patients with CS who have persistent or recurrent hypercortisolism and the dopamine agonist cabergoline facilitates initial normalization of urinary free cortisol levels and also improves the signs and symptoms of hypercortisolism. The cornerstone of treatment however remains the surgical removal of the tumor when is feasible. However, most of the ectopic ACTH-producing tumors are not resectable while patients may not be clinically fit enough for surgery. In these cases, supportive medication with antiglucocorticoid drugs is the preferred treatment option along with chemotherapy for the primary tumor. Chemotherapy was administered in one third of the cases (14/43) (13,17,19,21,22,24–27,31,35,47,52) and was mainly based on platinum-etoposide combinations. Whatever the treatment, prognosis is abysmal and median survival is as reported (Table II).
Neuroendocrine cells that lack androgen receptors are normally part of the normal prostate tissue and play a regulatory role in proliferation and secretion of the prostate epithelium (6,60). Neuroendocrine cells constitute only <1% of total epithelial cells found in prostate tissue and serve a paracrine or local regulatory role by secreting serotonin, calcitonin and other peptides (60). The inappropriate production of ACTH is attributed to these neuroendocrine cells that are part of the amine precursor uptake and decarboxylation (APUD) regulatory system (60). Neuroendocrine APUD cells are dispersed in numerous organs and systems in small concentrations such as gastrointestinal tract, lung and prostate and serve as one of the most important mechanisms of homeostasis. These cells have common biochemical and cytological properties as well as the ability to secrete polypeptides that include ACTH, neuron-specific enolase (NSE) and chromogranin A (CGA) (60). In vitro experiments have revealed that during androgen deprivation treatment (ADT), prostate adenocarcinoma cells have the capacity to transdifferentiate to a neuroendocrine (NE) phenotype, a process called neuroendocrine trans-differentiation. De novo prostate neuroendocrine carcinoma (small cell or large cell) is a rare entity (<2%), however treatment-emergent neuroendocrine neoplasms account for 10–17% of patients with metastatic CRPC (3). Indeed, a substantial population of pre-treated end-stage prostate cancer patients show salient features of de novo neuroendocrine small cell carcinomas, mostly with an aggressive behavior and often with visceral metastases. Radiotherapy and androgen deprivation therapy activate the process of neuroendocrine dedifferentiation through the following mechanisms: Either they induce malignant transformation of neuroendocrine cells within adenocarcinoma cells or they facilitate the growth of pre-existing neuroendocrine cells. In this manner, cancer cells lack androgen receptors and transform into castration-resistant prostate cancer cells resulting in disease progression. Although most patients are not routinely biopsied in end-stage disease, it has been estimated that at least 25% of the patients with advanced prostate cancer will develop neuroendocrine prostate cancer under androgen deprivation pressure (4). Neuroendocrine prostate carcinoma differs from the conventional adenocarcinoma of the prostate histologically by expressing neuroendocrine markers such as chromogranin A, SYP, CD56, and NSE instead of prostate adenocarcinoma markers like AR, P501S, PSMA, PSAP and PSA (61). Of note, the introduction of next generation antiandrogen agents like enzalutamide or abiraterone resulted in an increase of neuroendocrine prostate carcinomas from 6.3 to 13.3% after 2012 (3). Paraneoplastic syndromes associated with prostate cancer are rare. However, when they occur, they constitute the initial clinical manifestation of prostate cancer in up to 70% of cases and a sign of progression to castration-resistance in 20% of cases (62). Paraneoplastic syndromes often related to prostate cancer include endocrine syndromes (inappropriate antidiuretic hormone secretion, CS, hypercalcemia) as well as hematological disorders and neurological syndromes (62).
Pure carcinoids of the prostate are rare, while mixed carcinomas of prostate adenocarcinoma and carcinoid are more frequent. Small cell prostate carcinoma accounts for ~0.5–2% of prostate carcinoma cases (63). It is thought that small cell carcinoma of the prostate has a common origin with prostate adenocarcinoma as ~40–50% of men with small cell carcinoma of the prostate have a prior or concurrent history of prostatic adenocarcinoma (63). Based on the aforementioned information, ectopic ACTH production mainly emerges from the neuroendocrine transformation of the preexisting prostate adenocarcinoma. This raises the question of performing re-biopsy to histologically confirm the diagnosis. However, the imminent need to initiate treatment early may postpone the performance of a confirmatory re-biopsy. As known, the state of extreme hypercortisolism creates a fertile environment for infections. Therefore, the prompt initiation of targeted treatment with metyrapone or ketoconazole and potassium supplements to target hypercortisolism in combination with chemotherapy for the underlying malignancy may be deemed more urgent. This case was thoroughly discussed in multidisciplinary medical meetings focusing on the best therapeutic approach. In accordance with the present case, re-biopsy was not performed in most of the cases identified in the existing literature mainly due to the fast deterioration of the patient and the subsequent lack of time. Indeed, most patients die from sepsis secondary to uncontrolled CS. This is the reason that suppression of the hypercortisolism is urgent and should not be delayed to identify the source of CS.
In conclusion, the ectopic CS can be a clinical manifestation of prostate cancer. It requires timely diagnosis and aggressive treatment to avoid life-threatening complications of hypercortisolemia. The present case highlighted the necessity of multiple laboratory and imaging examinations required for the definitive diagnosis of CS, with the ultimate goal of initiating targeted therapy promptly.
Acknowledgements
Not applicable.
Funding
Funding: No funding was received.
Availability of data and materials
The data generated in the present study may be found in the PUBMED database at the following URL: https://pubmed.ncbi.nlm.nih.gov.
Authors’ contributions
FZ, MAD and SAP conceptualized the study. AA, KG and KS conducted the investigation. FZ, MAD and SAP supervised the study. AA, KG, SA and KS were involved in drafting the original manuscript and revised it critically for important intellectual content. SA also made a substantial contribution to the analysis and interpretation of the data, gave final approval for the manuscript to be published and agreed to be accountable for all aspects of the work. All authors read and approved the final manuscript. KG and AA confirm the authenticity of all the raw data.
Ethics approval and consent to participate
Not applicable.
Patient consent for publication
The patient provided written informed consent for this case study to be published.
Competing interests
MAD has received honoraria from participation in advisory boards from Amgen, Bristol-Myers-Squibb, Celgene, Janssen, Takeda. FZ has received honoraria for lectures and has served in an advisory role for Astra-Zeneca, Daiichi, Eli-Lilly, Merck, Novartis, Pfizer, and Roche. The remaining authors declare no competing interests.
References
| 1 | Bray F, Ferlay J, Soerjomataram I, Siegel RL, Torre LA and Jemal A: Global cancer statistics 2018: GLOBOCAN estimates of incidence and mortality worldwide for 36 cancers in 185 countries. CA Cancer J Clin. 68:394–424. 2018. View Article : Google Scholar : PubMed/NCBI |
| 2 | Bergengren O, Pekala KR, Matsoukas K, Fainberg J, Mungovan SF, Bratt O, Bray F, Brawley O, Luckenbaugh AN, Mucci L, et al: 2022 update on prostate cancer epidemiology and risk Factors-A systematic review. Eur Urol. 84:191–206. 2023. View Article : Google Scholar : PubMed/NCBI |
| 3 | Merkens L, Sailer V, Lessel D, Janzen E, Greimeier S, Kirfel J, Perner S, Pantel K, Werner S and von Amsberg G: Aggressive variants of prostate cancer: Underlying mechanisms of neuroendocrine transdifferentiation. J Exp Clin Cancer Res. 41:462022. View Article : Google Scholar : PubMed/NCBI |
| 4 | Gupta K and Gupta S: Neuroendocrine differentiation in prostate cancer: Key epigenetic players. Transl Cancer Res. 6 (Suppl 1):S104–S108. 2017. View Article : Google Scholar : PubMed/NCBI |
| 5 | Hu CD, Choo R and Huang J: Neuroendocrine differentiation in prostate cancer: A mechanism of radioresistance and treatment failure. Front Oncol. 5:902015. View Article : Google Scholar : PubMed/NCBI |
| 6 | Ejaz S, Vassilopoulou-Sellin R, Busaidy NL, Hu MI, Waguespack SG, Jimenez C, Ying AK, Cabanillas M, Abbara M and Habra MA: Cushing’s syndrome secondary to ectopic ACTH secretion: The University of Texas MD Anderson Cancer Center Experience. Cancer. 117:4381–4389. 2011. View Article : Google Scholar : PubMed/NCBI |
| 7 | Matzkin H and Braf Z: Paraneoplastic syndromes associated with prostatic carcinoma. J Urol. 138:1129–1133. 1987. View Article : Google Scholar : PubMed/NCBI |
| 8 | Dhom G: Unusual prostatic carcinomas. Pathol Res Pract. 186:28–36. 1990. View Article : Google Scholar : PubMed/NCBI |
| 9 | Yonaha M, Tanaka M, Kawano T, Sugiyama M, Nishikawa T and Sasano K: An autopsy case of ACTH producing prostate neoplasms with Cushing’s syndrome. Nihon Naika Gakkai Zasshi. 81:2005–2006. 1992.(In Japanese). View Article : Google Scholar : PubMed/NCBI |
| 10 | Ciudin A, Huguet Perez J, Ribal Caparros MJ and Alcaraz Asensio A: Cushing syndrome and prostate cancer recurrence with undetectable prostate-specific antigen. Med Clin (Barc). 140:430–431. 2013.(In Spanish). View Article : Google Scholar : PubMed/NCBI |
| 11 | Wenk RE, Bhagavan BS, Levy R, Miller D and Weisburger W: Ectopic ACTH, prostatic oat cell carcinoma, and marked hypernatremia. Cancer. 40:773–778. 1977. View Article : Google Scholar : PubMed/NCBI |
| 12 | Vuitch MF and Mendelsohn G: Relationship of ectopic ACTH production to tumor differentiation: A morphologic and immunohistochemical study of prostatic carcinoma with Cushing’s syndrome. Cancer. 47:296–299. 1981. View Article : Google Scholar : PubMed/NCBI |
| 13 | Carey RM, Varma SK, Drake CR, Thorner MO, Kovacs K, Rivier J and Vale W: Ectopic secretion of corticotropin-releasing factor as a cause of Cushing’s syndrome. A clinical, morphologic, and biochemical study. N Engl J Med. 311:13–20. 1984. View Article : Google Scholar : PubMed/NCBI |
| 14 | Fjellestad-Paulsen A, Abrahamsson PA, Bjartell A, Grino M, Grimelius L, Hedeland H and Falkmer S: Carcinoma of the prostate with Cushing’s syndrome. A case report with histochemical and chemical demonstration of immunoreactive corticotropin-releasing hormone in plasma and tumoral tissue. Acta Endocrinol (Copenh). 119:506–516. 1988.PubMed/NCBI |
| 15 | Haukaas SA, Halvorsen OJ, Nygaard SJT and Paus E: Cushing’s syndrome in prostate cancer. An aggressive course of prostatic malignancy. Urol Int. 63:126–129. 1999. View Article : Google Scholar : PubMed/NCBI |
| 16 | Rickman T, Garmany R, Doherty T, Benson D and Okusa MD: Hypokalemia, metabolic alkalosis, and hypertension: Cushing’s syndrome in a patient with metastatic prostate adenocarcinoma. Am J Kidney Dis. 37:838–846. 2001. View Article : Google Scholar : PubMed/NCBI |
| 17 | Johnson TN and Canada TW: Etomidate use for Cushing’s syndrome caused by an ectopic adrenocorticotropic hormone-producing tumor. Ann Pharmacother. 41:350–353. 2007. View Article : Google Scholar : PubMed/NCBI |
| 18 | Kataoka K, Akasaka Y, Nakajima K, Nagao K, Hara H, Miura K and Ishii N: Cushing syndrome associated with prostatic tumor adrenocorticotropic hormone (ACTH) expression after maximal androgen blockade therapy. Int J Urol. 14:436–439. 2007. View Article : Google Scholar : PubMed/NCBI |
| 19 | Nimalasena S, Freeman A and Harland S: Paraneoplastic Cushing’s syndrome in prostate cancer: A difficult management problem. BJU Int. 101:424–427. 2008. View Article : Google Scholar : PubMed/NCBI |
| 20 | Alwani RA, Neggers SJ, van der Klift M, Baggen MG, van Leenders GJ, van Aken MO, van der Lely AJ, de Herder WW and Feelders RA: Cushing’s syndrome due to ectopic ACTH production by (neuroendocrine) prostate carcinoma. Pituitary. 12:280–283. 2009. View Article : Google Scholar : PubMed/NCBI |
| 21 | Rajec J, Mego M, Sycova-Mila Z, Obertova J, Brozmanova K and Mardiak J: Paraneoplastic Cushing’s syndrome as the first sign of progression of prostate cancer. Bratisl Lek Listy. 109:362–363. 2008.PubMed/NCBI |
| 22 | Alshaikh OM, Al-Mahfouz AA, Al-Hindi H, Mahfouz AB and Alzahrani AS: Unusual cause of ectopic secretion of adrenocorticotropic hormone: Cushing syndrome attributable to small cell prostate cancer. Endocr Pract. 16:249–254. 2010. View Article : Google Scholar : PubMed/NCBI |
| 23 | Ramon I, Kleynen P, Valsamis J, Body JJ and Karmali R: Hypophosphatemia related to paraneoplastic Cushing syndrome in prostate cancer: Cure after bilateral adrenalectomy. Calcif Tissue Int. 89:442–445. 2011. View Article : Google Scholar : PubMed/NCBI |
| 24 | Rueda-Camino JA, Losada-Vila B, De Ancos-Aracil CL, Rodríguez-Lajusticia L, Tardío JC and Zapatero-Gaviria A: Small cell carcinoma of the prostate presenting with Cushing Syndrome. A narrative review of an uncommon condition. Ann Med. 48:293–299. 2016. View Article : Google Scholar : PubMed/NCBI |
| 25 | Shrosbree J, Pokorny A, Stone E, Epstein R, Mccormack A and Greenfield JR: Ectopic Cushing syndrome due to neuroendocrine prostatic cancer. Intern Med J. 46:630–632. 2016. View Article : Google Scholar : PubMed/NCBI |
| 26 | Ramalingam S, Eisenberg A, Foo WC, Freedman J, Armstrong AJ, Moss LG and Harrison MR: Treatment-related neuroendocrine prostate cancer resulting in Cushing’s syndrome. Int J Urol. 23:1038–1041. 2016. View Article : Google Scholar : PubMed/NCBI |
| 27 | Elston MS, Crawford VB, Swarbrick M, Dray MS, Head M and Conaglen JV: Severe Cushing’s syndrome due to small cell prostate carcinoma: A case and review of literature. Endocr Connect. 6:R80–R86. 2017. View Article : Google Scholar : PubMed/NCBI |
| 28 | Murphy N, Shen J, Shih A, Liew A, Khalili H, Yaskiv O, Katona K, Lee A and Zhu XH: Paraneoplastic syndrome secondary to treatment emergent neuroendocrine tumor in metastatic Castration-resistant prostate cancer: A unique case. Clin Genitourin Cancer. 17:e56–e60. 2019. View Article : Google Scholar : PubMed/NCBI |
| 29 | Kleinig P and Russell P: Lesson of the month 2: An unusual cause of depression in an older man: Cushing’s syndrome resulting from metastatic small cell cancer of the prostate. Clin Med (Lond). 18:432–434. 2018. View Article : Google Scholar : PubMed/NCBI |
| 30 | Klomjit N, Rowan DJ, Kattah AG, Bancos I and Taler SJ: New-Onset resistant hypertension in a newly diagnosed prostate cancer patient. Am J Hypertens. 32:1214–1217. 2019. View Article : Google Scholar : PubMed/NCBI |
| 31 | Soundarrajan M, Zelada H, Fischer JV and Kopp P: Ectopic adrenocorticotropic hormone syndrome due to metastatic prostate cancer with neuroendocrine differentiation. AACE Clin Case Reports. 5:e192–e196. 2019. View Article : Google Scholar : PubMed/NCBI |
| 32 | Schepers LM, Kisters JMH, Wetzels C and Creemers GJ: Hypokalaemia and peripheral oedema in a Cushingoid patient with metastatic prostate cancer. Neth J Med. 78:401–403. 2020.PubMed/NCBI |
| 33 | Riaza Montes M, Arredondo Calvo P and Gallego Sánch JA: Small cell metastatic prostate cancer with ectopic adrenocorticotropic hormone hypersecretion: A case report. Ann Palliat Med. 10:12911–12914. 2021. View Article : Google Scholar : PubMed/NCBI |
| 34 | Fernandes R, Dos Santos J, Reis F and Monteiro S: Cushing syndrome as a manifestation of neuroendocrine prostate cancer: A rare presentation within a rare tumor. Cureus. 13:e181602021.PubMed/NCBI |
| 35 | Zeng W and Khoo J: Challenging case of ectopic ACTH secretion from prostate adenocarcinoma. Case Rep Endocrinol. 2022:37399572022.PubMed/NCBI |
| 36 | Hassan B, Yazbeck Y, Akiki V, Salti I and Tfayli A: ACTH-secreting metastatic prostate cancer with neuroendocrine differentiation. BMJ Case Rep. 15:e2479972022. View Article : Google Scholar : PubMed/NCBI |
| 37 | Newmark SR, Dluhy RG and Bennett AH: Ectopic adrenocorticotropin syndrome with prostatic carcinoma. Urology. 2:666–668. 1973. View Article : Google Scholar : PubMed/NCBI |
| 38 | Webster GD Jr, Touchstone JC and Suzuki M: Adrenocortical hyperplasia occurring with metastatic carcinoma of the prostate: Report of a case exhibiting increased urinary aldosterone and glucocorticoid excretion. J Clin Endocrinol Metab. 19:967–979. 1959. View Article : Google Scholar : PubMed/NCBI |
| 39 | Lovern WJ, Fariss BL, Wettlaufer JN and Hane S: Ectopic ACTH production in disseminated prostatic adenocarcinoma. Urology. 5:817–820. 1975. View Article : Google Scholar : PubMed/NCBI |
| 40 | Slater D: Carcinoid tumour of the prostate associated with inappropriate ACTH secretion. Br J Urol. 57:591–592. 1985. View Article : Google Scholar : PubMed/NCBI |
| 41 | Molland EA: Prostatic adenocarcinoma with ectopic ACTH production. Br J Urol. 50:358. 1978. View Article : Google Scholar : PubMed/NCBI |
| 42 | Wise HM, Pohl AL, Gazzaniga A and Harrison JH: Hyperadrenocorticism associated with ‘reactivated’ prostatic carcinoma. Surgery. 57:655–664. 1965.PubMed/NCBI |
| 43 | Ghali VS and Garcia RL: Prostatic adenocarcinoma with carcinoidal features producing adrenocorticotropic syndrome. Immunohistochemical study and review of the literature. Cancer. 54:1043–1048. 1984. View Article : Google Scholar : PubMed/NCBI |
| 44 | Hussein WI, Kowalyk S and Hoogwerf BJ: Ectopic adrenocorticotropic hormone syndrome caused by metastatic carcinoma of the prostate: Therapeutic response to ketoconazole. Endocr Pract. 8:381–384. 2002. View Article : Google Scholar : PubMed/NCBI |
| 45 | Statham BN, Pardoe TH and Mir MA: Response of ectopic prostatic ACTH production to metyrapone. Postgrad Med J. 57:467–468. 1981. View Article : Google Scholar : PubMed/NCBI |
| 46 | Hall TC: Symptomatic hypokalemic alkalosis in hyperadrenocorticism secondary to carcinoma of the prostate. Cancer. 21:190–192. 1968. View Article : Google Scholar : PubMed/NCBI |
| 47 | Balestrieri A, Magnani E and Nuzzo F: Unusual Cushing’s syndrome and hypercalcitoninaemia due to a small cell prostate carcinoma. Case Rep Endocrinol. 2016:63080582016.PubMed/NCBI |
| 48 | Asa SL, Kovacs K, Vale W, Petrusz P and Vecsei P: Immunohistologic localization of corticotrophin-releasing hormone in human tumors. Am J Clin Pathol. 87:327–333. 1987. View Article : Google Scholar : PubMed/NCBI |
| 49 | Lemoinne S, Baudel JL, Galbois A, Offenstadt G and Maury E: Suddzith Cushing’s Syndrome. Open Endocrinol J. 4:1–2. 2014. View Article : Google Scholar |
| 50 | Takeuchi M, Sato J, Manaka K, Tanaka M, Matsui H, Sato Y, Kume H, Fukayama M, Iiri T, Nangaku M and Makita N: Molecular analysis and literature-based hypothesis of an immunonegative prostate small cell carcinoma causing ectopic ACTH syndrome. Endocr J. 66:547–554. 2019. View Article : Google Scholar : PubMed/NCBI |
| 51 | Atmaca M, Temiz C, Sebile DH, Dökmetaș M and Kiliçli F: A rare cause of ectopic cushing syndrome: Prostate cancer. Endocr Abstr. 70:EP3482020. |
| 52 | Bloomer Z, Teague J and Vietor N: Ectopic Cushing’s From metastatic prostate cancer. J Endocr Soc. 5:A7572021. View Article : Google Scholar |
| 53 | Nadal R, Schweizer M, Kryvenko ON, Epstein JI and Eisenberger MA: Small cell carcinoma of the prostate. Nat Rev Urol. 1:213–219. 2014. View Article : Google Scholar : PubMed/NCBI |
| 54 | Rojas-Corona RR, Chen L and Mahadevia PS: Prostatic carcinoma with endocrine features. A report of a neoplasm containing multiple immunoreactive hormonal substances. Am J Clin Pathol. 88:759–762. 1987. View Article : Google Scholar : PubMed/NCBI |
| 55 | Abrahamsson PA, Wadström LB, Alumets J, Falkmer S and Grimelius L: Peptide-hormone- and serotonin-immunoreactive tumour cells in carcinoma of the prostate. Pathol Res Pract. 182:298–307. 1987. View Article : Google Scholar : PubMed/NCBI |
| 56 | Jarett L, Lacy PE and Kipnis DM: Characterization by immunofluorescence of an Acth-like substance in nonpituitary tumors from patients with hyperadrenocorticism. J Clin Endocrinol Metab. 24:543–549. 1964. View Article : Google Scholar : PubMed/NCBI |
| 57 | Turbat-Herrera EA, Herrera GA, Gore I, Lott RL, Grizzle WE and Bonnin JM: Neuroendocrine differentiation in prostatic carcinomas. A retrospective autopsy study. Arch Pathol Lab Med. 112:1100–1105. 1988.PubMed/NCBI |
| 58 | Capella C, Usellini L, Buffa R, Frigerio B and Solcia E: The endocrine component of prostatic carcinomas, mixed adenocarcinoma-carcinoid tumours and non-tumour prostate. Histochemical and ultrastructural identification of the endocrine cells. Histopathology. 5:175–192. 1981. View Article : Google Scholar : PubMed/NCBI |
| 59 | Shahani S, Nudelman RJ, Nalini R, Kim HS and Samson SL: Ectopic corticotropin-releasing hormone (CRH) syndrome from metastatic small cell carcinoma: A case report and review of the literature. Diagn Pathol. 5:562010. View Article : Google Scholar : PubMed/NCBI |
| 60 | di Sant’Agnese PA: Neuroendocrine differentiation in carcinoma of the prostate diagnostic, prognostic, and therapeutic implications. Cancer. 70 (1 Suppl):S254–S268. 1992. View Article : Google Scholar |
| 61 | Parimi V, Goyal R, Poropatich K and Yang XJ: Neuroendocrine differentiation of prostate cancer: A review. Am J Clin Exp Urol. 2:273–285. 2014.PubMed/NCBI |
| 62 | Hong MK, Kong J, Namdarian B, Longano A, Grummet J, Hovens CM, Costello AJ and Corcoran NM: Paraneoplastic syndromes in prostate cancer. Nat Rev Urol. 7:681–692. 2010. View Article : Google Scholar : PubMed/NCBI |
| 63 | Nadal R, Schweizer M, Kryvenko ON, Epstein JI and Eisenberger MA: Small cell carcinoma of the prostate. Nat Rev Urol. 11:213–219. 2014. View Article : Google Scholar : PubMed/NCBI |
Related Articles
-
- Paraneoplastic encephalomyelitis: Is it an oropharyngeal or a lung cancer complication?
- Diagnosis and treatment of adrenocorticotrophic hormone-independent macronodular adrenocortical hyperplasia: A report of 23 cases in a single center
- Carcinoid syndrome from a carcinoid tumor of the pancreas without liver metastases: A case report and literature review
- A case of membranous glomerulopathy associated with lung cancer and review of the literature
- Reversible intrahepatic cholestasis in metastatic prostate cancer: An uncommon paraneoplastic syndrome
From https://www.spandidos-publications.com/10.3892/ol.2024.14550
Filed under: Cancer, Cushing's, Diagnostic Testing | Tagged: ACTH, Cushing Syndrome, ectopic, lung cancer, prostate cancer | Leave a comment »


