Ectopic Cushing’s Syndrome From a Corticotropin-Releasing Hormone-Secreting Medullary Thyroid Carcinoma: a Rare Pitfall af Inferior Petrosal Sinus Sampling

Abstract

Summary

This case report describes a rare presentation of ectopic Cushing’s syndrome (CS) due to ectopic corticotropin-releasing hormone (CRH) production from a medullary thyroid carcinoma (MTC).

The patient, a 69-year-old man, presented with symptoms of muscle weakness, facial plethora, and easy bruising.

An inferior petrosal sinus sampling test (IPSS) demonstrated pituitary adrenocorticotrophic hormone (ACTH) secretion, but a whole-body somatostatin receptor scintigraphy (68Ga-DOTATOC PET/CT) revealed enhanced uptake in the right thyroid lobe which, in addition to a grossly elevated serum calcitonin level, was indicative of an MTC. A 18F-DOPA PET/CT scan supported the diagnosis, and histology confirmed the presence of MTC with perinodal growth and regional lymph node metastasis.

On immunohistochemical analysis, the tumor cell stained positively for calcitonin and CRH but negatively for ACTH. Distinctly elevated plasma CRH levels were documented. The patient therefore underwent thyroidectomy and bilateral adrenalectomy.

This case shows that CS caused by ectopic CRH secretion may masquerade as CS due to a false positive IPSS test. It also highlights the importance of considering rare causes of CS when diagnostic test results are ambiguous.

Learning points

  • Medullary thyroid carcinoma may secrete CRH and cause ectopic CS.
  • Ectopic CRH secretion entails a rare pitfall of inferior petrosal sinus sampling yielding a false positive test.
  • Plasma CRH measurements can be useful in selected cases.

Background

The common denominator of Cushing’s syndrome (CS) is autonomous hypersecretion of cortisol (1) and it is subdivided into ACTH-dependent and ACTH-independent causes. The majority of CS cases are ACTH-dependent (80–85%) with a pituitary corticotroph tumor as the most prevalent cause (Cushing’s disease), and less frequently an ectopic ACTH-producing tumor (2). The gold standard method to ascertain the source of ACTH secretion in CS patients is inferior petrosal sinus sampling (IPSS) with measurement of plasma ACTH levels in response to systemic corticotropin-releasing hormone (CRH) stimulation (3). The IPSS has a very high sensitivity and specificity of 88–100% and 67–100%, respectively (4), but pitfalls do exist, including the rare ectopic CRH-producing tumor, which may yield a false positive test result (3). Here, we describe a very rare case masquerading as CS including a positive IPSS test.

Case presentation

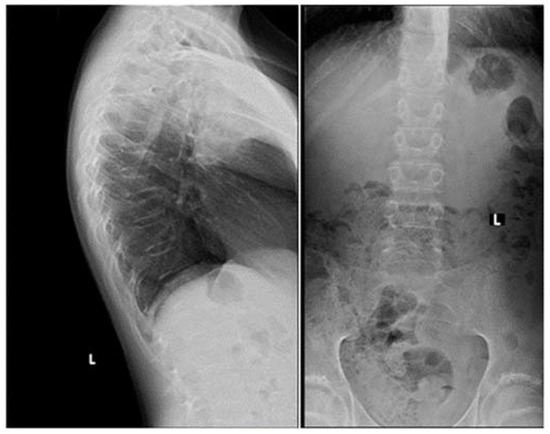
A 69-year-old man presented at a local hospital with a 6-month history of progressive fatigue, muscle weakness and wasting, easy bruising, facial plethora, and fluid retention. His serum potassium level was 2.6 mmol/L (reference range: 3.5–4.2 mmol/L) without a history of diuretics use. His previous medical history included spinal stenosis, benign prostatic hyperplasia, and hypertension. An electromyography showed no sign of polyneuropathy and an echocardiography showed no signs of heart failure with an ejection fraction of 55%. MRI of the spine revealed multiple compression fractures, and the patient underwent spinal fusion and decompression surgery; during this admission he was diagnosed with type 2 diabetes (HbA1c: 55 mmol/mol). After spine surgery, the patient developed a pulmonary embolism and initiated treatment with rivaroxaban.

Establishing the diagnosis of ACTH-dependent CS

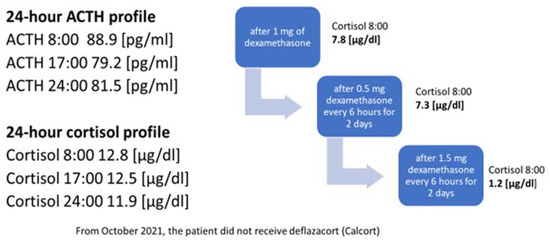
Six months after his spine surgery, the patient was referred to the regional department of endocrinology for osteoporosis management. Blood tests revealed a low serum testosterone level with non-elevated luteinizing hormone (LH) and follicle-stimulating hormone (FSH) levels (Table 1). An overnight 1 mg dexamethasone suppression test was positive with a morning cortisol level of 254 nmol/L and three consecutive 24-h urinary cortisol levels were markedly elevated with mean level of ≈600 nmol/24 h (reference range: 12–150 nmol/24 h). A single plasma ACTH was 37 ng/L (Table 1).

Table 1Baseline endocrine assessment.

Parameters Patient’s values Reference range
ACTH, ng/L 37 7–64
UFC, nmol/day 588 12–150
Urinary cortisol, nmol/L 600 171–536
OD, nmol/L 254 <50
Free testosterone, nmol/L 0.061 0.17–0.59
HbA1c, mmol/mol 55 <48
FSH, IU/L 7.4 1.2–15.8
LH, IU/L 2.2 1.7–8.6

ACTH, adrenocorticotropin; FSH, follicle-stimulating hormone; IU, international units; LH, luteinizing hormone; OD, plasma cortisol levels after a 1 mg overnight dexamethasone suppression test; UFC, urine free cortisol hormone.

Differential diagnostic tests

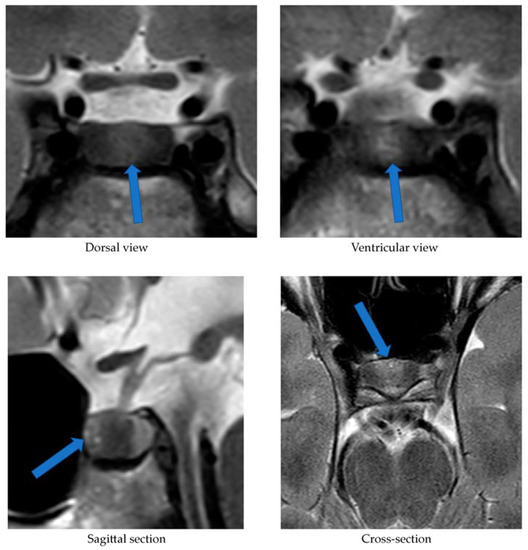
The patient was referred to a tertiary center for further examinations. Ketoconazole treatment was started to alleviate the consequences of hypercortisolism. A pituitary MRI revealed an intrasellar microtumor with a maximal diameter of 6 mm and an IPSS was ordered. A whole-body somatostatin receptor scintigraphy (68Ga-DOTATOC PET/CT) was also performed to evaluate the presence of a potential neuroendocrine tumor. This revealed multiple areas of enhanced uptake including the right thyroid lobe and cervical lymph nodes in the neck (with CT correlates), as well as in the duodenum (with no CT correlate). Concomitantly, a grossly elevated serum calcitonin level of 528 pmol/L (reference range <2.79 pmol/L) was measured.

Subsequently, the IPSS revealed pituitary ACTH secretion with a central-to-peripheral ACTH ratio >3 (Table 2). The right petrosal sinus was not successfully catheterized; thus, lateralization could not be determined.

To corroborate the diagnosis MTC, a 18F-DOPA PET/CT scan (FDOPA) was performed (5), which showed pathologically enhanced uptake in the right thyroid lobe and regional lymph nodes (Fig. 1). An ultrasound-guided core needle biopsy from the thyroid nodule was inconclusive; however, the patient underwent total thyroidectomy and regional lymph node resection, from which histology confirmed the diagnosis of disseminated MTC. Standard replacement with levothyroxine, calcium, and vitamin D was initiated. A blood sample was collected, and genomic DNA was extracted. The DNA analysis for RET germline mutation was negative.

Figure 1View Full Size
Figure 1
18F-DOPA PET/CT scan with pathologically enhanced uptake in the right thyroid lobe (large blue arrow on the left side) and regional lymph nodes (small blue arrows).

Citation: Endocrinology, Diabetes & Metabolism Case Reports 2023, 3; 10.1530/EDM-23-0057

Table 2Results from the inferior petrosal sinus sampling.*

Time (min) Left IPSS Peripheral L/P
-5 42 36 1.2
-1 116 33 3.5
2 120 32 3.8
5 209 28 7.5
7 180 43 4.2
10 529 34 15.6
15 431 37 11.6

*Data represents ACTH levels in ng/L. IPSS Inferior petrosal sampling ACTH Adrenocorticotropin hormone CRH Corticotropin-releasing hormone, L/P Ratio of left (L) inferior petrosal sinus to peripheral venous ACTH concentrations.

Pathology

Total thyroidectomy and bilateral cervical lymph node dissection (level six and seven) were performed. Macroscopic evaluation of the right thyroid lobe revealed a 24 mm, irregular solid yellow tumor. Microscopically the tumor showed an infiltrating architecture with pseudofollicles and confluent solid areas. Calcification was prominent, but no amyloid deposition was seen. The tumor cells were pleomorphic with irregular nuclei and heterogenic chromatin structure. No mitotic activity or necrosis was observed. On immunohistochemical analysis, the tumor cells expressed thyroid transcription factor 1 and stained strongly for carcinoembryonic antigen and calcitonin; tumor cells were focally positive for cytokeratin 19. The tumor was completely negative for ACTH, thyroid peroxidase, and the Hector Battifora mesothelial-1 antigen. Further analysis revealed positive immunostaining for CRH (Fig. 2). The Ki-67 index was very low (0–1%), indicating a low cellular proliferation. Molecular testing for somatic RET mutation was not performed.

Figure 2View Full Size
Figure 2
Histopathological findings and immunohistochemical studies of MTC. (A) Microscopic features of medullary thyroid carcinoma. (B) Polygonal tumor cells (hematoxylin and eosin, ×40). (C) Tumor cells stain for calcitonin (×20). (D) Immunohistochemical stain (×400) for CRH showing cells being positive (brown). (E) Pituitary tissue from healthy control staining positive for ACTH in comparison to (F) ACTH-negative cells MTC tissue from the patient (×20).

Citation: Endocrinology, Diabetes & Metabolism Case Reports 2023, 3; 10.1530/EDM-23-0057

No malignancy was found in the left thyroid lobe and there was no evidence of C-cell hyperplasia. Regional lymph node metastasis was found in 13 out of 15 nodes with extranodal extension.

Outcome and follow-up

Follow-up

Serum calcitonin levels declined after neck surgery but remained grossly elevated (118 pmol/L 3 weeks post surgery) and cortisol levels remained high. Ketoconazole treatment was poorly tolerated and not sufficiently effective. Plasma levels of CRH were measured by a competitive-ELISA kit (EKX-KIZI6R-96 Nordic BioSite), according to the instructions provided by the manufacturer. The intra- and interassay %CV (coefficient of variability) were below 8% and 10%, respectively, and the assay sensitivity was 1.4 pg/mL. The plasma CRH was distinctly elevated compared to in-house healthy controls both before and after thyroid surgery (Fig. 3).

Figure 3View Full Size
Figure 3
Plasma CRH levels before and after total thyroidectomy compared to three healthy controls.

Citation: Endocrinology, Diabetes & Metabolism Case Reports 2023, 3; 10.1530/EDM-23-0057

The patient subsequently underwent uneventful bilateral laparoscopic adrenalectomy followed by standard replacement therapy with hydrocortisone and fludrocortisone. The symptoms and signs of his CS gradually subsided. Pathology revealed bilateral cortical hyperplasia as expected.

The patient continues follow-up at the Department of Oncology and the Department of Endocrinology and Internal Medicine. At 13-month follow-up, 68Ga-DOTATOC shows residual disease with pathologically enhanced uptake in two lymph nodes, whereas the previously described focal DOTATOC uptake in the duodenum was less pronounced (still no CT correlate). Serum calcitonin was 93 pmol/L at the 13-month follow-up.

Discussion

Diagnostic challenges remain in the distinction between pituitary and ectopic ACTH-dependent CS, and several diagnostic tools are used in combination, none of which is infallible, including IPSS (6). Our case and others illustrate that ectopic CRH secretion may yield a false positive IPSS test result (3). Measurement of circulating CRH levels is relevant if an ectopic CRH producing tumor is suspected, but the assay is not routinely available in clinical practice (Lynnette K Nieman M. Measurement of ACTH, CRH, and other hypothalamic and pituitary peptides https://www.uptodate.com/contents/measurement-of-acth-crh-and-other-hypothalamic-and-pituitary-peptides: UpToDate; 2019). In our case, the presence of elevated plasma CRH levels after thyroidectomy strengthened the indication for bilateral adrenalectomy.

The most common neoplasm causing ectopic CS is small-cell lung cancer, whereas MTC accounts for 2–8% of ectopic cases (7). The development of CS in relation to MTC is generally associated with advanced disease and poor prognosis of an otherwise relatively indolent cancer (8), and the clinical progression of CS is usually rapid, why an early recognition and rapid control of hypercortisolemia and MTC is necessary to decrease morbidity and mortality (79). Our case does have residual disease; however, he remains progression-free with stable and relatively low calcitonin levels within 1-year follow-up.

Only a very limited number of cases of ectopic tumors with either combined ACTH and CRH secretion or isolated CRH secretion have been reported, with ectopic CRH secretion accounting for less than 1% of CS (9).

An ACTH- or CRH-producing tumor can be difficult to localize and may include gastric ACTH/CRH-secreting neuroendocrine tumors (9). In our case, the 68Ga-DOTATOC identified a possible duodenal site, in addition to the MTC, but an upper gastrointestinal endoscopy revealed no pathological findings and there was no CT correlate. Thus, we concluded that the most likely and sole source of ectopic CRH was the MTC and its metastases.

To our knowledge, no official guidelines for managing ectopic ACTH-dependent CS have been established. In a recent publication by Alba et al. (10), the authors demonstrated a clinical algorithm (The Mount Sinai Clinical Pathway, MSCP) and recommendation for the management of CS due to ectopic ACTH secretion.

Essentially, our approach in this particular case followed these recommendations, including source location by CT and 68Ga-DOTATATE PET/CT imaging, acute management with ketoconazole, and finally, bilateral adrenalectomy as curative MTC surgery was not possible. In retrospect, performance of the IPSS could be questioned in view of the MTC diagnosis. In real time, however, a pituitary MRI performed early in the diagnostic process revealed a microadenoma, which prompted the IPSS. In parallel, a somatostatin receptor scintigraphy (68Ga-DOTATOC PET/CT) was also done, which raised the suspicion of an MTC.

Conclusion

We report a very rare case of an ectopic CS caused by a CRH-secreting MTC. Although IPSS has stood the test of time in the differential diagnosis of ACTH-dependent CS, this case illustrates a rare pitfall.

Declaration of interest

The authors declare that there is no conflict of interest that could be perceived as prejudicing the impartiality of the research reported.

Funding

This research did not receive any specific grant from any funding agency in the public, commercial, or not-for-profit sector.

Patient consent

Written informed consent for publication of their clinical details was obtained from the patient.

Author contribution statement

JOJ and MJO are the physicians responsible for the patient. LR performed the thyroidectomy and bilateral adrenalectomy. SHM and SLA assessed and reassessed the histopathology and the immunohistochemical analysis. MB measured plasma CRH. VM, JOJ, and MJO drafted the manuscript. All authors contributed to critical revision of the manuscript.

References

Osteoporosis as the First Sign of Cushing’s Disease in a Thin 16-Year-Old Boy

Abstract

Cushing’s disease (CD) is an extremely rare diagnosis in children. In this report, we present the case of an almost 16-year-old, short and thin boy with CD, the first symptoms of which were spinal pain and vertebral fractures as a result of osteoporosis. In light of his growth retardation and short stature, the boy underwent diagnostics, which excluded growth hormone (GH) deficiency, hypothyroidism and celiac disease. Finally, based on cortisol profile results, dexamethasone suppression tests and bilateral sampling during catheterization of the inferior petrosal sinuses, CD was diagnosed.

1. Introduction

Cushing’s disease (CD) is an extremely rare diagnosis in children; however, if it occurs, it is more likely to present in older children [1,2]. It is a type of ACTH-dependent Cushing’s syndrome (CS), in which the pituitary gland is the source of ACTH secretion. The highest incidence of CD occurs in children aged 12.3–14.1 years [3]. The incidence of CD during this developmental age is approximately 5% of that seen in adults (with an annual incidence of 0.89–1 per million pediatric patients) [1,2,4]. The rarest form of ACTH-dependent CS in children is ectopic Cushing’s syndrome (ECS), associated with ectopic production of ACTH or CRH, most commonly by neuroendocrine tumors such as bronchial carcinoids, gastrointestinal tumors, medullary thyroid carcinoma, or pheochromocytomas [2,4,5]. Children with ECS constitute 1% of patients with CS in the developmental age [2]. An even rarer disease is ACTH-independent Cushing’s syndrome—associated with adrenal lesions (adenoma, carcinoma, bilateral macronodular adrenal hyperplasia (BMAH), or primary pigmented nodular adrenocortical disease (PPNAD)) [2].
Regarding CD, ACTH is secreted in an overwhelming majority of cases by pituitary corticotropic microadenomas and—less commonly—by macroadenomas, the latter occurring in only 10% of adult CD cases and even more rarely in children (2%) [1,3]. Long-term hypercortisolemia can also lead to bone-mineralization disorders, including osteoporosis, especially in the bones of the central skeleton [4,6,7].
In children, the most common features of CD are rapid weight gain (93–98%), growth retardation (63–100%) and/or facial changes (63–100%) [4]. Mood disturbances, muscle weakness, osteopenia, and headaches are less frequent symptoms. Limited data are available about bone mineral density (BMD) in children with CD. Lonser et al. [8] observed fractures in 7% of patients with CD that were studied. Chronic glucocorticoid excess associated with CD has negative effects on bone turnover, leading to bone-mineralization disorders in both adults and children. Multiple factors contribute to decreased bone mineral density in CD, including the direct effect of glucocorticoids on osteoclasts and osteoblasts, both impairing bone formation and enhancing bone resorption. Glucocorticoids also act to decrease gastrointestinal calcium absorption and renal calcium reabsorption. Bone loss occurs more frequently in Cushing’s syndrome caused by adrenal tumors in CD [6,7].
An additional factor involved in bone-mineralization disorders, particularly in adult patients with CD, may be hypogonadotropic hypogonadism. Reproductive and sexual dysfunctions are highly prevalent in CS, with higher frequency observed in patients with pituitary-related CS, compared to those with adrenal-related CS. Hypogonadism is identified in as much as 50–75% of men with CS and menstrual irregularities are present in 43–80% of women diagnosed with this condition. During active disease, there is a significant reduction in plasma testosterone and gonadotropin levels in men [7,9]. These testosterone levels typically normalize during remission of the disease. Pivonello et al. [7] suggest that the lack of testosterone normalization three months after CS treatment indicates the need for administration of testosterone to protect the patient’s bone mass. In children, cortisol excess can also suppress gonadotropin, TSH and growth hormone secretion, contributing to the absence of pubertal characteristics or inhibiting its progression in patients who have already entered puberty [1].
So far, to our knowledge, there have been no reports on children where bone-mineralization disorders (without weight gain and hirsutism) are the first sign of CD.

2. Case Presentation

We present the case of an almost 16-year-old boy with short stature who, in May 2021, was referred to the Osteoporosis Outpatient Clinic of the Polish Mother’s Memorial Hospital—Research Institute (PMMH-RI) in Lodz, Poland, due to severe back pain. Low bone mass was diagnosed via dual-energy X-ray absorptiometry (DXA).
Initially, it seemed that the occurrence of those symptoms might be related to steroid therapy, because in November 2020 (just after SARS-CoV-2 infection) the child had developed severe abdominal pain, accompanied by an increase in the activity of liver enzymes, and after excluding an infectious cause, autoimmune hepatitis was diagnosed. Deflazacort (Calcort) therapy was prescribed in gradually reduced doses, with the initial dose being 24 mg in the morning and 18 mg in the afternoon. This therapy was discontinued on 1 October 2021. As early as on the fifth day of glucocorticosteroid treatment, pain presented in the lumbar spine region, increasing with movement. Initially, the pain was intermittent, then it became constant. No painkillers were needed. On 7 May 2021, on the basis of DXA, low bone mass was diagnosed (Z-score Spine: −4.2, Z-score TBLH: −1.9). In June 2021 (while still undergoing treatment with steroids) the boy was admitted to the Department of Endocrinology and Metabolic Diseases PMMH-RI for further diagnostics (Table 1).
Table 1. The medical history and the course of diagnostics and treatment.
The patient was a second child, born at 40 weeks of gestational age, weighing 4150 g, measuring 56 cm, and achieving a 10-point Apgar score. During infancy, he received vitamin D supplementation in accordance with Polish recommendations at that time. However, after his first year of life, the supplementation was not taken regularly. The boy received vaccinations according to the standard immunization schedule. There was no significant family medical history.
During the physical examination, apart from the presence of short stature, no other notable abnormalities were detected. The skin was clear, without pathological lesions; no features of hyperandrogenism were observed. The boy’s body weight was 47.4 kg (3rd–10th centile); his height, 162 cm (<3rd centile); and height SDS, −2.36; while his BMI was 18.06 kg/m2 (10th–25th centile). Pubarche was assessed as stage 4 according to the Tanner scale; the volume of the testes was 10–12 mL each. After available anthropometric measurements from the patient’s medical history were plotted on the growth chart for sex and chronological age, it became evident that the boy experienced growth retardation from the age of 11 (Figure 1).
Jcm 12 05967 g001
Figure 1. Growth chart for boys. The red line represents growth retardation from the age of 11.
Apart from slightly increased calcium excretion in the 24 h urine collection (Calcium: 9.52 mmol/24 h), there were no significant abnormalities in the laboratory tests assessing calcium–phosphate metabolism (Calcium: 2.41 mmol/L, Phosphorus: 1.3 mmol/L). Serum parathormone (PTH) and vitamin D concentrations remained normal (PTH: 22.9 pg/mL, 25(OH)D: 46.7 ng/mL). Due to the described pain complaints, a thoracolumbar spine X-ray was performed. A decrease in the height of the Th5-Th9 vertebrae and central lowering of the upper border plate of the L4 and L5 were observed (Figure 2).
Jcm 12 05967 g002
Figure 2. A thoracolumbar spine X-ray with multilevel vertebral fractures. Decrease in the height of the Th5–Th9 vertebrae and central lowering of the upper border plate of the L4 and L5 were found.
Magnetic resonance imaging (MRI) of the spine confirmed multilevel vertebral fractures, which, together with the presence of low bone mass on DXA examination, allowed a diagnosis (according to ISCD guidelines) of osteoporosis to be made. Treatment included calcium supplements and cholecalciferol. The parents did not consent to treatment with bisphosphonates (sodium pamidronate), which is an off-label treatment.
In light of the patient’s short stature and growth retardation, an endocrinological assessment was conducted. The possibility of growth hormone (GH) deficiency and hypothyroidism as underlying causes for the growth retardation was ruled out. Gonadotropin and androgen levels were adequate for the pubertal stage (FSH—8.3 IU/L, LH—4.7 IU/L, testosterone—4.750 ng/mL, DHEA-S—230.30 µg/dL (normal range: 70.2–492), 17-OH-progesterone—0.78 ng/mL). The bone age was assessed to be 15 years.
Alongside continued steroid therapy for autoimmune hepatitis, profiles of cortisol and ACTH secretion were performed. Due to the patient’s elevated cortisol levels during night hours (cortisol 24:00—10.7 µg/dL), an overnight dexamethasone suppression test (DST) and low-dose dexamethasone suppression test (LDDST) were performed. After administering 1 mg dexamethasone (23:00), his morning cortisol level (8:00) still remained elevated (cortisol—3.4 µg/dL). However, after administering 0.5 mg dexamethasone every 6 h for the next 2 days, cortisol levels (8:00) normalized (cortisol—1.0 µg/dL). An MRI of the pituitary gland showed only a poorly demarcated area in the anterior part of the glandular lobe, measuring approximately 2.0 × 3.5 × 5.0 mm on T2W images (Figure 3). A follow-up MRI examination was recommended, which was performed during the child’s next hospitalization in January 2022. The previously described area was still very faint.
Jcm 12 05967 g003
Figure 3. MRI examination image depicting the poorly demarcated area in the anterior part of the glandular lobe. The arrows point to a structure suspected of being an adenoma.
In October 2021, the administration of deflazocort as a treatment was discontinued. During hospitalization in January 2022, the diurnal pattern of ACTH and cortisol secretion was re-evaluated, yet no consistent diurnal rhythm was observed; cortisol levels remained elevated at night. For this reason, overnight DST and then LDDST were carried out again (Figure 4), in which no suppression of cortisol concentrations was obtained. Only after a high-dose DST (HDDST), in which a high 1.5 mg of dexamethasone was administered every 6 h (125 µg/kg/24 h), was cortisol secretion suppressed.
Jcm 12 05967 g004
Figure 4. Laboratory findings indicating the diagnosis of ACTH-dependent Cushing’s syndrome.
Based on the above results, CD was suspected as the cause of osteoporosis and growth retardation. In February 2022, a CRH test was performed upon the patient, which revealed a four-fold increase in ACTH levels and a two-fold increase in serum cortisol levels (Table 2).
Table 2. The results of human CRH (hCRH) stimulation test and bilateral inferior petrosal sinus sampling (BIPSS).
The CRH stimulation test was administered in the morning using human synthetic CRH (Ferring) at a dose of 1 μg/kg of body weight. During the test, cortisol and ACTH levels were measured in serum at the following time points: −15, 0, 15, 30, 60, and 90 min (see Table 2). As part of the diagnostic process, urinary free cortisol excretion was also measured over two consecutive days. Only on the first day was there a slight elevation in urinary free cortisol concentration, measuring 183.60 μg/24 h (normal range: 4.3–176). The measurement performed on the second day showed a normal urinary free cortisol concentration of 145.60 μg/24 h (normal range: 4.3–176). On 2 March 2022, the patient underwent a bilateral inferior petrosal sinus sampling (BIPSS). Human CRH stimulation was also used during the procedure. The presence of ACTH-dependent hypercortisolemia of pituitary origin was confirmed. The outcome of the CRH stimulation during the BIPSS is presented in Table 2. The boy qualified for transsphenoidal surgery (TSS) of the pituitary adenoma and was successfully operated on (8 March 2022). Postoperative histopathological examination revealed features of a corticotroph-rich pituitary adenoma.

3. Discussion

Osteoporosis, like CD, is extremely rare in the developmental age population. Bone-mineralization disorders among children may be primary (e.g., osteogenesis imperfecta), or secondary to other diseases or their treatment (e.g., with glucocorticosteroids). This case report presents a boy with osteoporosis, the cause of which was originally attributed to the treatment of autoimmune hepatitis with glucocorticosteroids. Steroid therapy is the most common cause of bone-mineralization disorders in children. However, osteoporosis is a late complication of steroid treatment. Briot et al. [10] demonstrated that the risk of fractures increases as early as 3 months after initiating steroid therapy. An additional factor increasing the risk of fractures is the dose of glucocorticosteroids used, corresponding to 2.5–5 mg of prednisolone per day [10]. In the case of the present patient, the appearance of spinal pain and thus vertebral fractures could not have been related to the deflazacort treatment started 5 days earlier. The bone-mineralization disorder must therefore have occurred much earlier. For this reason, the authors considered it necessary to search for other endocrine causes of osteoporosis development, including hypogonadism, growth hormone deficiency or Cushing’s syndrome/disease.
The serum vitamin D concentration can also influence bone mineral density. Every patient with mineralization disorders, especially with osteoporosis, requires a thorough assessment of calcium–phosphate metabolism [11]. Until the initiation of steroid therapy in March 2021, the patient did not undergo regular vitamin D supplementation. At the start of deflazacort treatment, his serum 25(OH)D concentration was 12.4 ng/mL. Consequently, additional cholecalciferol supplementation at a dose of 3000 IU/day was introduced. In a subsequent measurement conducted in June 2021, the concentration was within the reference range [25(OH)D: 46.7 ng/mL].
Considering the lack of regular supplementation before March 2021, it can be assumed that in October 2020, when the boy experienced SARS-CoV-2 infection, his serum vitamin D concentration was likely decreased as well, which could have had a further negative impact on the patient’s bone mineralization. Scientific reports indicate that adequate vitamin D levels reduce the risk of viral infections, including SARS-CoV-2 [12]. Di Filippo et al. [13] demonstrated that vitamin D deficiency observed in 68.2% of SARS-CoV-2-infected individuals correlated with a more severe course of the infection. In our patient, the course of COVID-19 was asymptomatic, and the diagnosis was established based on positive IgM antibody titers against SARS-CoV-2. The vitamin deficiency was most likely associated with irregular supplementation and lack of exposure to UV radiation (due to lockdown measures in Poland at that time). A reduced serum 25(OH)D concentration could have contributed to worsened bone mineral density and increased susceptibility to SARS-CoV-2 infection; however, it is the chronic hypercortisolism characteristic of CD that most likely led to the development of osteoporosis with accompanying fractures.
Another factor necessitating further diagnostic investigation into CD was the patient’s growth retardation observed since the age of 11. Both the pubertal state of the boy, and his gonadotropin and testosterone serum levels, allowed us to exclude hypogonadism. Maximum spontaneous nocturnal secretion of the growth hormone was 31.84 ng/mL. The diagnosis of CD was established on the basis of elevated cortisol levels at night and the lack of cortisol suppression in the test after administering dexamethasone. Final confirmation of the diagnosis was obtained in a post-CRH stimulation test. In pediatric cases, the absence of typical diurnal variation in serum corticosolemia, especially the nocturnal decline, and the inability to suppress cortisol secretion at midnight, are highly sensitive indicators of hypercortisolemia [6,8]. Consequently, in our patient, osteoporosis was a complication of diagnosed CD.
The patient in question was not obese, which is the predominant symptom of CD. This symptom, according to Ferrigno et al. [1], is present in 92–98% of examined children diagnosed with CD. Storr et al. [14] showed that facial changes and facial swelling were observed in 100% of subjects with CD, whereas Lonser et al. [8] observed this in only 63% of children with CD. In our patient, no changes in facial appearance were observed. Other symptoms typical of CS, such as hirsutism, acne, or bruises, were not noticed either. These symptoms were observed in all children with CD studied by Wędrychowicz et al. [3]. Non-specific symptoms of this condition may include mood changes, depression and emotional vacillation [1,8]. However, our patient’s parents did not observe any changes in the boy’s behavior. The indication for initiating the whole diagnostic process was (in addition to osteoporosis) growth retardation. Ferrigno et al. [1] point out that chronic hypercortisolemia most often leads to growth disorders accompanied by excessive weight gain. This is an early, highly sensitive and characteristic sign of CD. Short stature is not always observed and occurs in one in two children diagnosed with CD. The patient we present was short (height—162 cm (<3rd centile hSDS: −2.36)); growth retardation was observed from the age of 11 years.
The occurrence of vertebral fractures and the accompanying pain as the initial symptoms of hypercortisolism, the absence of obesity, and the confirmation of CD, an exceedingly rare condition in the pediatric population, collectively underscore the uniqueness of our patient’s disease presentation. A case involving a child with such an atypical course of ACTH-dependent CS has not been described before. Han et al. [15] reported a case of a 28-year-old lean woman (BMI: 19 kg/m²) with ACTH-independent CS due to a left adrenal adenoma, where, similarly to our patient, the initial manifestation of hypercortisolism was compression fractures of the thoracic vertebrae. The authors emphasize that vertebral fractures may affect 30–50% of patients with Cushing’s syndrome, with a higher frequency observed in patients with ACTH-independent CS compared to those in whom hypercortisolism results from the presence of pituitary adenoma [15].
The lack of obesity in a patient with hypercortisolism could be attributed to malnutrition, which accompanies the growth process in ECS. Hence, a crucial aspect was the differential diagnosis between CD and ECS. To this end, we performed a stimulation test using hCRH. We considered cut-off points for diagnosing CD to be a 35% increase in ACTH concentration at 15 and/or 30 min, and at least a 20% increase in cortisol concentration at 30 and 45 min [16,17]. In the case of ECS, a significant rise in CRH and cortisol concentrations is not observed. Recently published reports emphasize the need to explore new cut-off points to enhance the sensitivity and specificity of this test. Detomas et al. [5] indicate that an increase in ACTH ≥ 31% and cortisol ≥ 12% in the 30th minute of CRH tests allows for a highly sensitive and specific differentiation between CD and ECS. The authors highlight that measuring these hormones at the 60 min stage of the test does not provide diagnostic benefits. Notably, the study employed ovine CRH, which exhibits stronger and more prolonged stimulatory effects compared to the hCRH available in Europe that was used to diagnose our patient [5]. Conversely, Elenius et al. [16] suggest that optimal values for distinguishing between CD and ECS in the CRH stimulation test involve an increase in ACTH and/or cortisol levels of more than 40% during the test. In our patient, an over four-fold increase in ACTH levels and a more than two-fold increase in cortisol levels were observed at the 30 min mark of the test, thus independently and definitively excluding ECS regardless of the adopted cut-off points.
Our patient’s case also demonstrates that MRI is not a perfect method of visualizing an ACTH-secreting pituitary adenoma. In the first MRI examination performed upon our patient, a poorly demarcated area (2.0 × 3.5 × 5.0 mm) was described in the anterior part of the glandular lobe; in the examination performed 6 months later, this area maintained poor visibility, while laboratory results at the time clearly indicated an ACTH-dependent form of CS. It was only the bilateral inferior petrosal sinus sampling (BIPSS) that allowed a clear diagnosis. Data from the literature indicate that microadenomas smaller than 3–4 mm are visible on MRI in only half of cases. In two large studies including children, pituitary adenomas were found on MRI in 63% and 55% of cases [18]. Among the patients with CD studied by Wędrychowicz et al. [3], pituitary adenomas were described on MRI in all of them, but in two patients (50%) this was only achieved upon follow-up. In the standard procedure, in the absence of a pituitary lesion in the MRI examination, it is recommended that a BIPSS be performed. In the case of our patient, this examination was necessary to make a definitive diagnosis.
When analyzing the results of the BIPSS with hCRH stimulation, we employed the classical cut-offs for the ACTH IPS:P (Inferior Petrosal Sinus: Peripheral) ratio (i.e., ≥2 at baseline and ≥3 after hCRH stimulation) [1]. This allowed the confirmation of CD and determination of the pituitary adenoma’s localization, followed by the procedure for its surgical removal. The optimal cut-off values for the IPS:P ratio remain controversial. There are ongoing efforts to establish new, more precise cut-off points. Detomas et al. [19] demonstrated that an IPS:P ratio ≥ 2.1 during desmopressin stimulation in the BIPSS most accurately differentiates CD from ECS. Conversely, Chen et al. [20] showed that the optimal pre-desmopressin stimulation IPS:P ratio cut-off is 1.4, and post-stimulation it is 2.8. Both studies suggest the utilization of lower cut-off values for the IPS:P ratio than those traditionally adopted. Chen et al. [20] also advocate for avoiding stimulation during BIPSS. In most cases, the IPS:P ratio before stimulation is sufficient for diagnosing CD. According to the authors, desmopressin stimulation should be reserved for patients with ambiguous MRI findings or with a pituitary adenoma with diameter less than 6 mm. However, considering that the concentration of ACTH in the right inferior petrosal sinus in our patient was over 4 times higher than in the peripheral vessel and nearly 14 times higher after hCRH stimulation, regardless of the applied criteria, CD could be unequivocally diagnosed in our patient, and the lateralization of the microadenoma could be determined with certainty.
The rarity of CD, and the diagnostic difficulties stemming from its oligosymptomatic or atypical course, encourage description in the form of case reports. Eviz et al. [21] delineate the occurrence of cerebral cortical atrophy in two children with ECS. Additionally, other researchers have underscored the potential for thyroid disorders to manifest alongside hypercorticosolemia [22]. Although obesity typically stands out as a primary symptom of CD, Pomahacova et al. [23] reported a case involving two children with CD who maintained normal body weight, mirroring our patient’s situation. The symptoms that prompted diagnostic investigation in these instances included weakness, sleep disturbances and growth retardation. Interestingly, growth retardation, along with facial changes, was observed in all examined children with CD [23]. Nonetheless, to the best of our knowledge, we have yet to encounter a case report resembling ours. Therefore, it remains crucial to share our experiences.

4. Conclusions

Cushing’s disease is an extremely rare diagnosis in children. In Poland, there is no statistical record of occurrences of this disease among children. Wędrychowicz et al. reported that in their single Polish center, between 2012 and 2018, they identified four cases of children aged 7–15 who were diagnosed with CD [3]. The case we present shows that obesity, commonly considered as a predominant symptom of CD, is not necessarily observed in patients with this diagnosis in the developmental age population. Among children, it is growth disturbance that may be the first manifestation. On the other hand, a late complication of CD may be osteoporosis, so whenever a child is diagnosed with a bone-mineralization disorder, the cause of its development should be sought.
Diagnosis should be pursued until all potential causes of the described symptoms, including the rarest ones, are definitively ruled out—even if the clinical presentation, as in the case of our patient, initially does not point towards the final diagnosis. Thus far, no case of a child with CD exhibiting such subtle symptomatology has been described in the literature. The challenges in diagnosis we encountered primarily resulted from the atypical clinical outcome of CD in our patient—normal body weight, absence of hyperandrogenism, mood disturbances not apparent to caregivers and the patient’s immediate environment, as well as normal progression of puberty, did not immediately lead to the consideration of endocrinological causes of osteoporosis. The steroid therapy employed due to autoimmune hepatitis also complicated the diagnostic process. Only after discontinuing deflazacort treatment was it possible to definitively diagnose CD.
Our patient required hydrocortisone replacement in gradually decreasing doses for a year following TSS. Considering that pituitary adenomas in children can be genetically predisposed (e.g., MEN 1 mutation, AIP mutation, USP8 mutation, and other rarer ones), genetic consultation was sought [1]. However, the conducted tests have thus far excluded the most common mutations in our patient. Due to the diagnosed osteoporosis, chronic supplementation with calcium and cholecalciferol was recommended, along with annual follow-up DXA scans. Studies indicate that patients in remission from CD experience a gradual improvement in bone mineral density [3]. While we can currently observe remission in our patient’s case, the advanced bone age of the child (indicating the completion of the growth process) left limited potential for significant improvement in final growth. The patient still requires regular endocrinological and neurosurgical follow-ups, hormonal assessments, and pituitary MRI examinations.

Author Contributions

Conceptualization—R.S. and A.Ł.; software—S.A.; formal analysis—R.S.; investigation—A.Ł. and G.Z.; data curation—A.Ł.; writing—original draft preparation—A.Ł., R.S. and S.A.; writing—review and editing—A.L.; visualization—S.A.; supervision—A.L. All authors have read and agreed to the published version of the manuscript.

Funding

This study was funded by statutory funds from the Medical University of Lodz, Lodz, Poland (503/1-107-03/503-11-001).

Institutional Review Board Statement

Not applicable.

Informed Consent Statement

Written informed consent has been obtained from the patient to publish this paper.

Data Availability Statement

Not applicable.

Conflicts of Interest

The authors declare no conflict of interest.

References

  1. Ferrigno, R.; Hasenmajer, V.; Caiulo, S.; Minnetti, M.; Mazzotta, P.; Storr, H.L.; Isidori, A.M.; Grossman, A.B.; De Martino, M.C.; Savage, M.O. Paediatric Cushing’s disease: Epidemiology, pathogenesis, clinical management and outcome. Rev. Endocr. Metab. Disord. 2021, 22, 817–835. [Google Scholar] [CrossRef]
  2. Stratakis, A. Cushing syndrome in pediatrics. Endocrinol. Metab. Clin. N. Am. 2012, 41, 793–803. [Google Scholar] [CrossRef]
  3. Wędrychowicz, A.; Hull, B.; Tyrawa, K.; Kalicka-Kasperczyk, A.; Zieliński, G.; Starzyk, J. Cushing disease in children and adolescents—Assessment of the clinical course, diagnostic process, and effects of the treatment—Experience from a single paediatric centre. Pediatr. Endocrinol. Diabet. Metab. 2019, 25, 127–143. [Google Scholar] [CrossRef]
  4. Concepción-Zavaleta, M.J.; Armas, C.D.; Quiroz-Aldave, J.E.; García-Villasante, E.J.; Gariza-Solano, A.C.; Del Carmen Durand-Vásquez, M.; Concepción-Urteaga, L.A.; Zavaleta-Gutiérre, F.E. Cushing disease in pediatrics: An update. Ann. Pediatr. Endocrinol. Metab. 2023, 28, 87–97. [Google Scholar] [CrossRef]
  5. Detomas, M.; Ritzel, K.; Nasi-Kordhishti, I.; Wolfsberger, S.; Quinkler, M.; Losa, M.; Tröger, V.; Kroiss, M.; Fassnacht, M.; Vila, G.; et al. Outcome of CRH stimulation test and overnight 8 mg dexamethasone suppression test in 469 patients with ACTH-dependent Cushing’s syndrome. Front. Endocrinol. 2022, 13, 955945. [Google Scholar] [CrossRef] [PubMed]
  6. Lodish, M.B.; Hsiao, H.P.; Serbis, A.; Sinaii, N.; Rothenbuhler, A.; Keil, M.F.; Boikos, S.A.; Reynolds, J.C.; Stratakis, C.A. Effects of Cushing disease on bone mineral density in a pediatric population. J. Pediatr. 2010, 56, 1001–1005. [Google Scholar] [CrossRef] [PubMed]
  7. Pivonello, R.; Isidori, A.M.; De Martino, M.C.; Newell-Price, J.; Biller, B.M.; Colao, A. Complications of Cushing’s syndrome: State of the art. Lancet Diabetes Endocrinol. 2016, 4 (Suppl. S7), 611–629. [Google Scholar] [CrossRef] [PubMed]
  8. Lonser, R.R.; Wind, J.J.; Nieman, L.K.; Weil, R.J.; DeVroom, H.L.; Oldfield, E.H. Outcome of surgical treatment of 200 children with Cushing’s disease. J. Clin. Endocrinol. Metab. 2013, 98, 892–901. [Google Scholar] [CrossRef]
  9. Detomas, M.; Deutschbein, T.; Tamburello, M.; Chifu, I.; Kimpel, O.; Sbiera, S.; Kroiss, M.; Fassnacht, M.; Altieri, B. Erythropoiesis in Cushing syndrome: Sex-related and subtype-specific differences. Results from a monocentric study. J. Endocrinol. Investig. 2023; epub ahead of print. [Google Scholar] [CrossRef]
  10. Briot, K.; Roux, C. Glucocorticoid-induced osteoporosis. RMD Open 2015, 1, 14. [Google Scholar] [CrossRef]
  11. Laird, E.; Ward, M.; McSorley, E.; Strain, J.J.; Wallace, J. Vitamin D and bone health; potential mechanisms. Nutrients 2010, 2, 693–724. [Google Scholar] [CrossRef]
  12. di Filippo, L.; Frara, S.; Nannipieri, F.; Cotellessa, A.; Locatelli, M.; Querini, P.R.; Giustina, A. Low vitamin D levels are associated with long COVID syndrome in COVID-19 survivors. J. Clin. Endocrinol. Metab. 2023, 1–11. [Google Scholar] [CrossRef] [PubMed]
  13. di Filippo, L.; Allora, A.; Doga, M.; Formenti, A.M.; Locatelli, M.; Rovere Querini, P.; Frara, S.; Giustina, A. Vitamin D levels are associated with blood glucose and BMI in COVID-19 patients, predicting disease severity. J. Clin. Endocrinol. Metab. 2022, 107, 348–360. [Google Scholar] [CrossRef]
  14. Storr, H.L.; Chan, L.F.; Grossman, A.B.; Savage, M.O. Pediatric Cushing’s syndrome: Epidemiology, investigation and therapeutic advances. Trends Endocrinol. Metab. 2007, 18, 167–174. [Google Scholar] [CrossRef] [PubMed]
  15. Han, J.Y.; Lee, J.; Kim, G.E.; Yeo, J.Y.; Kim, S.H.; Nam, M.; Kim, Y.S.; Hong, S. Case of Cushing syndrome diagnosed by recurrent pathologic fractures in a young woman. J. Bone Metab. 2012, 19 (Suppl. S2), 153–158. [Google Scholar] [CrossRef] [PubMed]
  16. Elenius, H.; McGlotten, R.; Nieman, L.K. Ovine CRH stimulation and 8 mg dexamethasone suppression tests in 323 patients with ACTH-dependent Cushing’s syndrome. J. Clin. Endocrinol. Metab, 2023; Epub ahead of print. [Google Scholar] [CrossRef]
  17. Nieman, L.K.; Biller, B.M.K.; Findling, J.W.; Newell-Price, J.; Savage, M.O.; Stewart, P.M.; Montori, V.M. The diagnosis of Cushing’s syndrome: An Endocrine Society Clinical Practice Guideline. J. Clin. Endocrinol. Metab. 2008, 93 (Suppl. S5), 1526–1540. [Google Scholar] [CrossRef] [PubMed]
  18. Savage, M.O.; Storr, H.L. Pediatric Cushing’s disease: Management issues. Indian J. Endocrinol. Metab. 2012, 16 (Suppl. S2), 171–175. [Google Scholar] [CrossRef]
  19. Detomas, M.; Ritzel, K.; Nasi-Kordhishti, I.; Schernthaner-Reiter, M.H.; Losa, M.; Tröger, V.; Altieri, B.; Kroiss, M.; Kickuth, R.; Fassnacht, M.; et al. Bilateral inferior petrosal sinus sampling with human CRH stimulation in ACTH-dependent Cushing’s syndrome: Results from a retrospective multicenter study. Eur. J. Endocrinol. 2023, 188 (Suppl. S5), 448–456. [Google Scholar] [CrossRef]
  20. Chen, S.; Chen, K.; Wang, S.; Zhu, H.; Lu, L.; Zhang, X.; Tong, A.; Pan, H.; Wang, R.; Lu, Z. The optimal cut-off of BIPSS in differential diagnosis of ACTH-dependent Cushing’s syndrome: Is stimulation necessary? J. Clin. Endocrinol. Metab. 2020, 105 (Suppl. S4), 1673–1685. [Google Scholar] [CrossRef]
  21. Eviz, E.; Yesiltepe, M.G.; Arduc, A.A.; Erbey, F.; Guran, T.; Hatun, S. An overlooked manifestation of hypercortisolism—Cerebral cortical atrophy and challenges in identifying the etiology of hypercortisolism: A report of 2 pediatric cases. Horm. Res. Paediatr. 2023, 27. [Google Scholar] [CrossRef]
  22. Paragliola, R.M.; Corsello, A.; Papi, G.; Pontecorvi, A.; Corsello, S.M. Cushing’s syndrome effects on the thyroid. Int. J. Mol. Sci. 2021, 22, 3131. [Google Scholar] [CrossRef]
  23. Pomahacova, R.; Paterova, P.; Nykodymova, E.; Sykora, J.; Krsek, M. Pediatric Cushing’s disease: Case reports and retrospective review. Biomed. Pap. Med. Fac. Univ. Palacky. Olomouc. Czech Repub. 2022, 166. [Google Scholar] [CrossRef] [PubMed]
Disclaimer/Publisher’s Note: The statements, opinions and data contained in all publications are solely those of the individual author(s) and contributor(s) and not of MDPI and/or the editor(s). MDPI and/or the editor(s) disclaim responsibility for any injury to people or property resulting from any ideas, methods, instructions or products referred to in the content.

Share and Cite

MDPI and ACS Style

Łupińska, A.; Aszkiełowicz, S.; Zieliński, G.; Stawerska, R.; Lewiński, A. Osteoporosis as the First Sign of Cushing’s Disease in a Thin 16-Year-Old Boy—A Case Report. J. Clin. Med. 202312, 5967. https://doi.org/10.3390/jcm12185967

AMA StyleŁupińska A, Aszkiełowicz S, Zieliński G, Stawerska R, Lewiński A. Osteoporosis as the First Sign of Cushing’s Disease in a Thin 16-Year-Old Boy—A Case Report. Journal of Clinical Medicine. 2023; 12(18):5967. https://doi.org/10.3390/jcm12185967

Chicago/Turabian StyleŁupińska, Anna, Sara Aszkiełowicz, Grzegorz Zieliński, Renata Stawerska, and Andrzej Lewiński. 2023. “Osteoporosis as the First Sign of Cushing’s Disease in a Thin 16-Year-Old Boy—A Case Report” Journal of Clinical Medicine 12, no. 18: 5967. https://doi.org/10.3390/jcm12185967

Find Other Styles

Note that from the first issue of 2016, this journal uses article numbers instead of page numbers. See further details here.

Article Metrics

Citations

No citations were found for this article, but you may check on Google Scholar

Article Access Statistics

Article access statisticsArticle Views14. Sep15. Sep16. Sep17. Sep18. Sep19. Sep20. Sep21. Sep22. Sep23. Sep24. Sep25. Sep26. Sep27. Sep28. Sep29. Sep30. Sep1. Oct2. Oct3. Oct4. Oct5. Oct6. Oct7. Oct8. Oct9. Oct10. Oct11. Oct12. Oct13. Oct14. Oct0100200300400

For more information on the journal statistics, click here.

Multiple requests from the same IP address are counted as one view.

Birthday of the Message Boards

September 30, 2000 - Birth of the Message Boards

September 30, 2000 – Birth of the Message Boards

Today  is the birthday, or anniversary, of the boards starting September 30, 2000 (The rest of the site started earlier that year in July)

As of today, we have 73,357 members who have made well over 380,324 posts.

Find the message boards here: http://cushings.invisionzone.com/

Dexamethasone Suppression for 18F-FDG PET/CT to Localize ACTH-Secreting Pituitary Tumors

Abstract

Background

18Fluorine-Fluoro-deoxy-glucose (18F-FDG) positron emission tomography (PET) is widely used for diagnosing various malignant tumors and evaluating metabolic activities. Although the usefulness of 18F-FDG PET has been reported in several endocrine diseases, studies on pituitary disease are extremely limited. To evaluate whether dexamethasone (DEX) suppression can improve 18F-FDG PET for the localization of adrenocorticotropic hormone-secreting adenomas in the pituitary gland in Cushing’s disease (CD).

Methods

We included 22 patients with CD who underwent PET imaging before and after DEX administration. We compared the success rates of PET before and after DEX suppression, magnetic resonance imaging (MRI), and bilateral inferior petrosal sinus sampling (BIPSS). We determined the final locations of adenomas based on intraoperative multiple-staged resection and tumor tissue identification using frozen sections. Standardized uptake value (SUV) were analyzed to confirm the change of intensity of adenomas on PET.

Results

Twenty-two patients were included (age at diagnosis: 37 [13–56] years), and most were women (90.91%). Pituitary adenomas compared to normal pituitaries showed increased maximum SUV after DEX suppression but without statistical significance (1.13 versus. 1.21, z=-0.765, P = 0.444). After DEX suppression, the mean and maximum SUV of adenomas showed a positive correlation with nadir cortisol levels in high-dose DEX suppression test (Rho = 0.554, P = 0.007 and Rho = 0.503, P = 0.017, respectively). In reference sites, mean SUV of cerebellum was significantly decreased (7.65 vs. 6.40, P = 0.006*), but those of the thalamus and gray matter was increased after DEX suppression (thalamus, 8.70 vs. 11.20, P = 0.010*; gray matter, 6.25 vs. 7.95, P = 0.010*).

Conclusion

DEX suppression did not improve 18F-FDG PET/CT localization in patients with CD.

Introduction

Cushing’s disease (CD) is a rare endocrine disease that results from chronic exposure to high cortisol levels because of adrenocorticotropic hormone (ACTH)-secreting pituitary tumors and is associated with increased morbidity and mortality. It represents approximately 80% of all cases of endogenous hypercortisolism [1,2,3]. Accurate localization of primary lesions in CD leads to improved remission rates and reduced adverse events following surgery [45]. A biochemical remission rate of 90–100% has been reported when tumors are localized before surgery, but it can decrease to 50–60% when surgery is performed when the location of the tumor is unknown in patients with CD [6,7,8].

Currently, magnetic resonance imaging (MRI) is the gold standard for detecting pituitary adenomas. Nevertheless, modern MRI modalities, including dynamic or volumetric sequences, can reliably detect corticotrophic adenomas in 50–90% cases of CD [9,10,11,12]. This indicates that complementary imaging strategies are required to improve the localization of primary lesions in CD.

One of the most characteristic features of corticotrophic adenomas is a compromised response to negative glucocorticoid feedback, which defines glucocorticoid resistance [13]. ACTH activates the adrenal glands to synthesize and secrete cortisol, which in turn negatively modulates the release of ACTH from the pituitary gland and corticotrophin-releasing hormone (CRH) and vasopressin from the hypothalamus [1]. In CD, a corticotrophic tumor is only partially sensitive to the inhibitory feedback exerted by cortisol, which in turn is not regulating its own production and secretion of ACTH, resulting in both excessive ACTH and cortisol levels. Glucocorticoid resistance is caused by multiple factors including glucocorticoid receptor availability, splice variant expression and affinity, and imbalanced glucocorticoid receptor signaling [1415].

Radioactive 18 F-fluorodeoxyglucose positron emission tomography/computed tomography (18F-FDG PET/CT) often demonstrates increased fluorodeoxyglucose (FDG) uptake in nonfunctioning and hormone-secreting pituitary adenomas [16,17,18]. In large observational studies of whole-body 18F-FDG positron emission tomography (PET) scans, incidental sellar 18F-FDG uptake was found in < 1% of cases, and this sign is highly specific for pituitary adenomas [19,20,21]. 18F-FDG PET imaging can detect up to 40% of corticotropinomas, some as small as 3 mm, and the rate of PET detection of corticotropinomas can be increased by CRH stimulation [922].

Here, we evaluated whether DEX suppression could improve the localization of ACTH-secreting adenomas using 18F-FDG PET/CT in patients with CD. The rationale for this is as follows. FDG uptake of corticotrophic adenomas is less suppressed than that of normal pituitary glands after DEX suppression due to glucocorticosteroid resistance.

Materials and methods

Study design and population

In this retrospective cohort study, we enrolled all patients with CD who underwent two rounds of 18F-FDG-PET/CT before and after 8-mg DEX suppression and pituitary MRI before surgery. Total 22 patients were included in this study, of which thirteen had bilateral inferior petrosal sinus sampling (BIPSS) results. All patients were diagnosed with CD by staff of the Department of Endocrinology and/or Neurosurgery at Severance Hospital between 2014 and 2015. The diagnosis of CD was confirmed based on biochemical test results, including the cortisol, 24-hour urine free cortisol (24 h UFC), and serum ACTH levels, overnight dexamethasone suppression test (ON DST) results, and high-dose dexamethasone suppression test (HD DST) results.

Immediate remission was defined as hypocortisolism (serum cortisol level < 1.8 µg/dL) within the first 7 days after surgery. Delayed remission was defined as the achievement of hypocortisolism within 6 months, although immediate remission was not confirmed. If patients showed elevated postoperative cortisol levels and needed additional treatment within 6 months after surgery, we defined them as having persistent disease [23,24,25].

A serum cortisol concentration > 1.8 µg/dL for 8 h in the morning after 1 mg of DEX was given at midnight was considered to be a positive result in the ON DST [26]. Suppression of the serum cortisol level by > 50% for 6 h after 2 mg of DEX was administered for 2 days was defined as the suppression on the HD DST [26]. The final diagnosis was confirmed using surgical pathology and clinical follow-up.

Endocrinological evaluation

All laboratory analyses were performed at the Department of Laboratory Medicine, Severance Hospital. Preoperative cortisol and 24 h UFC were measured by chemiluminescence immunoassay using an automated UniCel DXC880i Synchron analyzer (Beckman Coulter, Pasadena, CA, USA; coefficient of variation [CV] ± 15 nmol/L at < 100 nmol/L and ± 15% at > 100 nmol/L). Preoperative ACTH levels were analyzed by electrochemiluminescence immunoassay using the Roche Cobas 6000 analyzer (Roche Diagnostics GmbH, Mannheim, Germany; CV ± 2.0 pmol/L at < 20 pmol/L and ± 10% at > 20 pmol/L).

The serum cortisol concentration at 8:00 am the following day after 1 mg of DEX was administered at midnight was considered positive on the ON DST. We determined the result as “suppression” by the cortisol level of < 1.8 µg/dL. A serum cortisol level suppressed by > 50% of the original level after 6 hourly administrations of 2 mg of DEX for 48 h was defined as suppression on the HD DST [27].

18F-FDG PET/CT evaluation

PET/CT was performed using a GEADVANCE PET scanner (GE, Milwaukee, WI, USA) after the intravenous injection of 7–9 mCi of 18F-FDG. All patients fasted for at least 6 h before the test. Emission scanning was continued for 15 min (4.25-mm axial spatial resolution, 4.8-mm transaxial spatial resolution). Transmission scans were performed for 8 min using triple Ge-68 rod sources to correct attenuation. Gathered data were reconstructed in a 128 × 128 × 35 matrix with a pixel size of 1.95 × 1.95 × 4.25 mm by means of a filtered back-projection algorithm employing a transaxial 8.5-mm Hanning filter and 8.5-mm axial ramp filter. Two specialists independently interpreted the encoded baseline PET images, and after a two-week period, they interpreted the encoded post DEX suppression PET images. Each specialist was blinded to MRI imaging, clinical characteristics, and surgical outcomes of these subjects. Each was tasked with determining whether the PET image indicated a “negative” or “positive” result for pituitary adenoma and its location on a high-resolution computer screen.

The scan after DEX suppression was performed 24 h after the oral administration of 8 mg of DEX using the same procedures as for the baseline PET/CT scan.

18F-FDG uptake analysis

The Region of interest (ROI) was drawn using MIM software (version 6.5, Software INc., Cleveland, OH, USA) (Fig. 1). PET images were reviewed by experienced by an experienced specialist. The pituitary gland was identified and a circular ROI was drawn. A fixed ROI with a 3-mm diameter was used for all patients. The ROI was placed on the lesion with the highest FDG uptake. If there was no significantly increased FDG uptake, the same sized circular ROI was drawn on the suspected adenoma location. For the normal pituitary gland, the same sized 3 mm ROI was used.

Fig. 1

figure 1

Images of ROI for pituitary adenoma on18F-FDG PET scan

Example of ROI definition in pituitary adenomas of 18F-FDG PET scan of the patients with CD. We draw the fixed circular ROI with a 3-mm diameter for pituitary adenomas (red circle) and normal pituitary gland (green circle)

ROI, Reason of interest; 18F-FDG PET, 18 F-fluorodeoxyglucose positron emission tomography; CD, Cushing disease

The mean standardized uptake value (SUVmean) and maximum SUV (SUVmax) for pituitary adenomas and normal pituitary glands were automatically measured using MIM, version 6.5 (Software Inc., Cleveland, OH, USA). The standardized uptake value (SUV) of the volume of interest was calculated as follows: (decoy-corrected activity (kBq) / volume (mL)) / (injected dose (kBq) / body weight (g)).

SUVmean and SUVmax of pituitary adenomas were divided into the SUVmean of normal pituitary glands for adjustment. We used the ratio of SUVmax to SUVmean to analyze the homogeneity of the pituitary adenomas.

MRI evaluation

All patients underwent pituitary MRI with a 3.0-Tesla scanner (Achieva, Philips Medical Systems, Best, the Netherlands). Imaging protocols included T1-weighted imaging, T2-weighted imaging, and delayed gadolinium-enhanced T1-weighted imaging. The extent, location, and sizes of the pituitary tumors were reviewed based on official records determined by radiologists.

Pituitary tumors were classified based on radiological findings using MRI of the sellar and parasellar regions. Type I refers to tumors < 1 cm in diameter limited to the sella. Type II tumors extend into the suprasellar space, < 1 cm from the diaphragm. Type III includes tumors extending into the suprasellar space > 1 cm from the diaphragm or sphenoid sinus and encroaching on the internal carotid arteries. Lastly, type IV refers to adenomas with obvious invasion into the cavernous sinus, as shown on MRI, and into the medial dural wall of the cavernous sinus, as confirmed during surgery.

BIPSS

Before surgery, BIPSS was performed to confirm the cause of CD and lateralize the tumors. A catheter was placed in patients using a unilateral femoral venous approach and 3 cc of blood was collected from the peripheral (P) and both inferior petrosal sinuses (IPS) [28]. CRH at a dose of 1 µg/kg was administered, and peripheral and petrosal samples were drawn after 5 and 10 min, respectively. The catheters and sheath were removed, and the groin was compressed under pressure until venous hemostasis was achieved.

The IPS:P prolactin ratio was calculated at each time point to confirm the accuracy of the inferior petrosal venous sampling. A value of ≥1.8 was considered successful IPS catheterization. The prolactin-normalized ACTH ratio was calculated by dividing the dominant ACTH IPS:P ratio by the concurrent and ipsilateral IPS:P prolactin ratio. A value of ≥1.3 was considered diagnostic of CD. An intersinus ACTH ratio of ≥1.4 either at baseline or after stimulation was used for lateralization of the pituitary adenoma [29].

Location of the adenoma

The final assignment of the true location of the pituitary adenoma was based on intraoperative multiple stage resection and tumor tissue identification using frozen sections. Surgically identified adenomas were histologically evaluated and stained for ACTH immunoreactivity. In cases of multiple specimens obtained during the procedure, the true location of the adenoma was assigned based on the original site of the specimen containing the adenoma [30].

Statistical analysis

Data are presented as medians (ranges) or numbers (percentages). The baseline characteristics of the patients were compared using Kruskal–Wallis’ test with Dunn’s procedure for nonparametric continuous variables. Categorical variables were compared using Fisher’s exact test. Spearman’s correlation coefficients were used to determine the correlation between FDG uptake and hormone levels. Wilcoxon’s signed-rank test was used to identify changes in the SUV after DEX administration.

The interobserver agreement for image analysis was assessed using κ statistics. κ values were categorized as follows: κ < 0.20 indicated poor agreement, κ of 0.21–0.40 indicated fair agreement, κ of 0.41–0.60 indicated moderate agreement, κ of 0.61–0.80 indicated good agreement, and κ > 0.81 indicated excellent agreement [31].

Statistical significance was set at a two-sided P < 0.05. All statistical analyses were performed using SPSS software (IBM Corp., Armonk, NY, USA).

Results

Patient characteristics

We enrolled all patients with CD who underwent two rounds of the 18F-FDG PET/CT with or without DEX suppression and sellar MRI before transsphenoidal adenectomy (TSA). Twenty-two patients were included (age at diagnosis: 37 [13–56] years), and most were women (90.91%). Patients’ baseline characteristics are shown in Table 1. There were 16 microadenomas and 6 macroadenomas. Immediate remission was achieved in 81.82% of the patients and delayed remission in 13.64%; one patient showed persistent disease after TSA. The median preoperative 24 h UFC, serum ACTH, and cortisol levels were 443.35 (93.00–4452.00) µg/day, 36.16 (6.00–92.00) pg/mL, and 18.55 (6.00–40.00) µg/dL. The size of pituitary adenomas on MRI was 7.85 (2.00–28.00) mm. The Ki-67 index of 47.06% of adenomas ranged from 1 to 2, that of 35.29% was below 1, and that of 17.65% was 2 or higher. Overall, 75.00% of the adenomas were classified as Knosp grade 0, 5.00% as grade 1, 5.00% as grade 3b, and 15.00% as grade 4. In total, 77.27% (17/22) of patients had an ACTH-staining adenoma. Only one patient showed unsuppressed cortisol levels on the HD DST.

Table 1 Patients’ imaging and clinical characteristics

MRI negative but PET positive case

Two patients showed negative MRI results, and one of them showed FDG uptakes on both 18F-FDG PET scans at baseline and after DEX suppression. A 26-year-old man visited our hospital complaining of weight gain and was diagnosed with ACTH-dependent CD. Cortisol secretion was suppressed on the HD DST; however, sellar MRI did not reveal any suspicious lesions. BIPSS revealed a central tumor (central/peripheral ACTH level of 36.25 after CRH stimulation) lateralized to the right side of the pituitary gland. The patient underwent 18F-FDG-PET/CT before and after DEX suppression to identify the primary lesions. Baseline PET/CT showed diffused FDG uptake with an SUVmax of 1.03 at the pituitary fossa but failed to localize the tumor. After DEX treatment, focal FDG uptake with an SUVmax of 1.06 remained at the right side of the pituitary fossa, which resulted in the successful localization of the corticotrophic adenoma. The MRI and PET/CT images of this case are presented in Fig. 2A–C. During TSA, the surgeon identified solid tumor-like tissues on the right side of the pituitary gland and successfully removed them. Results of pathology and ACTH immunohistochemistry were negative, but the patient achieved immediate biochemical remission and CD-related symptoms were relieved after surgery. We followed the patient for 98 months after the surgery and confirmed that he had lived without recurrence.

Fig. 2

figure 2

Images of a corticotroph with negative MRI but positive18 F-FDG PET/CT after DEX suppression

An MRI-negative adenoma was detected on 18F-FDG PET/CT at baseline and after DEX suppression. In this patient, the pituitary adenoma was visible on PET scans at baseline (B) and after DEX suppression (C) at the same location, as confirmed by the surgeon

A. Co-registered baseline 18F-FDG PET/CT and MRI images. Diffuse 18F-FDG uptake is detected in the pituitary fossa with an SUVmean of 0.86 and SUVmax of 1.03, but there was failure to localize the adenoma on baseline 18F-FDG PET/CT.

B. Co-registered 18F-FDG PET/CT and MRI images after DEX suppression. 18F-FDG uptake is not suppressed in the right side of the pituitary gland with an SUVmean of 1.03 and SUVmax of 1.06. 18F-FDG PET/CT after DEX suppression was successful in localizing the right-sided corticotrophic adenoma

C. MRI image. There is no suspicious lesion in the pituitary gland

ACTH, adrenocorticotropic hormone; MRI, magnetic resonance imaging; 18F-FDG, 18 F-fluorodeoxyglucose; PET/CT, positron emission tomography/computed tomography; DEX, dexamethasone; SUVmean, mean standardized uptake value; SUVmax, maximum standardized uptake value

Change of 18F-FDG uptake after DEX suppression

We included 18 pituitary adenomas that were successfully localized using PET/CT after DEX suppression, and analyzed the change of SUV for 15 adenomas, excluding outliers with SUV over 2.00. The results are presented in Fig. 3A and B. The SUVmean of adenomas did not changed after DEX suppression compared to normal pituitary glands (SUVmean of adenoma/SUVmean of normal pituitary glands: 1.13 [0.85–1.35] vs. 1.14 [0.87–1.39], z=-1.288, P = 0.198). DEX suppression increased SUVmax of adenomas compared to normal pituitary glands but without statistical significance (SUVmax of adenoma/SUVmean of normal pituitary glands: 1.13 [0.96–1.52] vs. 1.21 [0.97–1.56], z=-0.765, P = 0.444).

Fig. 3

figure 3

Changes in the SUVs of corticotrophs between18F-FDG PET/CT before and after DEX suppression

The SUVmean (A) and SUVmax (B) of corticotrophic adenomas are shown in this pairwise analysis. The SUVmean did not changed after DEX suppression from (z=-1.288, P = 0.198). The SUVmax of the corticotrophic adenoma increased from 1.13 to 1.21 (z=-0.765, P = 0.444). In this analysis, the SUVmean and SUVmax of pituitary adenomas were adjusted using the SUVmean of the normal pituitary gland. Colored plots and bars presented median and interquartile range in this figure. We presented the tumors with size larger than 5 mm and SUV adjusted by normal pituitary>1 for blue line

SUVmean, mean standardized uptake value; SUVmax, maximum standardized uptake value; DEX, dexamethasone; 18F-FDG, 18 F-fluorodeoxyglucose; PET/CT, positron emission tomography/computed tomography

In Fig. 3, the blue line indicates change in SUV of adenomas larger than 5 mm with higher FDG uptake than the surrounding pituitary parenchyma. For these adenomas, DEX suppression did not change the SUV (SUVmean of adenoma/SUVmean of normal pituitary glands: 1.31 [1.04–2.52] vs. 1.33 [1.05–2.38], z=-0.784, P = 0.433; SUVmax of adenoma/SUVmean of normal pituitary glands: 1.36 [1.02–2.61] vs. 1.40 [1.03–2.65], z=-1.022, P = 0.307).

The value of SUV increased in 73.33% adenomas, while the SUVmax increased in 66.67% compared with normal pituitary glands after DEX treatment.

Correlation between the hormone level and 18F-FDG uptake

Table 2 shows the results of the Spearman correlation analysis of the SUV with preoperative cortisol, ACTH, and nadir cortisol levels on the HD DST. On the baseline 18F-FDG PET scan, the SUVmax of the adenomas did not show any correlation with the levels of three hormones. The SUVmean of adenomas showed a positive correlation with nadir cortisol levels on the HD DST (P = 0.014) and preoperative ACTH levels, with marginal significance (P = 0.062). After DEX suppression, the SUVmax and SUVmean of adenomas had a positive correlation with moderate degrees of nadir cortisol on the HD DST (SUVmax: Spearman Rho = 503, P = 0.017; SUVmean: Spearman Rho = 0.554, P = 0.007).

Table 2 Correlation between FDG uptakes and hormone levels

FDG uptake of reference sites after DEX suppression

We evaluated the FDG uptake for five types of reference areas (normal pituitary gland, cerebellum, thalamus, white matter, and gray matter) (Table 3). Normal pituitary gland and white matter did not affect the unadjusted SUVmean by DEX suppression (all P >0.05). DEX significantly increased SUVmean of the thalamus and gray matter (thalamus, 8.70 [4.40–22.70] vs. 11.20 [6.40–17.5], P = 0.010*; gray matter, 6.25 [2.50–15.00] vs. 7.95 [5.00–11.90], P = 0.010*). However, SUVmean of the cerebellum significantly decreased after DEX administration (7.65 [4.50–10.80] vs. 6.40 [2.60–12.00], P = 0.006*).

Table 3 The change of FDG uptake for reference sites after DEX suppression in the patients with CD

Qualitative analysis by diagnostic modalities for CD

The qualitative results of localizing pituitary adenomas in CD patients are shown in Table 4 and Fig. 4. Only 13 patients had BIPSS results. The success rates were 90.91% for MRI and 84.62% for BIPSS.

Table 4 Qualitative analysis by diagnostic modalities for CD
Fig. 4

figure 4

Images for corticotroph adenomas that appear different for localization in18F-FDG PET/CT.

9 mm sized adenoma in the left lateral wing of pituitary gland. It was found in the left lateral wing of the pituitary gland, showing an 18F-FDG uptake in the pituitary fossa with an SUVmean of 1.04 and SUVmax of 1.07. However, after DEX suppression, the left side of the pituitary gland did not exhibit suppressed 18F-FDG uptake, with SUVmean 1.05 SUVmax 1.14

(A). Co-registered baseline 18F-FDG PET/CT and MRI images. (B). Co-registered 18F-FDG PET/CT and MRI images after DEX suppression. (C). MRI image

2 mm pituitary adenoma was detected at the left lateral wing, showing diffuse FDG uptake in the pituitary fossa with an SUVmean of 0.86 and SUVmax of 1.04. After DEX suppression, focal FDG uptake was observed, with SUVmean 0.87 and SUVmax 0.98. (D). Co-registered baseline 18F-FDG PET/CT and MRI images. (E). Co-registered 18F-FDG PET/CT and MRI images after DEX suppression. (F). MRI image

In baseline PET scans, the specialists agreed that pituitary adenomas were visible in 17 scans and not visible in 5 scans. They reached a consensus that the tumor was evident in two scans, but there was a discrepancy in their assessments of its location.

After DEX suppression, pituitary adenomas showed positive results in 16 scans and negative results in 5 scans. Specialists disagreed on the presence of pituitary adenomas in one case only.

Interobserver agreement for localizing adenomas was 0.872 (95%CI: 0.711, 1.033) for baseline PET/CT and 0.938 (95%CI: 0.762, 1.056) for post dexamethasone suppression PET/CT, confirming excellent interobserver agreements, and the result was judged reliable. Among the instances where both opinions agreed, there were no lesions that showed differences in visibility between scans before and after DEX administration. This meant that lesions were either consistently visible or invisible in both scenarios.

Discussion

We found that DEX suppression did not improve localization of ACTH-secreting pituitary adenomas using 18F-FDG PET/CT. Further, it did not significantly affect FDG uptakes in adrenocorticotrophic adenomas or normal pituitaries in patients with CD. The decision to administer 8 mg dexamethasone was based on the standard high-dose DST, which is internationally recommended for differentiating between ectopic ACTH secretion and CD [26]. This test involved comparing serum cortisol levels at 8 am before and after a single dose of 8 mg dexamethasone administered at 11 pm. Suppression of the serum cortisol level to less than 50% of the baseline value indicated a diagnosis of CD [3233]. Previous studies have reported that the 8-mg DST has a sensitivity of 90%, specificity of 100%, accuracy of 96.8%, positive predictive value of 100%, and negative predictive value of 95.5% [3435]. Our use of 8 mg dexamethasone was based on the theory that orally administering dexamethasone at this dose can effectively suppress cortisol levels in ACTH-secreting pituitary tumors.

We expected that FDG uptake by corticotrophic adenomas would not decrease after DEX administration in patients with CD, and this change may improve the ability to discriminate the tumor location from surrounding tissues on 18F-FDG PET. The SUVmax of pituitary adenomas adjusted for the normal pituitary gland increased from 1.13 to 1.21. However, this change was not statistically significant, and the success rate of localizing corticotrophic adenomas using 18F-FDG PET was not significantly improved after DEX suppression. If the FDG uptake of adenomas changed lesser compared to that of surrounding normal tissues after DEX suppression, the tumor could be more easily visualized because of the difference.

In addition, we attempted to evaluate FDG uptakes in other brain areas (cerebellum, thalamus, white matter, and gray matter) according to DEX administration in CD patients. SUVmean of the cerebellum decreased significantly, but that of the thalamus and gray matter increased after DEX suppression. DEX did not change FDG uptake in pituitary adenoma, normal pituitary, or white matter. In a previous study analyzing FDG PET in CD patients, researchers observed varying correlations between FDG uptake and blood cortisol concentration across different brain regions [3536]. Nevertheless, the examination did not include an analysis of FDG uptake in the pituitary gland. Additionally, no previous studies have explored the effects of high-dose dexamethasone suppression on brain glucose metabolism in individuals with CD. Further studies are needed to explain the change in FDG uptake after DEX administration in patients with CD.

18F-FDG PET/CT provides information regarding glucose metabolism in the brain in vivo and has been widely used to evaluate brain metabolism in clinical and research settings [37]. Here, the nadir cortisol level on the HD DST correlated with the SUVmean and SUVmax of pituitary adenomas on PET scans after DEX suppression. Cortisol secretion activity is thought to be associated with metabolic activity, and DEX administration altered this. Cortisol levels and FDG uptake in other regions of the brain are correlated in patients with CD, but the correlation between cortisol and FDG uptake in the pituitary glands and/or corticotrophic adenomas themselves has not been discussed [3536]. In our study, cortisol levels did not show a correlation with FDG uptake of corticotrophic adenomas, but after DEX suppression FDG uptake showed a correlation with the nadir cortisol level on the HD DST. This indicated that tumors in which cortisol secretion was less suppressed by on the HD DST showed higher FDG uptake than tumors with lower cortisol levels on the HD DST.

Although many studies have analyzed FDG uptake of brain tumors, reference sites defined in each study varied without a uniform standard. Gray matter, white matter, or adjacent tumor tissue was defined as a reference site [38,39,40]. We measured SUVmean of normal pituitary tissues, gray matter, white matter, thalamus, and cerebellum as possible references. We defined the SUVmean of normal pituitary tissues as a reference because the localization of adenomas requires an apparent difference between the adenoma and surrounding tissues.

Use of fixed ROI to measure FDG uptake caused partial volume effect in this study. However, lesions smaller than 5 mm with intense FDG uptake may still show increased FDG uptake, especially in tumors, albeit with lower SUV values compared with the actual values [41]. This study was performed because pituitary adenomas smaller than 5 mm with higher FDG uptake than the surrounding pituitary parenchyma have been observed in routine clinical practice. To control for the partial volume effect, the analysis was performed again for tumors which were larger than 5 mm and had higher FDG uptake than the surrounding pituitary parenchyma, and the results remained unchanged.

PET/CT has been explored as an alternative to or combined with MRI for the localization of corticotrophic adenomas. 18F-FDG PET/CT has a limited role in CD diagnosis, but CRH stimulation can increase its success rate [2242]. This study is important for increasing the effectiveness of PET using DEX. In addition, data on DEX effect on brain metabolism in patients with CD will be important for future studies.

Conclusions

DEX suppression did not improve the localization of 18F-FDG PET/CT in patients with CD. This is considered to have sufficient significance in an effort to increase the diagnostic value of 18F-FDG PET/CT.

Data Availability

All datasets generated and/or analyzed during the current study are not publicly available but are available from the corresponding author upon reasonable request.

Abbreviations

18F-FDG:
18F-fluorodeoxyglucose
PET/CT:
Positron emission tomography/computed tomography
DEX:
Dexamethasone
MRI:
Magnetic resonance imaging
BIPSS:
Bilateral inferior petrosal sinus sampling
CD:
Cushing’s disease
SUV:
Standardized uptake value
ACTH:
Adrenocorticotropic hormone
CRH:
Corticotrophin-releasing hormone
FDG:
Fluorodeoxyglucose
24hr UFC:
24-hour urine free cortisol
ON DST:
Overnight dexamethasone suppression test
HD DST:
High-dose dexamethasone suppression test
SUVmean :
Mean standardized uptake value
SUVmax :
Maximum standardized uptake value
P:
Peripheral
IPS:
Inferior petrosal sinuses
TSA:
Transsphenoidal adenectomy

References

  1. Newell-Price J, Bertagna X, Grossman AB, Nieman LK. Cushing’s syndrome. The Lancet. 2006;367:1605–17.

    Article CAS Google Scholar

  2. Steffensen C, Bak AM, Rubeck KZ, Jørgensen JOL. Epidemiology of Cushing’s syndrome. Neuroendocrinology. 2010;92:1–5.

    Article CAS PubMed Google Scholar

  3. Lacroix A, Feelders RA, Stratakis CA, Nieman LK. Cushing’s syndrome. The Lancet. 2015;386:913–27.

    Article CAS Google Scholar

  4. Moshang T Jr. Cushing’s Disease, 70 years later … and the beat goes on. J Clin Endocrinol Metab. 2003;88:31–3.

    Article CAS PubMed Google Scholar

  5. Bochicchio D, Losa M, Buchfelder M. Factors influencing the immediate and late outcome of Cushing’s disease treated by transsphenoidal surgery: a retrospective study by the european Cushing’s Disease Survey Group. J Clin Endocrinol Metab. 1995;80:3114–20.

    CAS PubMed Google Scholar

  6. Prevedello DM, Pouratian N, Sherman J, Jane JA, Vance ML, Lopes MB, et al. Management of Cushing’s disease: outcome in patients with microadenoma detected on pituitary magnetic resonance imaging: clinical article. J Neurosurg. 2008;109:751–9.

    Article PubMed Google Scholar

  7. Rees DA, Hanna FWF, Davies JS, Mills RG, Vafidis J, Scanlon MF. Long-term follow-up results of transsphenoidal surgery for Cushing’s disease in a single centre using strict criteria for remission. Clin Endocrinol (Oxf). 2002;56:541–51.

    Article CAS PubMed Google Scholar

  8. Semple PL, Vance ML, Findling J, Laws ER. Transsphenoidal surgery for Cushing’s disease: outcome in patients with a normal magnetic resonance imaging scan. Neurosurgery. 2000;46:553–8. discussion 558–559.

    Article CAS PubMed Google Scholar

  9. Chittiboina P, Montgomery BK, Millo C, Herscovitch P, Lonser RR. High-resolution(18)F-fluorodeoxyglucose positron emission tomography and magnetic resonance imaging for pituitary adenoma detection in Cushing disease. J Neurosurg. 2015;122:791–7.

    Article PubMed Google Scholar

  10. Chowdhury IN, Sinaii N, Oldfield EH, Patronas N, Nieman LK. A change in pituitary magnetic resonance imaging protocol detects ACTH-secreting tumours in patients with previously negative results. Clin Endocrinol (Oxf). 2010;72:502–6.

    Article PubMed Google Scholar

  11. Finelli DA, Kaufman B. Varied microcirculation of pituitary adenomas at rapid, dynamic, contrast-enhanced MR imaging. Radiology. 1993;189:205–10.

    Article CAS PubMed Google Scholar

  12. Kasaliwal R, Sankhe SS, Lila AR, Budyal SR, Jagtap VS, Sarathi V, et al. Volume interpolated 3D-spoiled gradient echo sequence is better than dynamic contrast spin echo sequence for MRI detection of corticotropin secreting pituitary microadenomas. Clin Endocrinol (Oxf). 2013;78:825–30.

    Article CAS PubMed Google Scholar

  13. Fukuoka H, Shichi H, Yamamoto M, Takahashi Y. The Mechanisms Underlying Autonomous adrenocorticotropic hormone secretion in Cushing’s Disease. Int J Mol Sci. 2020;21:9132.

    Article CAS PubMed PubMed Central Google Scholar

  14. Lamberts SWJ. Glucocorticoid receptors and Cushing’s disease. Mol Cell Endocrinol. 2002;197:69–72.

    Article CAS PubMed Google Scholar

  15. van Rossum EFC, Lamberts SWJ. Glucocorticoid resistance syndrome: a diagnostic and therapeutic approach. Best Pract Res Clin Endocrinol Metab. 2006;20:611–26.

    Article PubMed Google Scholar

  16. Alzahrani AS, Farhat R, Al-Arifi A, Al-Kahtani N, Kanaan I, Abouzied M. The diagnostic value of fused positron emission tomography/computed tomography in the localization of adrenocorticotropin-secreting pituitary adenoma in Cushing’s disease. Pituitary. 2009;12:309–14.

    Article CAS PubMed Google Scholar

  17. De Souza B, Brunetti A, Fulham MJ, Brooks RA, DeMichele D, Cook P, et al. Pituitary microadenomas: a PET study. Radiology. 1990;177:39–44.

    Article PubMed Google Scholar

  18. Campeau RJ, David O, Dowling AM. Pituitary adenoma detected on FDG positron emission tomography in a patient with mucosa-associated lymphoid tissue lymphoma. Clin Nucl Med. 2003;28:296–8.

    Article PubMed Google Scholar

  19. Jeong SY, Lee S-W, Lee HJ, Kang S, Seo J-H, Chun KA, et al. Incidental pituitary uptake on whole-body 18F-FDG PET/CT: a multicentre study. Eur J Nucl Med Mol Imaging. 2010;37:2334–43.

    Article PubMed Google Scholar

  20. Ju H, Zhou J, Pan Y, Lv J, Zhang Y. Evaluation of pituitary uptake incidentally identified on 18F-FDG PET/CT scan. Oncotarget. 2017;8:55544–9.

    Article PubMed PubMed Central Google Scholar

  21. Koo CW, Bhargava P, Rajagopalan V, Ghesani M, Sims-Childs H, Kagetsu NJ. Incidental detection of clinically occult pituitary adenoma on whole-body FDG PET imaging. Clin Nucl Med. 2006;31:42–3.

    Article PubMed Google Scholar

  22. Boyle J, Patronas NJ, Smirniotopoulos J, Herscovitch P, Dieckman W, Millo C, et al. CRH stimulation improves 18F-FDG-PET detection of pituitary adenomas in Cushing’s disease. Endocrine. 2019;65:155–65.

    Article CAS PubMed Google Scholar

  23. Valassi E, Biller BMK, Swearingen B, Pecori Giraldi F, Losa M, Mortini P, et al. Delayed remission after transsphenoidal surgery in patients with Cushing’s disease. J Clin Endocrinol Metab. 2010;95:601–10.

    Article CAS PubMed PubMed Central Google Scholar

  24. Dai C, Feng M, Sun B, Bao X, Yao Y, Deng K, et al. Surgical outcome of transsphenoidal surgery in Cushing’s disease: a case series of 1106 patients from a single center over 30 years. Endocrine. 2022;75:219–27.

    Article CAS PubMed Google Scholar

  25. Hinojosa-Amaya JM, Cuevas-Ramos D. The definition of remission and recurrence of Cushing’s disease. Best Pract Res Clin Endocrinol Metab. 2021;35:101485.

    Article PubMed Google Scholar

  26. Fleseriu M, Auchus R, Bancos I, Ben-Shlomo A, Bertherat J, Biermasz NR, et al. Consensus on diagnosis and management of Cushing’s disease: a guideline update. Lancet Diabetes Endocrinol. 2021;9:847–75.

    Article PubMed PubMed Central Google Scholar

  27. Nieman LK, Biller BMK, Findling JW, Newell-Price J, Savage MO, Stewart PM, et al. The diagnosis of Cushing’s syndrome: an endocrine Society Clinical Practice Guideline. J Clin Endocrinol Metab. 2008;93:1526–40.

    Article CAS

    1.  PubMed PubMed Central Google Scholar
    2. Park JW, Park S, Kim JL, Lee HY, Shin JE, Hyun DH, et al. Bilateral inferior petrosal sinus sampling by unilateral femoral venous approach. Neurointervention. 2011;6:23–6.

      Article PubMed PubMed Central Google Scholar

    3. Sharma ST, Raff H, Nieman LK. Prolactin as a marker of successful catheterization during IPSS in patients with ACTH-Dependent Cushing’s syndrome. J Clin Endocrinol Metab. 2011;96:3687–94.

      Article CAS PubMed PubMed Central Google Scholar

    4. Lim JS, Lee SK, Kim SH, Lee EJ, Kim SH. Intraoperative multiple-staged resection and tumor tissue identification using frozen sections provide the best result for the accurate localization and complete resection of tumors in Cushing’s disease. Endocrine. 2011;40:452–61.

      Article CAS PubMed Google Scholar

    5. Jakobsson U, Westergren A. Statistical methods for assessing agreement for ordinal data. Scand J Caring Sci. 2005;19:427–31.

      Article PubMed Google Scholar

    6. Dichek HL, Nieman LK, Oldfield EH, Pass HI, Malley JD, Cutler GB. A comparison of the standard high dose dexamethasone suppression test and the overnight 8-mg dexamethasone suppression test for the differential diagnosis of adrenocorticotropin-dependent Cushing’s syndrome. J Clin Endocrinol Metab. 1994;78:418–22.

      Article CAS PubMed Google Scholar

    7. Aytug S, Laws ER, Vance ML. Assessment of the utility of the high-dose dexamethasone suppression test in confirming the diagnosis of cushing disease. Endocr Pract Off J Am Coll Endocrinol Am Assoc Clin Endocrinol. 2012;18:152–7.

      Google Scholar

    8. Sriussadaporn S, Ploybutr S, Peerapatdit T, Plengvidhya N, Nitiyanant W, Vannasaeng S, et al. Nocturnal 8 mg dexamethasone suppression test: a practical and accurate test for identification of the cause of endogenous Cushing’s syndrome. Br J Clin Pract. 1996;50:9–13.

      Article CAS PubMed Google Scholar

    9. Liu S, Wang Y, Xu K, Ping F, Li F, Wang R, et al. Voxel-based comparison of brain glucose metabolism between patients with Cushing’s disease and healthy subjects. NeuroImage Clin. 2018;17:354–8.

      Article PubMed Google Scholar

    10. Liu S, Wang Y, Xu K, Ping F, Wang R, Li F, et al. Brain glucose metabolism is associated with hormone level in Cushing’s disease: a voxel-based study using FDG-PET. NeuroImage Clin. 2016;12:415–9.

      Article PubMed PubMed Central Google Scholar

    11. Sokoloff L, Reivich M, Kennedy C, Rosiers MHD, Patlak CS, Pettigrew KD, et al. The [14c]deoxyglucose method for the measurement of local cerebral glucose utilization: Theory, Procedure, and normal values in the conscious and anesthetized albino Rat1. J Neurochem. 1977;28:897–916.

      Article CAS PubMed Google Scholar

    12. Chen W, Silverman DHS. Advances in evaluation of primary brain tumors. Semin Nucl Med. 2008;38:240–50.

      Article PubMed Google Scholar

    13. Delbeke D, Meyerowitz C, Lapidus RL, Maciunas RJ, Jennings MT, Moots PL, et al. Optimal cutoff levels of F-18 fluorodeoxyglucose uptake in the differentiation of low-grade from high-grade brain tumors with PET. Radiology. 1995;195:47–52.

      Article CAS PubMed Google Scholar

    14. Meric K, Killeen RP, Abi-Ghanem AS, Soliman F, Novruzov F, Cakan E, et al. The use of 18F-FDG PET ratios in the differential diagnosis of common malignant brain tumors. Clin Imaging. 2015;39:970–4.

      Article PubMed Google Scholar

    15. Soret M, Bacharach SL, Buvat I. Partial-volume effect in PET tumor imaging. J Nucl Med. 2007;48:932–45.

      Article PubMed Google Scholar

    16. Xin C, Rui-xue C, Hui P, Tao Y, Hui-Juan Z, Fang L. Value of [18F] fluoro-2-deoxy-D-glucose positron emission tomography/computed tomography in diagnosis and localization of Cushing’s disease. Zhongguo Yi Xue Ke Xue Yuan Xue Bao. 2011;33:107–10.

      PubMed Google Scholar

    Download references

    Acknowledgements

    We would like to thank Editage (www.editage.co.kr) for English language editing.

    Funding

    The study was supported by the “Team Science Award” of Yonsei University College of Medicine (6-2022-0150).

    Author information

    Authors and Affiliations

    1. Endocrinology, Institute of Endocrine Research, Department of Internal Medicine, Yonsei University College of Medicine, Seoul, Republic of Korea

      Kyungwon Kim, Cheol Ryong Ku & Eun Jig Lee

    2. Department of Radiology, Severance Hospital, Yonsei University College of Medicine, Seoul, Republic of Korea

      Dong Kyu Kim

    3. Department of Neurosurgery, Severance Hospital, Yonsei University College of Medicine, Seoul, Republic of Korea

      Ju Hyung Moon, Eui Hyun Kim & Sun Ho Kim

    Contributions

    Conception and design: EJL, CRK, KK. Acquisition of data: KK, DKK. Analysis and interpretation of data: KK. Drafting the article: KK. Administrative/technical/material support: JHM, EHK, SHK. Study supervision: EJL, CRK. Writing, review, and revision of the manuscript: KK, DKK, SHK, CRK. Final approval of the manuscript: CRK, EJL.

    Corresponding authors

    Correspondence to Cheol Ryong Ku or Eun Jig Lee.

    Ethics declarations

    Ethics approval and consent to participate

    The data were collected under the conditions of regular clinical care with approval from the ethics committee of our hospital, and the requirement for written informed consent was waived owing to its retrospective design (institutional review board number: 2023-0110-001).

    Consent for publication

    Not applicable.

    Competing interests

    The authors declare no conflicts of interest that could be perceived as prejudicing the impartiality of this study.

    Additional information

    Publisher’s Note

    Springer Nature remains neutral with regard to jurisdictional claims in published maps and institutional affiliations.

    Electronic supplementary material

    Additional file 1 of Dexamethasone suppression for 18F-FDG PET/CT to localize ACTH-secreting pituitary tumors

    Additional file 1

    Below is the link to the electronic supplementary material.

    Cite this article

    Kim, K., Kim, D.K., Moon, J.H. et al. Dexamethasone suppression for 18F-FDG PET/CT to localize ACTH-secreting pituitary tumors. Cancer Imaging 23, 85 (2023). https://doi.org/10.1186/s40644-023-00600-8

    Download citation

    Share this article

    Anyone you share the following link with will be able to read this content:

    Get shareable linkProvided by the Springer Nature SharedIt content-sharing initiative

    Keywords

    • 18F-FDG PET/CT
    • ACTH-secreting pituitary tumor
    • Cushing’s disease
    • Dexamethasone suppression
    • High-dose dexamethasone suppression test

    From https://cancerimagingjournal.biomedcentral.com/articles/10.1186/s40644-023-00600-8

Association of IGF-1 Level with Low Bone Mass in Young Patients with Cushing’s Disease

Abstract

Purpose. Few related factors of low bone mass in Cushing’s disease (CD) have been identified so far, and relevant sufficient powered studies in CD patients are rare. On account of the scarcity of data, we performed a well-powered study to identify related factors associated with low bone mass in young CD patients.

Methods. This retrospective study included 153 CD patients (33 males and 120 females, under the age of 50 for men and premenopausal women). Bone mineral density (BMD) of the left hip and lumbar spine was measured by dual energy X-ray absorptiometry (DEXA). In this study, low bone mass was defined when the Z score was −2.0 or lower. Results. Among those CD patients, low bone mass occurred in 74 patients (48.37%). Compared to patients with normal BMD, those patients with low bone mass had a higher level of serum cortisol at midnight (22.31 (17.95-29.62) vs. 17.80 (13.75-22.77), ), testosterone in women (2.10 (1.33–2.89) vs. 1.54 (0.97–2.05), ), higher portion of male (32.43% vs. 11.54%, ) as well as hypertension (76.12% vs. 51.67%, ), and lower IGF-1 index (0.59 (0.43–0.76) vs. 0.79 (0.60–1.02), ). The Z score was positively associated with the IGF-1 index in both the lumbar spine (r = 0.35153, ) and the femoral neck (r = 0.24418, ). The Z score in the femoral neck was negatively associated with osteocalcin (r = −0.22744, ). Compared to the lowest tertile of the IGF-1 index (<0.5563), the patients with the highest tertile of the IGF-1 index (≥0.7993) had a lower prevalence of low bone mass (95% CI 0.02 (0.001–0.50), ), even after adjusting for confounders such as age, gender, duration, BMI, hypertension, serum cortisol at midnight, PTH, and osteocalcin.

Conclusions. The higher IGF-1 index was independently associated with lower prevalence of low bone mass in young CD patients, and IGF-1 might play an important role in the pathogenesis of CD-caused low bone mass.

1. Introduction

Cushing’s disease (CD), caused by an adrenocorticotropic hormone (ACTH)-secreting pituitary tumor, is a rare disease with approximately 1.2 to 2.4 new cases per million people each year [1].

Osteoporosis has been recognized as a serious consequence of endogenous hypercortisolism since the first description in 1932 [2]. The prevalence of osteoporosis is around 38–50%, and the rate of atraumatic compression fractures is 15.8% in CD patients [3]. After cortisol normalization and appropriate treatment, recovery of the bone impairment occurs slowly (6–9 years) and partially [45]. Hypercortisolemia impairs bone quality through multiple mechanisms [6]. Growth hormone (GH) and insulin-like growth factor 1 (IGF-1) play a crucial role in bone growth and development [7]. IGF-1 is considered essential for the longitudinal growth of bone, skeletal maturity, and bone mass acquisition not only during growth but also in the maintenance of bone in adults [8]. Previous research studies revealed that low serum IGF-1 levels were associated with a 40% increased risk of fractures [910], and serum IGF-1 levels could be clinically useful for evaluating the risk of spinal fractures [11]. In Marl Hotta’s research, extremely low or no response of plasma GH to recombinant human growth hormone (hGRH) injection was noted in CD patients. This result suggested that the diminished hGRH-induced GH secretion in patients with Cushing’s syndrome might be caused by the prolonged period of hypercortisolemia [12]. Other surveys indicated that glucocorticoids, suppressing GH–IGF-1 and the hypothalamic-pituitary-gonadal axes, lead to decreased number and dysfunction of osteoblast [13].

However, the exact mechanism is still unclear, and few risk factors for osteoporosis in CD have been identified so far. Until now, relevant and sufficiently powered studies in CD patients have been rare [1415]. Early recognition of the changes in bone mass in CD patients contributes to early diagnosis of bone mass loss and prompt treatment, which could help minimize the incidence of adverse events such as fractures.

On account of the scarcity of data and pressing open questions concerning risk evaluation and management of osteoporosis, we performed a well-powered study to identify the related factors associated with low bone mass in young CD patients at the time of diagnosis.

2. Materials and Methods

2.1. Subjects

This retrospective study enrolled 153 CD patients (33 males and 120 females) from the Department of Endocrinology and Metabolism of Huashan Hospital between January 2010 and February 2021. All subjects were evaluated by the same group of endocrinologists for detailed clinical evaluation. This study, which was in complete adherence to the Declaration of Helsinki, was approved by the Human Investigation Ethics Committee at Huashan Hospital, Fudan University (No. 2017M011). We collected data on demographic characteristics, laboratory tests, and bone mineral density.

Inclusion criteria included the following: (1) willingness to participate in the study; (2) premenopausal women ≥18 years old, men ≥18 years old but younger than 50 years old, and young women (<50 years old) with menstrual abnormalities who were associated with CD after excluding menstrual abnormalities caused by other causes; (3) diagnosis of CD according to the updated diagnostic criteria [16]; and (4) pathological confirmation after transsphenoidal surgery (positive immunochemistry staining with ACTH). Exclusion criteria included Cushing’s syndrome other than pituitary origin.

2.2. Clinical and Biochemical Methods

IGF-1 was measured using the Immulite 2000 enzyme-labeled chemiluminescent assay (Siemens Healthcare Diagnostic, Surrey, UK). Other endocrine hormones, including cortisol (F), 24-hour urinary free cortisol (24hUFC), adrenocorticotropic hormone (ACTH), prolactin (PRL), luteinizing hormone (LH), follicle stimulating hormone (FSH), estrogen (E2), progesterone (P), testosterone (T), thyroid stimulating hormone (TSH), and free thyroxine (FT4), were carried out by the chemiluminescence assay (Advia Centaur CP). Intra-assay and interassay coefficients of variation were less than 8 and 10%, respectively, for the estimation of all hormones.

Bone metabolism markers included osteocalcin (OC), type I procollagen amino-terminal peptide (P1NP), parathyroid hormone (PTH), and 25-hydroxyvitamin D (25(OH)VD), measured in a Roche Cobas e411 analyzer using immunometric assays (Roche Diagnostics, Indianapolis, IN, USA).

The IGF-1 index was defined as the ratio of the measured value to the respective upper limit of the reference range for age and sex. Body mass index (BMI) was calculated using the following formula: weight (kg)/height2 (m2). The bone mineral density (BMD) measuring instrument was Discovery type W dual energy X-ray absorptiometry from the American HOLOGIC company. Quality control tests were conducted every working day. Before examination, the date of birth, height, weight, and menopause date of the examiner were accurately recorded, and then BMD (g/cm2) of the left hip and lumbar spine were measured by DEXA. Z value was used for premenopausal women and men younger than 50 years old, and Z-value = (measured value − mean bone mineral density of peers)/standard deviation of BMD of peers [1718]. In this study, low bone mass was defined as a Z-value of −2.0 or lower.

2.3. Statistical Analysis

The baseline characteristics were compared between CD patients with and without low bone mass by using the Student’s t-test for continuous variables and the χ2 test for category variables. Bone turnover markers, alanine aminotransferase (ALT), triglyceride (TG), IGF-1 index, thyroid stimulating hormone (TSH), free triiodothyronine (FT3), free thyroxine (FT4), testosterone (T), 24 hours of urine cortisol (24 h UFC), and serum cortisol at 8 a.m. (F8 am) and at midnight (F24 pm) were not in normal distribution, so variables mentioned above were Log10-transformed, which could be used as continuous variables during statistical analysis. Participants were categorized into three groups according to tertiles of the IGF-1 index: <0.5986, 0.5986–0.8380, and >0.8380. The linear trend across IGF-1 index tertiles was tested using linear regression analysis for continuous variables and the Cochran–Armitage test for categorical variables. We used a multivariate logistic regression model to identify related factors that are independently associated with the risk of low bone mass. Variables included in the multivariate logistic regression model were selected based on the Spearman rank correlation analysis and established traditional low bone mass risk factors as priors. The results were presented as odds ratios (OR) and the corresponding 95% confidence intervals (CI). Significance tests were two-tailed, with  value <0.05 considered statistically significant for all analyses. Statistical analysis was performed using SAS version 9.3 (SAS Institute Inc, Cary, NC, USA).

3. Results

3.1. The Prevalence of Low Bone Mass in Young Cushing’s Disease Patients

From the inpatient system of Huashan hospital, a total of 153 CD patients under the age of 50 for men and premenopausal women (some with menstrual abnormalities were associated with CD) were included, aged from 13 to 49 years, with an average age of 34.25 ± 8.39 years. There were 33 males (21.57%) and 120 females (78.43%). These CD patients included newly diagnosed CD, recurrences of CD, and CD without remission after treatment. There were no differences in the prevalence of different statuses of CD between the two groups (Table 1).

Table 1 
Clinical and biochemical preoperative characteristics of young Cushing’s disease patients according to status of bone mineral density at diagnosis.

Among these CD patients, low bone mass occurred in 74 patients (48.37%), including 24 men and 50 women. The prevalence of low bone mass was 41.67% and 72.73% in female and male CD patients, respectively, and 42 (56.76%) patients suffered from low bone mass in the lumbar spine only, while 10 (13.51%) patients had low bone mass in the femoral neck only, and 22 (29.73%) patients had low bone mass in both parts.

In female patients with low bone mass, 27 (54%) had low bone mass in the lumbar region only, 9 (18%) in the femoral neck only, and 14 (28%) had low bone mass in both parts. For male patients with low bone mass, 16 (66.67%) patients had low bone mass only in the lumbar region, and the rest (8, 33.33%) had low bone mass in both parts.

Ten patients had a history of fragility fractures (6 ribs, 3 vertebrae, 1 femoral neck, and ribs), and all of them achieved low bone mass in BMD.

3.2. Baseline Characteristics of Cushing’s Disease Patients with and without Low Bone Mass

These CD patients were divided into two groups with and without low bone mass (Table 1). Compared to patients without low bone mass, those low bone mass patients had a higher level of diastolic blood pressure (DBP) (97.07 ± 13.69 vs. 89.76 ± 13.43, ), serum creatinine (66.15 ± 24.33 vs. 55.90 ± 13.35, ), uric acid (0.36 ± 0.10 vs. 0.32 ± 0.10, ), cholesterol (5.57 ± 1.30 vs. 5.06 ± 1.47, ), testosterone in women (2.10 (1.33–2.89) vs. 1.54 (0.97–2.05), ), F24 pm (22.31 (17.95–29.62) vs. 17.80 (13.75–22.77), ), and higher portion of male (32.43% vs. 11.54%, ), as well as hypertension (76.12% vs. 51.67%, ). The low bone mass group had a lower IGF-1 index (0.59 (0.43–0.76) vs. 0.79 (0.60–1.02), ) and FT3 level (3.54 (3.16–4.04) vs. 3.98 (3.47–4.45), ) than those without low bone mass. CD patients without low bone mass were more likely to have serum IGF-1 above the upper limit of the normal reference range (ULN) with age-adjusted (18, 26.87% vs. 3, 4.84%, ). No differences of bone turnover makers were found between the two groups.

3.3. Association between Baseline Characteristics and BMD

Spearman’s rank correlation analysis was used to explore the related factors of low bone mass in young CD patients (Table 2). The results indicated that the Z score in the lumbar spine was positively associated with age at diagnosis (r = 0.18801, ), IGF-1 index (r = 0.35153, ), FT3 level (r = 0.24117, ), estradiol in women (r = 0.2361, ), and occurrence of normal menstruation in females (r = 0.2267, ). Meanwhile, SBP (r = −0.21575, ), DBP (r = −0.32538, ), ALT (r = −0.17477, ), serum creatinine (r = −0.36072, ), cholesterol (r = −0.20205, ), testosterone in women (r = −0.2700, ), F8 am (r = −0.18998, ), and serum cortisol at midnight (r = −0.27273, ) were negatively associated with the Z-score in the lumbar spine. The results also illustrated that the Z-score in the femoral neck was positively associated with BMI (r = 0.33926, ), IGF-1 index (r = 0.24418, ), FT3 level (r = 0.20487, ), and occurrence of normal menstruation in females (r = 0.2393, ). Serum creatinine (r = −0.1932, ), osteocalcin (r = −0.22744, ), and testosterone in women (r = −0.2363, ) were negatively associated with the Z-score in the femoral neck.

Table 2 
Spearman rank correlation of BMD and various variables in Cushing’s disease patients.
3.4. IGF-1 Index and Low Bone Mass

Participants were categorized into the following three groups according to tertiles of the preoperative IGF-1 index: <0.5986 (tertiles 1), 0.5986–0.8380 (tertiles 2), and >0.8380 (tertiles 3). With the IGF-1 index increasing, the level of PTH decreased (54.85 (38.35–66.2), 38.9 (26.6–66.9), 36 (25.5–47.05), and ), while other bone metabolism makers, including PINP, osteocalcin, and 25 (OH) VD, showed no differences among the three groups (Figures 1(a)1(d)). With the increase in the IGF-1 index level, the Z-score of both vertebra lumbalis (tertiles 1: −2.4 (−3.3∼−1.5); tertiles 2: −1.9 (−2.3∼−1.0); tertiles 3: −1.15 (−1.9∼−0.4), ) and the neck of femur (tertiles 1: −1.7 (−2.3∼−0.95); tertiles 2: −1.2 (−1.9∼−0.5); tertiles 3: −1.0 (−1.5∼−0.5), ) increased gradually (Figures 2(a) and 2(b)). Meanwhile, prevalence of low bone mass decreased (68.29%, 53.33%, 23.81%, ) (Figure 3(a)) both in the vertebra lumbalis (63.41%, 48.89%, 16.67%, ) and the neck of femur (32.5%, 11.11%, 11.19%, ), with the increasing of the IGF-1 index level (Figures 3(b) and 3(c)).

Figure 1 
Bone turnover makers in three groups according to tertiles of the preoperative IGF-1 index. Tertiles 1: <0.5986, tertiles 2: 0.5986–0.8380, and tertiles 3 >0.8380. a for PINP; b for osteocalcin; c for PTH; d for VD-OH25. (a) p for trend = 0.2601. (b) p for trend = 0.1310. (c) p for trend = 0.008. (d) p for trend = 0.7956.
Figure 2 
Z-score of both the neck of femur and the vertebra lumbalis in three tertiles of the IGF-1 index. a for the neck of femur; b for the vertebra lumbalis. Tertiles 1: <0.5986, tertiles 2: 0.5986–0.8380, and tertiles 3 >0.8380. (a) p for trend = 0.0148. (b) p for trend < 0.0001.
Figure 3 
Prevalence of low bone mass according to tertiles of the preoperative IGF-1 index. With increment of the IGF-1 index level, prevalence of low bone mass decreased, both in the vertebra lumbalis and neck of femur. Tertiles 1: <0.5986, tertiles 2: 0.5986–0.8380, and tertiles 3 >0.8380. (a) p for trend = 0.0002. (b) p for trend = 0.0169. (c) p for trend < 0.0001.

In the logistic regression analysis of the related factors of low bone mass, most of the potentially relevant factors were put into this model; only the IGF-1 index was still significantly negatively associated with the prevalence of low bone mass after adjusting for covariables. The results indicated that compared to the patients in the lowest tertile of the IGF-1 index (<0.5563), those with the highest tertile of the IGF-1 index (≥0.7993) had a lower prevalence of low bone mass (95% CI 0.16 (0.06–0.41), ). After adjusting for age, gender, and BMI, the patients in the highest tertile of the IGF-1 index still conferred a lower prevalence of low bone mass (95% CI 0.15 (0.06–0.42), ). The association between the IGF-1 index and low bone mass still existed (95% CI 0.02 (0.001–0.5), ) even after adjusting for age, gender, CD duration, BMI, hypertension, dyslipidemia, diabetes, ALT, Scr, FT3, F24 pm, PTH, and osteocalcin (Table 3). In comparison to the reference population, the participants in the middle tertile of the IGF-1 index (0.5563–0.7993) had no different risk of low bone mass.

Table 3 
Association between the preoperative IGF-1 index and the risk of low bone mass.

4. Discussion

Our results revealed that low bone mass occurred in around half of young CD patients, affecting more males than females, and mostly in the lumbar spine. The CD patients in our study had a high prevalence (48.37%) of low bone mass at the baseline. This was in accordance with the findings of previous research, and the reported prevalence of osteoporosis due to excess endogenous cortisol ranges from 22% to 59% [1925]. In this study, CD patients’ lumbar vertebrae were more severely affected than the neck of the femur. It is reported that lumbar vertebrae, containing more trabecular bone than femur neck, were more vulnerable to endogenous cortisol [26].

Our results also indicated that men were more prone to low bone mass than women in CD, which was in accordance with several other studies [232728]; possibly, the deleterious effect of cortisol excess on BMD might overrule the protective effects of sex hormones, and men were more often hypogonadal compared with women in CD patients. In our study, patients with low bone mass had a significantly higher level of F24 pm. Both cortisol levels in the morning and at midnight, were negatively associated with the Z-score of BMD in the lumbar spine at diagnosis. But these results were not seen in the femoral neck at diagnosis. This further indicated that lumbar vertebrae were more vulnerable to endogenous cortisol. BMI was considered to be associated with bone mass [29]. In our study, higher BMI was associated with higher BMD at diagnosis in the femur neck but not in the lumbar vertebrae, consistent with other studies [30].

Interestingly, besides the above known related factors, we also found that a higher level of the IGF-1 index was strongly associated with a lower prevalence of low bone mass, both in the vertebra lumbalis and the neck of the femur, independently of age, gender, duration, BMI, hypertension, dyslipidemia, diabetes, level of ALT, creatinine, FT3, and F24 pm. The IGF-1 index was also positively associated with the BMD Z-score, both in the lumbar spine and the femoral neck. So far, there have been few studies concerning the association between IGF-1 and low bone mass in Cushing’s disease patients. As we know, GH [3132] and IGF-1 [33] have been demonstrated to increase both bone formation (e.g., collagen synthesis) and bone resorption. However, in CD patients, glucocorticoids resulted in decreased number and dysfunction of osteoblasts by inhibiting GH-IGF-1 axes [3435]. In vitro studies suggested that at high concentrations of glucocorticoids, a decreased release of GHRH had been reported [3638]; therefore, GH-IGF-1 axes were inhibited. IGF-1 possessed anabolic mitogenic actions in osteoblasts while reducing the anabolic actions of TGF-β [39]. The decrease in IGF-1 might be a risk factor for low bone mass in CD patients. In vitro studies had also indicated that the suppressive effects of glucocorticoids on osteoblast function can be partially reversed by GH or IGF treatment [8]. In recent years, some studies have also shown that patients with untreated Cushing’s disease may have elevated IGF-1, and mildly elevated IGF-1 in Cushing’s disease does not imply pathological growth hormone excess. Higher IGF-1 levels could predict better outcomes in CD [4041]. Possible mechanisms were not clear, which might involve changes in IGF binding proteins (IGFBPs), interference in IGFBP fragments, IGF-1 synthesis or clearance, and/or the effects of hyperinsulinism induced by excess glucocorticoids. In our study, the results also showed that IGF-1 was an independent protective factor for low bone mass in CD patients.

Our study was one of the few well-powered research studies on the association of IGF-1 levels with low bone mass in young CD patients. These represented important strengths of our study, especially given the rarity of CD. The main limitation of this study was its retrospective nature. This could not prove causality. A prospective study should be conducted to explore the causality between IGF-1 and osteoporosis in CD patients. In addition, this study lacked morphometric data for spinal fractures in all patients, which may underestimate the incidence of fractures and osteoporosis. However, our study indicated that a lower IGF-1 index level was significantly associated with low bone mass in young CD patients, which might provide a new aspect to understand the possible risk factors and mechanism of osteoporosis in CD patients.

In conclusion, our study found that a higher IGF-1 index was independently and significantly associated with decreased prevalence of low bone mass in young CD patients, drawing attention to the role of IGF-1 in the pathogenesis of CD-caused low bone mass and may support the exploration of this pathway in therapeutic agent development in antiosteoporosis in CD.

Data Availability

The data used to support the findings of the study are available on request from the authors.

Additional Points

Through a retrospective study of a large sample of Cushing’s disease (CD) patients from a single center, we found that a higher IGF-1 index was independently associated with a lower prevalence of low bone mass in young CD patients and IGF-1 might play an important role in the pathogenesis of CD-caused low bone mass.

Disclosure

Wanwan Sun and Quanya Sun were the co-first authors.

Conflicts of Interest

The authors declare that they have no conflicts of interest.

Authors’ Contributions

Wanwan Sun analyzed the data and wrote the manuscript. Quanya Sun collected the data. Hongying Ye and Shuo Zhang conducted the study design and quality control. All authors read and approved the final manuscript. Wanwan Sun and Quanya Sun contributed equally to this work.

Acknowledgments

The present study was supported by grants from the initial funding of the Huashan Hospital (2021QD023). The study was also supported by grants from Multidisciplinary Diagnosis and Treatment (MDT) demonstration project in research hospitals (Shanghai Medical College, Fudan University, no: DGF501053-2/014).

References

  1. H. Nishioka and S. Yamada, “Cushing’s disease,” Journal of Clinical Medicine, vol. 8, no. 11, p. 1951, 2019.

    View at: Publisher Site | Google Scholar

  2. H. Cushing, “The basophil adenomas of the pituitary body and their clinical manifestations (pituitary basophilism),” Obesity Research, vol. 2, no. 5, pp. 486–508, 1994.

    View at: Publisher Site | Google Scholar

  3. R. A. Feelders, S. J. Pulgar, A. Kempel, and A. M. Pereira, “Management of endocrine disease: the burden of Cushing’s disease: clinical and health-related quality of life aspects,” European Journal of Endocrinology, vol. 167, no. 3, pp. 311–326, 2012.

    View at: Publisher Site | Google Scholar

  4. R. Pivonello, M. De Leo, A. Cozzolino, and A. Colao, “The treatment of Cushing’s disease,” Endocrine Reviews, vol. 36, no. 4, pp. 385–486, 2015.

    View at: Publisher Site | Google Scholar

  5. R. Pivonello, M. C. De Martino, M. De Leo, C. Simeoli, and A. Colao, “Cushing’s disease: the burden of illness,” Endocrine, vol. 56, no. 1, pp. 10–18, 2017.

    View at: Publisher Site | Google Scholar

  6. R. S. Hardy, H. Zhou, M. J. Seibel, and M. S. Cooper, “Glucocorticoids and bone: consequences of endogenous and exogenous excess and replacement therapy,” Endocrine Reviews, vol. 39, no. 5, pp. 519–548, 2018.

    View at: Publisher Site | Google Scholar

  7. R. Bouillon and A. Prodonova, “Growth hormone deficiency and peak bone mass: laboratory for experimental medicine and Endocrinology, catholic university of leuven, gasthuisberg, leuven, Belgium,” Journal of Pediatric Endocrinology and Metabolism, vol. 13, no. s2, pp. 1327–1342, 2000.

    View at: Publisher Site | Google Scholar

  8. A. Giustina, G. Mazziotti, and E. Canalis, “Growth hormone, insulin-like growth factors, and the skeleton,” Endocrine Reviews, vol. 29, no. 5, pp. 535–559, 2008.

    View at: Publisher Site | Google Scholar

  9. T. Sugimoto, K. Nishiyama, F. Kuribayashi, and K. Chihara, “Serum levels of insulin-like growth factor (IGF) I, IGF-binding protein (IGFBP)-2, and IGFBP-3 in osteoporotic patients with and without spinal fractures,” Journal of Bone and Mineral Research, vol. 12, no. 8, pp. 1272–1279, 1997.

    View at: Publisher Site | Google Scholar

  10. P. Garnero, E. Sornay-Rendu, and P. D. Delmas, “Low serum IGF-1 and occurrence of osteoporotic fractures in postmenopausal women,” The Lancet, vol. 355, no. 9207, pp. 898-899, 2000.

    View at: Publisher Site | Google Scholar

  11. C. Ohlsson, D. Mellström, D. Carlzon et al., “Older men with low serum IGF-1 have an increased risk of incident fractures: the MrOS Sweden study,” Journal of Bone and Mineral Research, vol. 26, no. 4, pp. 865–872, 2011.

    View at: Publisher Site | Google Scholar

  12. M. Hotta, T. Shibasaki, A. Masuda et al., “Effect of human growth hormone-releasing hormone on GH secretion in Cushing’s syndrome and non-endocrine disease patients treated with glucocorticoids,” Life Sciences, vol. 42, no. 9, pp. 979–984, 1988.

    View at: Publisher Site | Google Scholar

  13. L. T. Braun and M. Reincke, “The effect of biochemical remission on bone metabolism in Cushing’s syndrome: a 2-year follow-up study,” Journal of Bone and Mineral Research, vol. 36, no. 11, pp. 2281-2282, 2021.

    View at: Publisher Site | Google Scholar

  14. I. Kanazawa, T. Yamaguchi, M. Yamamoto, M. Yamauchi, S. Yano, and T. Sugimoto, “Serum insulin-like growth factor-I level is associated with the presence of vertebral fractures in postmenopausal women with type 2 diabetes mellitus,” Osteoporosis International, vol. 18, no. 12, pp. 1675–1681, 2007.

    View at: Publisher Site | Google Scholar

  15. A. Scillitani, G. Mazziotti, C. Di Somma et al., “Treatment of skeletal impairment in patients with endogenous hypercortisolism: when and how?” Osteoporosis International, vol. 25, no. 2, pp. 441–446, 2014.

    View at: Publisher Site | Google Scholar

  16. M. Fleseriu, R. Auchus, I. Bancos et al., “Consensus on diagnosis and management of Cushing’s disease: a guideline update,” Lancet Diabetes and Endocrinology, vol. 9, no. 12, pp. 847–875, 2021.

    View at: Publisher Site | Google Scholar

  17. J. M. Liu, D. L. Zhu, Y. M. Mu, and W. B. Xia, “Chinese Society of Osteoporosis and Bone Mineral Research, the Chinese Society of Endocrinology, Chinese Diabetes Society, Chinese Medical Association; Chinese Endocrinologist Association, Chinese Medical Doctor Association,” Management of fracture risk in patients with diabetes-Chinese Expert Consensus Journal of Diabetes, vol. 11, pp. 906–919, 2019.

    View at: Google Scholar

  18. P. M. Camacho, S. M. Petak, N. Binkley et al., “American association of clinical endocrinologists and American college of endocrinology clinical practice guidelines for the diagnosis and treatment of postmenopausal OSTEOPOROSIS-2020 update,” Endocrine Practice, vol. 26, no. 1, pp. 1–46, 2020.

    View at: Publisher Site | Google Scholar

  19. C. V. dos Santos, L. Vieira Neto, M. Madeira et al., “Bone density and microarchitecture in endogenous hypercortisolism,” Clinical Endocrinology, vol. 83, no. 4, pp. 468–474, 2015.

    View at: Publisher Site | Google Scholar

  20. N. Ohmori, K. Nomura, K. Ohmori, Y. Kato, T. Itoh, and K. Takano, “Osteoporosis is more prevalent in adrenal than in pituitary Cushing’s syndrome,” Endocrine Journal, vol. 50, no. 1, pp. 1–7, 2003.

    View at: Publisher Site | Google Scholar

  21. M. E. Randazzo, E. Grossrubatscher, P. Dalino Ciaramella, A. Vanzulli, and P. Loli, “Spontaneous recovery of bone mass after cure of endogenous hypercortisolism,” Pituitary, vol. 15, no. 2, pp. 193–201, 2012.

    View at: Publisher Site | Google Scholar

  22. L. Tauchmanovà, R. Pivonello, C. Di Somma et al., “Bone demineralization and vertebral fractures in endogenous cortisol excess: role of disease etiology and gonadal status,” Journal of Clinical Endocrinology and Metabolism, vol. 91, no. 5, pp. 1779–1784, 2006.

    View at: Publisher Site | Google Scholar

  23. E. Valassi, A. Santos, M. Yaneva et al., “The European Registry on Cushing’s syndrome: 2-year experience. Baseline demographic and clinical characteristics,” European Journal of Endocrinology, vol. 165, no. 3, pp. 383–392, 2011.

    View at: Publisher Site | Google Scholar

  24. L. Trementino, G. Appolloni, L. Ceccoli et al., “Bone complications in patients with Cushing’s syndrome: looking for clinical, biochemical, and genetic determinants,” Osteoporosis International, vol. 25, no. 3, pp. 913–921, 2014.

    View at: Publisher Site | Google Scholar

  25. A. W. van der Eerden, M. den Heijer, W. J. Oyen, and A. R. Hermus, “Cushing’s syndrome and bone mineral density: lowest Z scores in young patients,” The Netherlands Journal of Medicine, vol. 65, no. 4, pp. 137–141, 2007.

    View at: Google Scholar

  26. P. G. Lacativa and M. L. F. Farias, “Office practice of osteoporosis evaluation,” Arquivos Brasileiros de Endocrinologia and Metabologia, vol. 50, no. 4, pp. 674–684, 2006.

    View at: Publisher Site | Google Scholar

  27. L. H. A. Broersen, F. M. van Haalen, T. Kienitz et al., “Sex differences in presentation but not in outcome for ACTH-dependent Cushing’s syndrome,” Frontiers in Endocrinology, vol. 10, p. 580, 2019.

    View at: Publisher Site | Google Scholar

  28. F. P. Giraldi, M. Moro, and F. Cavagnini, “Gender-related differences in the presentation and course of Cushing’s disease,” Journal of Clinical Endocrinology and Metabolism, vol. 88, no. 4, pp. 1554–1558, 2003.

    View at: Publisher Site | Google Scholar

  29. S. Morin, J. F. Tsang, and W. D. Leslie, “Weight and body mass index predict bone mineral density and fractures in women aged 40 to 59 years,” Osteoporosis International, vol. 20, no. 3, pp. 363–370, 2009.

    View at: Publisher Site | Google Scholar

  30. M. Zilio, M. Barbot, F. Ceccato et al., “Diagnosis and complications of Cushing’s disease: gender-related differences,” Clinical Endocrinology, vol. 80, no. 3, pp. 403–410, 2014.

    View at: Publisher Site | Google Scholar

  31. G. Amato, C. Carella, S. Fazio, G. La Montagna, A. Cittadini, and D. Sabatini, “Body composition, bone metabolism, and heart structure and function in growth hormone (GH)-deficient adults before and after GH replacement therapy at low doses,” Journal of Clinical Endocrinology and Metabolism, vol. 77, no. 6, pp. 1671–1676, 1993.

    View at: Publisher Site | Google Scholar

  32. S. A. Beshyah, E. Thomas, P. Kyd, P. Sharp, A. Fairney, and D. G. Johnston, “The effect of growth hormone replacement therapy in hypopituitary adults on calcium and bone metabolism,” Clinical Endocrinology, vol. 40, no. 3, pp. 383–391, 2010.

    View at: Publisher Site | Google Scholar

  33. P. R. Ebeling, J. D. Jones, W. M. O’Fallon, C. H. Janes, and B. L. Riggs, “Short-term effects of recombinant human insulin-like growth factor I on bone turnover in normal women,” Journal of Clinical Endocrinology and Metabolism, vol. 77, no. 5, pp. 1384–1387, 1993.

    View at: Publisher Site | Google Scholar

  34. G. Mazziotti and A. Giustina, “Glucocorticoids and the regulation of growth hormone secretion,” Nature Reviews Endocrinology, vol. 9, no. 5, pp. 265–276, 2013.

    View at: Publisher Site | Google Scholar

  35. N. A. Tritos, “Growth hormone deficiency in adults with Cushing’s disease,” Best Practice and Research Clinical Endocrinology and Metabolism, vol. 35, no. 2, Article ID 101474, 2021.

    View at: Publisher Site | Google Scholar

  36. K. Nakagawa, T. Ishizuka, T. Obara, M. Matsubara, and K. Akikawa, “Dichotomic action of glucocorticoids on growth hormone secretion,” Acta Endocrinologica, vol. 116, no. 2, pp. 165–171, 1987.

    View at: Publisher Site | Google Scholar

  37. G. Fernández-Vázquez, L. Cacicedo, M. J. Lorenzo, R. Tolón, J. López, and F. Sánchez-Franco, “Corticosterone modulates growth hormone-releasing factor and somatostatin in fetal rat hypothalamic cultures,” Neuroendocrinology, vol. 61, no. 1, pp. 31–35, 1995.

    View at: Publisher Site | Google Scholar

  38. S. K. Fife, R. S. Brogan, A. Giustina, and W. B. Wehrenberg, “Immunocytochemical and molecular analysis of the effects of glucocorticoid treatment on the hypothalamic-somatotropic axis in the rat,” Neuroendocrinology, vol. 64, no. 2, pp. 131–138, 1996.

    View at: Publisher Site | Google Scholar

  39. T. L. McCarthy, M. Centrella, and E. Canalis, “Cortisol inhibits the synthesis of insulin-like growth factor-I in skeletal cells,” Endocrinology, vol. 126, no. 3, pp. 1569–1575, 1990.

    View at: Publisher Site | Google Scholar

  40. K. English, V. Chikani, G. Dimeski, and W. J. Inder, “Elevated insulin‐like growth factor‐1 in Cushing’s disease,” Clinical Endocrinology, vol. 91, no. 1, pp. 141–147, 2019.

    View at: Publisher Site | Google Scholar

  41. E. Gezer, B. Çetinarslan, A. Selek et al., “The association between insulin-like growth factor 1 levels within reference range and early postoperative remission rate in patients with Cushing’s disease,” Endocrine Research, vol. 46, no. 3, pp. 92–98, 2021.

    View at: Publisher Site | Google Scholar

Copyright © 2023 Wanwan Sun et al. This is an open access article distributed under the Creative Commons Attribution License, which permits unrestricted use, distribution, and reproduction in any medium, provided the original work is properly cited.