COVID-19 May Be Severe in Cushing’s Patients

A young healthcare worker who contracted COVID-19 shortly after being diagnosed with Cushing’s disease was detailed in a case report from Japan.

While the woman was successfully treated for both conditions, Cushing’s may worsen a COVID-19 infection. Prompt treatment and multidisciplinary care is required for Cushing’s patients who get COVID-19, its researchers said.

The report, “Successful management of a patient with active Cushing’s disease complicated with coronavirus disease 2019 (COVID-19) pneumonia,” was published in Endocrine Journal.

Cushing’s disease is caused by a tumor on the pituitary gland, which results in abnormally high levels of the stress hormone cortisol (hypercortisolism). Since COVID-19 is still a fairly new disease, and Cushing’s is rare, there is scant data on how COVID-19 tends to affect Cushing’s patients.

In the report, researchers described the case of a 27-year-old Japanese female healthcare worker with active Cushing’s disease who contracted COVID-19.

The patient had a six-year-long history of amenorrhea (missed periods) and dyslipidemia (abnormal fat levels in the body). She had also experienced weight gain, a rounding face, and acne.

After transferring to a new workplace, the woman visited a new gynecologist, who checked her hormonal status. Abnormal findings prompted a visit to the endocrinology department.

Clinical examination revealed features indicative of Cushing’s syndrome, such as a round face with acne, central obesity, and buffalo hump. Laboratory testing confirmed hypercortisolism, and MRI revealed a tumor in the patient’s pituitary gland.

She was scheduled for surgery to remove the tumor, and treated with metyrapone, a medication that can decrease cortisol production in the body. Shortly thereafter, she had close contact with a patient she was helping to care for, who was infected with COVID-19 but not yet diagnosed.

A few days later, the woman experienced a fever, nausea, and headache. These persisted for a few days, and then she started having difficulty breathing. Imaging of her lungs revealed a fluid buildup (pneumonia), and a test for SARS-CoV-2 — the virus that causes COVID-19 — came back positive.

A week after symptoms developed, the patient required supplemental oxygen. Her condition worsened 10 days later, and laboratory tests were indicative of increased inflammation.

To control the patient’s Cushing’s disease, she was treated with increasing doses of metyrapone and similar medications to decrease cortisol production; she was also administered cortisol — this “block and replace” approach aims to maintain cortisol levels within the normal range.

The patient experienced metyrapone side effects that included stomach upset, nausea, dizziness, swelling, increased acne, and hypokalemia (low potassium levels).

She was given antiviral therapies (e.g., favipiravir) to help manage the COVID-19. Additional medications to prevent opportunistic fungal infections were also administered.

From the next day onward, her symptoms eased, and the woman was eventually discharged from the hospital. A month after being discharged, she tested negative for SARS-CoV-2.

Surgery for the pituitary tumor was then again possible. Appropriate safeguards were put in place to protect the medical team caring for her from infection, during and after the surgery.

The patient didn’t have any noteworthy complications from the surgery, and her cortisol levels soon dropped to within normal limits. She was considered to be in remission.

Although broad conclusions cannot be reliably drawn from a single case, the researchers suggested that the patient’s underlying Cushing’s disease may have made her more susceptible to severe pneumonia due to COVID-19.

“Since hypercortisolism due to active Cushing’s disease may enhance the severity of COVID-19 infection, it is necessary to provide appropriate, multidisciplinary and prompt treatment,” the researchers wrote.

From https://cushingsdiseasenews.com/2021/01/15/covid-19-may-be-severe-cushings-patients-case-report-suggests/?cn-reloaded=1

Think Like a Doctor: Red Herrings Solved!

By LISA SANDERS, M.D.

On Thursday we challenged Well readers to take the case of a 29-year-old woman with an injured groin, a swollen foot and other abnormalities. Many of you found it as challenging as the doctors who saw her. I asked for the right test as well as the right diagnosis. More than 200 answers were posted.

The right test was…

The dexamethasone suppression test,though I counted those of you who suggested measuring the cortisol in the urine.

The right diagnosis was…

Cushing’s disease

More than a dozen of you got the right answer or the right test, but Dr. Davin Quinn, a consultant psychiatrist at the University of New Mexico Hospital, was the first to be right on both counts. As soon as he saw that the patient’s cortisol level was increased, he thought of Cushing’s. And he had treated a young patient like this one some years ago as a second year resident.

The Diagnosis:

Cushing’s disease is caused by having too much of the stress hormone cortisol in the body. Cortisol is made in the adrenal glands, little pyramid shaped organs that sit atop the kidneys. It is normally a very tightly regulated hormone that helps the body respond to physical stress.

Sometimes the excess comes from a tumor in the adrenal gland itself that causes the little organ to go into overdrive, making too much cortisol. More often the excess occurs when a tumor in the pituitary gland in the brain results in too much ACTH, the hormone that controls the adrenal gland.

In the body, cortisol’s most fundamental job is to make sure we have enough glucose around to get the body’s work done. To that end, the hormone drives appetite, so that enough fuel is taken in through the food we eat. When needed, it can break muscle down into glucose. This essential function accounts for the most common symptoms of cortisol excess: hyperglycemia, weight gain and muscle wasting. However, cortisol has many functions in the body, and so an excess of the hormone can manifest itself in many different ways.

Cushing’s was first described by Dr. Harvey Cushing, a surgeon often considered the father of modern neurosurgery. In a case report in 1912, he described a 23-year-old woman with sudden weight gain, mostly in the abdomen; stretch marks from skin too thin and delicate to accommodate the excess girth; easy bruising; high blood pressure and diabetes.

Dr. Cushing’s case was, it turns out, a classic presentation of the illness. It wasn’t until 20 years later that he recognized that the disease had two forms. When it is a primary problem of an adrenal gland gone wild and producing too much cortisol on its own, the disease is known as Cushing’s syndrome. When the problem results from an overgrown part of the pituitary making too much ACTH and causing the completely normal adrenal glands to overproduce the hormone, the illness is called Cushing’s disease.

It was an important distinction, since the treatment often requires a surgical resection of the body part where the problem originates. Cushing’s syndrome can also be caused by steroid-containing medications, which are frequently used to treat certain pulmonary and autoimmune diseases.

How the Diagnosis Was Made:

After the young woman got her lab results from Dr. Becky Miller, the hematologist she had been referred to after seeing several other specialists, the patient started reading up on the abnormalities that had been found. And based on what she found on the Internet, she had an idea of what was going on with her body.

“I think I have Cushing’s disease,” the patient told her endocrinologist when she saw him again a few weeks later.

The patient laid out her argument. In Cushing’s, the body puts out too much cortisol, one of the fight-or-flight stress hormones. That would explain her high blood pressure. Just about everyone with Cushing’s disease has high blood pressure.

She had other symptoms of Cushing’s, too. She bruised easily. And she’d been waking up crazy early in the morning for the past year or so – around 4:30 – and couldn’t get back to sleep. She’d heard that too much cortisol could cause that as well. She was losing muscle mass – she used to have well-defined muscles in her thighs and calves. Not any more. Her belly – it wasn’t huge, but it was a lot bigger than it had been. Cushing’s seemed the obvious diagnosis.

The doctor was skeptical. He had seen Cushing’s before, and this patient didn’t match the typical pattern. She was the right age for Cushing’s and she had high blood pressure, but nothing else seemed to fit. She wasn’t obese. Indeed, she was tall (5- foot-10) and slim (150 pounds) and athletic looking. She didn’t have stretch marks; she didn’t have diabetes. She said she bruised easily, but the endocrinologist saw no bruises on exam. Her ankle was still swollen, and Cushing’s can do that, but so can lots of other diseases.

The blood tests that Dr. Miller ordered measuring the patient’s ACTH and cortisol levels were suggestive of the disease, but many common problems — depression, alcohol use, eating disorders — can cause the same result. Still, it was worth taking the next step: a dexamethasone suppression test.

Testing, Then Treatment:

The dexamethasone suppression test depends on a natural negative feedback loop whereby high levels of cortisol suppress further secretion of the hormone. Dexamethasone is an artificial form of cortisol. Given in high doses, it will cause the level of naturally-occurring cortisol to drop dramatically.

The patient was told to take the dexamethasone pills the night before having her blood tested. The doctor called her the next day.

“Are you sure you took the pills I gave you last night?” the endocrinologist asked her over the phone. The doctor’s voice sounded a little sharp to the young woman, tinged with a hint of accusation.

“Of course I took them,” she responded, trying to keep her voice clear of any irritation.

“Well, the results are crazy,” he told her and proposed she take another test: a 24-hour urine test.

Because cortisol is eliminated through the kidneys, collecting a full day’s urine would show how much cortisol her body was making. So the patient carefully collected a day’s worth of urine.

A few days later, the endocrinologist called again: her cortisol level was shockingly high. She was right, the doctor conceded, she really did have Cushing’s.

An M.R.I. scan revealed a tiny tumor on her pituitary. A couple of months later, she had surgery to remove the affected part of the gland.

After recovering from the surgery, the patient’s blood pressure returned to normal, as did her red blood cell count and her persistently swollen ankle. And she was able to once again sleep through the night.

Red Herrings Everywhere:

As many readers noted, there were lots of findings that didn’t really add up in this case. Was this woman’s groin sprain part of the Cushing’s? What about the lower extremity swelling, and the excess red blood cell count?

In the medical literature, there is a single case report of high red blood cell counts as the presenting symptom in a patient with Cushing’s. And with this patient, the problem resolved after her surgery – so maybe they were linked.

And what about the weird bone marrow biopsy? The gastritis? The enlarged spleen? It’s hard to say for certain if any of these problems was a result of the excess cortisol or if she just happened to have other medical problems.

Why the patient didn’t have the typical symptoms of Cushing’s is easier to explain. She was very early in the course of the disease when she got her diagnosis. Most patients are diagnosed once symptoms have become more prominent

By the time this patient had her surgery, a couple of months later, the round face and belly characteristic of cortisol excess were present. Now, two years after her surgery, none of the symptoms remain.

From http://well.blogs.nytimes.com/2014/01/17/think-like-a-doctor-red-herrings-solved/?_php=true&_type=blogs&_r=0

Pituitary adenoma growth rate influenced by multiple factors

Monsalves E. J. Clin Endocrinol Metab. 2013; doi: 10. 1210/jc.2013-3054.

The etiology of pituitary adenoma growth rate is multifactorial and may be influenced by patient age and gender, as well as adenoma subtype, hormonal activity, immunohistological profile and the direction of growth relative to the pituitary fossa, according to results of a retrospective study.

Researchers evaluated pre- and postoperative pituitary adenoma (PA) traits in relation to patient demographics, MRI specifications and histopathological factors. They examined 153 patients who underwent surgery for removal of a histologically-proven PA at Toronto Western Hospital between 1999 and 2011.

All patients had at least two preoperative and two postoperative MRIs to measure tumor volume doubling time. Both scans were completed a minimum of 3 months apart.

Patients all underwent a sella/pituitary imaging protocol, and volume was determined using partitioning and target volume software. Each patient was also reviewed by two endocrine pathologists, and standardized diagnostic synoptic pathology reports provided information on MIB-1 labeling index, p27 and N-terminally truncated fibroblast growth factor receptor 4 (FGFR4). Growth direction patterns were classified as superior, anterior, posterior and lateral in relation to the sellar fossa.

The researchers found a relationship between preoperative growth rate and age (P=.0001), as well as suprasellar growth (P=.003), existence of a cyst or hemorrhage (P= .004), the MIB-1 (P=.005), FGFR4 positivity (P=.047) and p27 negativity (P=.007).

Postoperatively, 34.6% of patients demonstrated residual volumes, while the remaining 100 patients did not. Residual volume was found to be associated with older patient age (57 vs. 51, P=.038), as well as growth patterns, including anterior, posterior, suprasellar and cavernous sinus extension (P=.001). There was a correlation between pre-and postoperative growth rates (r=0.497, P=.026). The rates of postoperative growth were linked with age (P=.015) and gender (P= .017).

“Due to the heterogeneity of PA, no single predictor of PA growth behavior can be taken in isolation as a means to predict its outcome,” the researchers wrote.  “These predictors must be combined in order to formulate the most accurate estimation of PA growth, which in turn will inform sound clinical management.”

Disclosures: The researchers report no relevant financial disclosures.

From http://www.healio.com/endocrinology/neuroendocrinology/news/online/%7B7cb2ec5d-eaa6-42a3-b279-2c2436d0fbd0%7D/pituitary-adenoma-growth-rate-influenced-by-multiple-factors

Enhanced Radiological Detection of a Corticotroph Adenoma Following Treatment With Osilodrostat

Abstract

In approximately 30% of patients with Cushing disease, pituitary magnetic resonance imaging (MRI) does not reliably identify a corticotroph adenoma. Importantly, surgical remission rates are >2.5 fold higher for microadenomas that are radiologically visible on preoperative imaging when compared with “MRI-negative” cases. We describe a 42-year-old woman with Cushing disease, in whom MRI findings at presentation were equivocal with no clear adenoma visualized. She was initially treated with metyrapone, which resulted in partial biochemical control of hypercortisolism. After switching to osilodrostat, there was a marked improvement in her symptoms and rapid normalization of cortisol levels. Following 3 months of eucortisolemia, [11C]methionine positron emission tomography (MET-PET) coregistered with volumetric MRI (MET-PET/MRCR) localized the site of the corticotroph tumor and the patient underwent successful transsphenoidal resection. She remains in full clinical and biochemical remission at >2 years postsurgery. This case suggests that a period of eucortisolemia induced by osilodrostat may facilitate localization of corticotroph microadenomas using functional (PET) imaging.

Introduction

Cushing disease, caused by an ACTH-secreting pituitary adenoma, accounts for approximately 80% of endogenous Cushing syndrome [1]. Although transsphenoidal surgery remains the preferred treatment for the majority of patients, even in expert centers recurrence rates as high as 27% have been reported [23]. Surgery is preferred over medical therapy because it offers the potential for definitive cure by directly removing the pituitary adenoma. In contrast, medical therapy is typically reserved for patients in whom surgery is contraindicated, incomplete, or has failed to achieve remission. Linked to this, magnetic resonance imaging (MRI) fails to detect an adenoma in approximately one third of cases [4]. In a recent systematic review, postsurgical remission rates were 2.63-fold higher (95% CI, 2.06-3.35) for MRI-detected corticotroph adenomas when compared with “MRI-negative” cases [5]. Several alternative magnetic resonance sequences have therefore been proposed to aid tumor localization (including dynamic and volumetric [eg, gradient recalled echo MRI]), but these still fail to detect a significant proportion of microcorticotropinomas [67]. Accordingly, molecular (functional) imaging with positron emission tomography (PET) radiotracers that target key properties of corticotroph adenomas (eg, [11C]methionine [MET-PET], [18F]fluoroethyltyrosine, or [68Ga]DOTA-corticotropin-releasing hormone PET) has been proposed as an additional tool for localizing corticotroph tumors that evade detection on conventional MRI [6-10].

Medical therapy is often required for patients in whom surgery is not an immediate option or when there is persistent hypercortisolism postoperatively [11]. Cortisol-lowering treatment may also be considered before surgery to reduce morbidity and perioperative complications [11]. An important recent addition to the armory of medications used to treat Cushing syndrome is osilodrostat, a potent oral inhibitor of the key adrenal steroidogenic enzyme 11β-hydroxylase [1213].

Here, we describe how preoperative medical therapy with osilodrostat yielded dual benefits in a patient with inconclusive primary imaging: (1) rapid and effective control of hypercortisolism and (2) facilitation of the localization of a previously occult microcorticotroph adenoma using MET-PET coregistered with volumetric MRI (MET-PET/MRCR).

Case Presentation

A 42-year-old woman presented with a 7-year history of progressive central weight gain, facial plethora, acne, worsening hypertension, depression, and proximal myopathy. Her symptoms had become more pronounced during the COVID-19 pandemic, leading to profound emotional distress and functional decline. She described feeling persistently tearful and fatigued, with markedly reduced energy levels that rendered her unable to work or care for her young child, and severely affecting her quality of life. She had no significant medical history and was taking amlodipine and the progesterone-only pill. On examination, her body mass index was 29.6 kg/m² and blood pressure was markedly elevated at 197/111 mm Hg. Clinical features consistent with hypercortisolism included easy bruising, centripetal adiposity, and proximal muscle wasting. Initial laboratory evaluation was unremarkable; however, her hemoglobin A1c was at the upper end of normal (41 mmol/mol or 5.9%).

Diagnostic Assessment

Biochemical testing confirmed ACTH-dependent Cushing syndrome (Table 1). Cortisol levels following overnight and 48-hour dexamethasone suppression were elevated at 8 µg/dL (SI: 219 nmol/L) and 16 µg/dL (SI: 434 nmol/L), respectively (reference range: < 1.8 µg/dL [SI: < 50 nmol/L]). Plasma ACTH concentrations ranged from 36 to 55 ng/L (SI: 7.9-12.1 pmol/L) (reference range: 10-30 ng/L [SI: 2.2-6.6 pmol/L]), consistent with an ACTH-driven process. Urinary free cortisol (UFC) was markedly elevated at 690.95 µg/24 hours (SI: 1907 nmol/24 hours) (reference range: 18-98 µg/24 hours [SI: 50-270 nmol/24 hours]). Late-night salivary cortisol and cortisone levels were also elevated at 0.95 µg/dL (SI: 26.2 nmol/L) (reference range: < 0.09 µg/dL [SI: < 2.6 nmol/L]) and 2.7 µg/dL (SI: 74.5 nmol/L) (reference range: < 0.7 µg/dL [SI: < 18 nmol/L]) respectively. Inferior petrosal sinus sampling excluded an ectopic source of ACTH production (central-to-peripheral ACTH ratio: baseline 18.60, 0 minutes 18.4, peak at 2 minutes 94.9, 5 minutes 42.4, 10 minutes 22.3) (Table 2). However, pituitary MRI findings were inconclusive, with no definite adenoma identified. In addition, the left intracavernous carotid artery encroached medially, creating a narrow intercarotid window with distortion of normal pituitary anatomy (Fig. 1). Given these findings, the decision was made to initiate cortisol-lowering therapy and to reassess imaging appearances after a period of biochemical normalization.
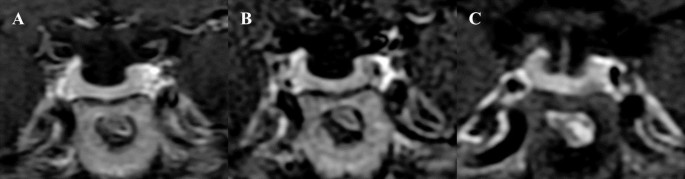
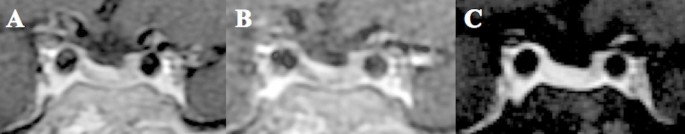
Pituitary MRI at initial presentation. No discrete adenoma is visible on T1-weighted coronal precontrast (A) and postcontrast (B), T2-weighted coronal (C), and T1-weighted sagittal postcontrast (D) sequences. The sellar anatomy appears asymmetric, consistent with a medially positioned left internal carotid artery.

Figure 1.

Pituitary MRI at initial presentation. No discrete adenoma is visible on T1-weighted coronal precontrast (A) and postcontrast (B), T2-weighted coronal (C), and T1-weighted sagittal postcontrast (D) sequences. The sellar anatomy appears asymmetric, consistent with a medially positioned left internal carotid artery.

Table 1.

Biochemical investigations at diagnosis confirming ACTH-dependent Cushing syndrome

Tests Results Reference Range
Overnight dexamethasone suppression test (ONDST) Cortisol: 8 µg/dL (SI: 219 nmol/L) <1.8 µg/dL (SI: < 50 nmol/L)
48-hour dexamethasone suppression test (DST) Cortisol: 16 µg/dL (SI: 434 nmol/L) <1.8 µg/dL (SI: < 50 nmol/L)
ACTH 36-55 ng/L (SI: 7.9-12.1 pmol/L) 10-30 ng/L (SI: 2.2-6.6 pmol/L)
24-hour urinary free cortisol (UFC) 690.95 μg/24 h (SI: 1907 nmol/24 h) 18-98 µg/24 h (SI: 50-270 nmol/24 hours)
Late-night salivary cortisol
late-night salivary cortisone
0.95 µg/dL (SI: 26.2 nmol/L)
2.7 µg/dL (SI: 74.5 nmol/L)
<0.09 µg/dL (SI: <2.6 nmol/L) <0.7 µg/dL (SI: <18 nmol/L)

Results are reported in both conventional and SI units with reference ranges shown in parentheses.

Table 2.

Results of inferior petrosal sinus sampling (IPSS)

Time Plasma ACTH
(min) Left petrosal sinus Right petrosal sinus Peripheral vein
−5 1159 ng/L (255 pmol/L) 144 ng/L (32 pmol/L) 62.3 ng/L (14 pmol/L)
0 1147 ng/L (253 pmol/L) 222 ng/L (49 pmol/L) 62.3 ng/L (14 pmol/L)
2 5257 ng/L (1157 pmol/L) 2159 ng/L (475 pmol/L) 55.4 ng/L (12.2 pmol/L)
5 3677 ng/L (810 pmol/L) 2976 ng/L (655 pmol/L) 86.8 ng/L (19 pmol/L)
10 2251 ng/L (496 pmol/L) 545 ng/L (120 pmol/L) 101 ng/L (22 pmol/L)

Time Plasma cortisol
(min) Left petrosal sinus Right petrosal sinus Peripheral vein
−5 24.94 μg/dL (668 nmol/L) 25.30 μg/dL (698 nmol/L) 23.56 μg/dL (650 nmol/L)
0 25.08 μg/dL (692 nmol/L) 24.07 μg/dL (664 nmol/L) 23.34 μg/dL (644 nmol/L)
2 23.31 μg/dL (643 nmol/L) 24.32 μg/dL (671 nmol/L) 23.78 μg/dL (656 nmol/L)
5 21.97 μg/dL (606 nmol/L) 23.67 μg/dL (653 nmol/L) 23.23 μg/dL (641 nmol/L)
10 27.62 μg/dL (762 nmol/L) 26.17 μg/dL (722 nmol/L) 25.26 μg/dL (697 nmol/L)

Time Plasma prolactin
(min) Left petrosal sinus Right petrosal sinus Peripheral vein
−5 1835 mU/L (86 μg/L) 356 mU/L (17 μg/L) 251 mU/L (11 μg/L)
0 1725 mU/L (81 μg/L) 498 mU/L (23 μg/L) 248 mU/L (12 μg/L)
2 2151 mU/L (101 μg/L) 409 mU/L (19 μg/L) 240 mU/L (11 μg/L)
5 2239 mU/L (105 μg/L) 711 mU/L (33 μg/L) 246 mU/L (12 μg/L)
10 1883 mU/L (89 μg/L) 410 mU/L (19 μg/L) 244 mU/L (11 μg/L)

Central-to-peripheral ACTH gradients before and after corticotropin-releasing hormone (CRH) stimulation support a pituitary source of ACTH secretion. Reference cutoffs: basal ACTH gradient ≥2 and/or CRH-stimulated ACTH gradient ≥3 indicate central ACTH secretion.

Treatment

The patient was started on metyrapone, but despite dose escalation up to 4000 mg daily, which was associated with significant nausea and malaise, she did not achieve eucortisolemia (Fig. 2C). She was therefore transitioned to osilodrostat, which rapidly normalized cortisol levels within 5 weeks at a maintenance dose of 6 mg twice daily (Fig. 2B and 2C). In contrast to metyrapone, osilodrostat was well-tolerated with no reported side effects. Serum cortisol and clinical status were closely monitored throughout, with no biochemical or clinical evidence of adrenal insufficiency.

Bar charts illustrating changes in urinary, salivary, and serum cortisol, as well as serum ACTH, during medical treatment. (A) A 24-hour UFC (black bars, left y-axis) normalized during osilodrostat treatment, whereas serum ACTH (gray bars, right y-axis) increased. Dotted lines represent the upper limit of normal: 59.4 µg/24 hours (SI: 164 nmol/24 hours) for UFC and 30 ng/L (SI: 6.6 pmol/L) for ACTH. X-axis labels indicate treatment week and total daily osilodrostat dose. (B) Salivary free cortisol levels, collected alongside serum cortisol during a cortisol day curve (at 09:00, 12:00, 15:00, and 18:00), fully normalized with osilodrostat therapy. Bar shading from black to light gray denotes sampling time. The dotted line indicates upper limit of normal: 9.4 ng/dL (SI: 2.6 nmol/L). (C) Serum free cortisol levels during day curves showed inadequate control on escalating doses of metyrapone, with normalization achieved following initiation of osilodrostat.

Figure 2.

Bar charts illustrating changes in urinary, salivary, and serum cortisol, as well as serum ACTH, during medical treatment. (A) A 24-hour UFC (black bars, left y-axis) normalized during osilodrostat treatment, whereas serum ACTH (gray bars, right y-axis) increased. Dotted lines represent the upper limit of normal: 59.4 µg/24 hours (SI: 164 nmol/24 hours) for UFC and 30 ng/L (SI: 6.6 pmol/L) for ACTH. X-axis labels indicate treatment week and total daily osilodrostat dose. (B) Salivary free cortisol levels, collected alongside serum cortisol during a cortisol day curve (at 09:00, 12:00, 15:00, and 18:00), fully normalized with osilodrostat therapy. Bar shading from black to light gray denotes sampling time. The dotted line indicates upper limit of normal: 9.4 ng/dL (SI: 2.6 nmol/L). (C) Serum free cortisol levels during day curves showed inadequate control on escalating doses of metyrapone, with normalization achieved following initiation of osilodrostat.

ACTH levels progressively increased as the dose of osilodrostat was escalated (Fig. 2A). After 3 months of biochemical eucortisolism, she underwent Met-PET/MRCR, which revealed a distinct methionine-avid lesion in the right posterolateral aspect of the sella (Fig. 3). Imaging was performed as previously reported [7814]. Conventional MRI findings remained stable, with no new abnormalities. As she remained clinically and biochemically eucortisolemic on osilodrostat, glucocorticoid supplementation was not required pre- or perioperatively.

11C-Methionine PET/CT coregistered with volumetric MRI (MET-PET/MRCR) following treatment with osilodrostat. A subtle area of reduced gadolinium enhancement can now be appreciated on the right posterosuperior aspect of the gland (A-C). MET-PET/MRCR confirms focal tracer uptake at this site (yellow arrows) and also within normal gland anteriorly (white arrow) (D-F). Three-dimensional reconstruction using CT, MRI, and PET datasets demonstrating the location of the corticotroph microadenoma which was confirmed at subsequent surgery (G-H).

Figure 3.

11C-Methionine PET/CT coregistered with volumetric MRI (MET-PET/MRCR) following treatment with osilodrostat. A subtle area of reduced gadolinium enhancement can now be appreciated on the right posterosuperior aspect of the gland (A-C). MET-PET/MRCR confirms focal tracer uptake at this site (yellow arrows) and also within normal gland anteriorly (white arrow) (D-F). Three-dimensional reconstruction using CT, MRI, and PET datasets demonstrating the location of the corticotroph microadenoma which was confirmed at subsequent surgery (G-H).

Outcome and Follow-up

At transsphenoidal surgery, abnormal tissue was resected from the site identified on MET-PET/MRCR. Histological examination revealed normal anterior pituitary tissue (adenohypophysis) with no evidence of a pituitary adenoma. Occasional cells showed possible Crooke’s hyaline change. The Ki-67 proliferation index was very low (<1%). Despite the absence of histological confirmation of a corticotroph adenoma, the patient entered complete biochemical and clinical remission. Early postoperative cortisol was 3 µg/dL (SI: 82.8 nmol/L), prompting initiation of glucocorticoid replacement with prednisolone. Prednisolone was chosen for its longer half-life, enabling convenient once-daily dosing. We routinely monitor prednisolone levels to guide adjustment of replacement dosing. Prednisolone was successfully tapered over a period of 6 months, with biochemical confirmation of adrenal recovery. At 2 years postsurgery, the patient had no clinical features of hypercortisolism with sustained weight loss of >20 kg. Morning 09:00 cortisol and ACTH were consistent with ongoing eucortisolism. Serial late-night salivary cortisol and cortisone levels were normal, and cortisol was undetectable following a 1-mg overnight dexamethasone suppression test, confirming durable remission of Cushing disease.

Discussion

Early transsphenoidal surgery remains the treatment of choice for most patients with Cushing disease, with the highest chance of cure achieved following a successful first operation [11]. However, even in expert centers, persistent or recurrent disease is diagnosed during follow-up, and is more likely when initial MRI has failed to identify a clear surgical target [5]. Reoperation carries increased technical difficulty and a higher risk of iatrogenic hypopituitarism, underscoring the importance of accurate preoperative localization of corticotroph adenomas. Our case illustrates a potential novel added benefit of a trial of primary medical therapy in a patient with Cushing disease and equivocal or negative MRI findings at initial presentation. Specifically, we have shown how osilodrostat, a potent inhibitor of 11β-hydroxylase, can achieve rapid normalization of cortisol levels, consistent with the findings of the LINC (LCI699 [osilodrostat] in Cushing disease) series of studies [15-17], and at the same time help reveal the location of the occult microcorticotropinoma. An important consequence of achieving effective adrenal blockade in our patient was the more than threefold accompanying rise in plasma ACTH levels (Fig. 2). We hypothesized that such an increase in tumoral activity might facilitate its detection using molecular (functional) imaging. MET-PET has been shown in several studies to facilitate localization of de novo and recurrent corticotroph adenomas [81819] in a significant proportion of patients with equivocal or negative MRI findings. We have now shown that such an approach could potentially be enhanced by pretreatment with the potent 11β-hydroxylase inhibitor osilodrostat.

We also considered whether the rise in ACTH during osilodrostat therapy reflected increased tumor activity alone or was associated with a change in tumor size. In our case, ACTH rose significantly, likely reflecting enhanced secretory activity, whereas repeat conventional MRI remained stable, with no new abnormalities or interval changes. In the LINC 4 study, tumor volume data were available for 35 patients at both baseline and week 48. Among these, 40.0% had a ≥20% increase, 28.6% had a ≥20% decrease, and 31.4% had <20% change in tumor volume. These outcomes were observed in both microadenomas and macroadenomas, with no clear correlation to treatment duration or osilodrostat dose [20]. This variability suggests that osilodrostat does not exert a consistent effect on tumor volume.

Interestingly, although histopathological analysis did not confirm a corticotroph adenoma, this is a well-recognized finding and has been reported in a significant proportion of patients undergoing surgery for Cushing disease [2122]. Nonetheless, we consider the diagnosis of pituitary-dependent Cushing syndrome was clearly established by the clinical features, results of initial laboratory testing and findings at inferior petrosal sinus sampling (which demonstrated a clear central-to-peripheral ACTH gradient). In addition, abnormal tissue was identified intraoperatively at the site visualized on MET-PET and fully resected, and no other abnormal foci of tissue were seen. The patient has subsequently achieved complete and sustained clinical and biochemical remission, consistent with successful removal of an ACTH-secreting adenoma.

Recent case reports have raised concerns about prolonged adrenal insufficiency following extended osilodrostat use—an unexpected finding given the drug’s short half-life [23-25]. Although adrenal insufficiency requiring temporary glucocorticoid replacement had been reported in clinical trials (most commonly in patients undergoing rapid dose escalation [121516]), prolonged hypothalamopituitary-adrenal axis suppression resulting from supraphysiologic glucocorticoid replacement could also be contributory. For now, the exact mechanism of this observed phenomenon remains unclear. Our patient managed to wean glucocorticoid replacement postoperatively and did not demonstrate prolonged adrenal suppression; at the same time, clinical and biochemical testing confirmed full remission from Cushing disease.

This case supports the hypothesis that preoperative cortisol suppression may enhance the diagnostic accuracy of molecular (functional) imaging in Cushing disease, particularly in cases with inconclusive MRI findings. If validated in prospective studies, this approach could refine surgical planning and potentially lead to better surgical success and durable clinical outcomes.

Learning Points

  • Approximately 30% of corticotroph adenomas causing Cushing disease are not readily localized on conventional pituitary MRI.

  • Functional imaging modalities such as MET-PET/MRCR can improve detection of previously occult pituitary adenomas in Cushing disease.

  • A period of medical pretreatment with osilodrostat, with consequent reduction in negative feedback by glucocorticoid at the hypothalamic-pituitary level, may augment tumor localization by molecular imaging.

Acknowledgments

The authors acknowledge Debbie Papadopoulou and Niamh Martin for their contributions to clinical management. Nigel Mendoza performed the transsphenoidal surgery.

Contributors

All authors made individual contributions to authorship. Z.H., L.Y., J.M., M.G., and F.W. were involved in the diagnosis and management of this patient and manuscript submission. J.M., D.G., and M.G. performed and analyzed the patient’s functional imaging. All authors reviewed and approved the final draft.

Funding

No public or commercial funding

Disclosures

None declared.

Informed Patient Consent for Publication

Signed informed consent obtained directly from the patient.

Data Availability Statement

Original data generated and analyzed during this study are included in this published article.

This is an Open Access article distributed under the terms of the Creative Commons Attribution License (https://creativecommons.org/licenses/by/4.0/), which permits unrestricted reuse, distribution, and reproduction in any medium, provided the original work is properly cited. See the journal About page for additional terms.

Improved Noninvasive Diagnostic Evaluations in Treatment-Naïve Adrenocorticotropic Hormone (ACTH)-Dependent Cushing’s Syndrome

Abstract

Background

Bilateral inferior petrosal sinus sampling (BIPSS) is important in the differential diagnosis of adrenocorticotropic hormone (ACTH)-dependent Cushing’s syndrome, but BIPSS is invasive and is not reliable on tumor lateralization. Thus, we evaluated the noninvasive diagnostic evaluations, high-dose dexamethasone suppression test (HDDST) combined with different pituitary MRI scans (conventional contrast-enhanced MRI [cMRI], dynamic contrast-enhanced MRI [dMRI], and high-resolution contrast-enhanced MRI [hrMRI]), by comparison with BIPSS.

Methods

We retrospectively analyzed 95 patients with ACTH-dependent Cushing’s syndrome who underwent HDDST, preoperative MRI scans (cMRI, dMRI and hrMRI) and BIPSS in our hospital between January 2016 and December 2021. The diagnostic performance of HDDST combined with cMRI (HDDST + cMRI), HDDST + dMRI and HDDST + hrMRI, and BIPSS was evaluated, including the sensitivity of identifying pituitary adenomas and the tumor lateralization accuracy.

Results

Compared with BIPSS (AUC, 0.98; 95%CI: 0.93, 1.00), the diagnostic performance of HDDST + hrMRI was comparable in both neuroradiologist 1 (AUC, 0.95; 95%CI: 0.89, 0.99; P = 0.129) and neuroradiologist 2 (AUC, 0.98; 95%CI: 0.92, 1.00; P = 0.707). For tumor lateralization accuracy, HDDST + hrMRI (90.6-95.3%) were significantly higher than that of BIPSS (24.7%, P < 0.001).

Conclusions

In patients with ACTH-dependent Cushing’s syndrome, HDDST + hrMRI, as noninvasive diagnostic evaluations, achieves high diagnostic performance comparable with gold standard (BIPSS), and it is superior to BIPSS in terms of tumor lateralization accuracy.

Peer Review reports

Background

Cushing’s syndrome is associated with debilitating morbidity and increased mortality [1]. Adrenocorticotropic hormone (ACTH)-dependent Cushing’s syndrome is characterized by ACTH hypersecretion. Bilateral inferior petrosal sinus sampling (BIPSS) is regarded as the gold standard to distinguish pituitary ACTH secretion (also known as Cushing’s disease) from ectopic ACTH syndrome (EAS) [12]. However, BIPSS is invasive and is not reliable on tumor lateralization [34]. Thus, it is important to improve the diagnostic performance of noninvasive evaluations with high sensitivity and tumor lateralization accuracy.

Current noninvasive evaluations in the differential diagnosis of ACTH-dependent Cushing’s syndrome include high-dose dexamethasone suppression test (HDDST), the CRH stimulation test and pituitary MRI. However, due to the non-availability of CRH for testing, the sensitivities of current available noninvasive evaluations in identifying ACTH-secreting pituitary adenomas cannot satisfy the clinical needs. Conventional contrast-enhanced MRI (cMRI) and dynamic contrast-enhanced MRI (dMRI) with two-dimensional (2D) fast spin echo (FSE) sequence is routinely used, and only 50–66% of the ACTH-secreting pituitary adenomas can be correctly detected [56]. Recently, by using 3D spoiled gradient recalled (SPGR) sequence, high-resolution contrast-enhanced MRI (hrMRI) has increased the sensitivity to up to 80% [7,8,9]. However, these noninvasive evaluations are still inferior to BIPSS, the sensitivity and specificity of which is about 90–95% [10,11,12,13]. With the development of 3D FSE sequence, superior image quality with diminished artifact has been achieved, providing a reliable alternative to detect pituitary adenomas [14]. Previous studies have shown that hrMRI using 3D FSE sequence has high diagnostic performance for identifying pituitary adenomas [1516]. To our knowledge, no study has investigated the diagnostic performance of HDDST combined with hrMRI using 3D FSE sequence (HDDST + hrMRI) in patients with Cushing’s syndrome, and whether it can avoid unnecessary BIPSS procedure.

The aim of this study is to evaluate the diagnostic performance of HDDST + hrMRI by comparison with BIPSS in patients with ACTH-dependent Cushing’s syndrome.

Methods

This study was performed in line with the principles of the Declaration of Helsinki. Approval was granted by the Institutional Review Board of Peking Union Medical College Hospital. Informed consent was waived in this study because it was a retrospective, non-interventional, and observational study. Clinical trial number is not applicable.

Study design and patient population

We retrospectively reviewed the medical records and imaging studies from January 2016 to December 2021, and 232 consecutive patients with ACTH-dependent Cushing’s syndrome, who underwent HDDST, cMRI, dMRI, hrMRI and BIPSS, were enrolled in the current study. A total of 137 patients were excluded from the study because of prior pituitary surgery (n = 122) or lack of histopathology due to no pituitary surgery in our hospital (n = 15). Finally, 95 patients were included in the current study (Fig. 1) and all the patients included were confirmed by histopathology or by clinical remission after surgical resection of the ACTH-secreting lesion. In the current study, all the patients with Cushing’s disease achieved clinical remission after surgical resection of the ACTH-secreting lesion. All the patients with EAS underwent contrast-enhanced thoracic and abdominal CT to identify the ACTH-secreting lesion. The clinical decision-making process was consistent with the previous study [1].

Fig. 1
figure 1

Flowchart of patient inclusion/exclusion process. ACTH = adrenocorticotropic hormone, BIPSS = bilateral inferior petrosal sinus sampling; cMRI = conventional contrast-enhanced MRI, dMRI = dynamic enhanced MRI, HDDST = high-dose dexamethasone suppression test, hrMRI = high-resolution contrast-enhanced MRI, NPV = negative predictive value, PPV = positive predictive value

HDDST

As previously described [17], the average 24-hour urinary free cortisol (24hUFC) level of 2 days before HDDST was recorded as baseline. Then, 2 mg dexamethasone was administered orally every 6 h for 2 days, and the 24hUFC level of the second day was measured. When the ratio of 24hUFC on the second day after HDDST to 24hUFC at baseline was less than 50%, the suppression in HDDST was marked as positive in the current study.

BIPSS

BIPSS was performed according to Doppman et al. [18]. Blood samples were collected from peripheral veins and bilateral inferior petrosal sinuses (IPSs) at multiple time points (0, 3, 5 and 10 min) after the introduction of 10 µg desmopressin [19]. An IPS to peripheral ACTH ratio of ≥ 2.0 at baseline or ≥ 3.0 after desmopressin stimulation at any time point [20] was marked as positive in the current study. Furthermore, tumor lateralization was predicted by an intersinus ratio of ≥ 1.4 [20].

Imaging

All the images were acquired on a 3.0 Tesla MR scanner (Discovery MR750w, GE Healthcare) using an 8-channel head coil. Detailed acquisition parameters and sequence order before and after contrast injection (gadopentetate dimeglumine [Gd-DTPA] at 0.05 mmol/kg [0.1 mL/kg] with a flow rate of 2 mL/s followed by a 10-mL saline solution flush) were as follows: coronal 2D FSE T2WI (field of view [FOV] = 20 cm × 20 cm, slice thickness = 4 mm, slice spacing = 1 mm, repetition time/echo time [TR/TE] = 4100/90 ms, number of excitation [NEX] = 1.2, matrix = 320 × 320, scan time = 49s), coronal 2D FSE T1WI (FOV = 18 cm × 16.2 cm, slice thickness = 3 mm, slice spacing = 0.6 mm, TR/TE = 400/12 ms, NEX = 2, matrix = 256 × 192, scan time = 49s), sagittal fat-saturated 3D FSE T1WI (FOV = 16.5 cm × 16.5 cm, slice thickness = 3 mm, slice spacing = 0, TR/TE = 460/16 ms, NEX = 2, matrix = 256 × 224, scan time = 60s), dynamic contrast-enhanced coronal 2D FSE T1WI (FOV = 19 cm × 17.1 cm, slice thickness = 2 mm, slice spacing = 0.5 mm, TR/TE = 375/14 ms, NEX = 1, matrix = 288 × 192, scan time = 23s/phase × 6 phases), contrast-enhanced coronal 2D FSE T1WI, contrast-enhanced sagittal fat-saturated 3D FSE T1WI, and contrast-enhanced coronal fat-saturated 3D FSE T1WI (FOV = 15.2 cm × 15.2 cm, slice thickness = 1.2 mm, slice spacing = -0.6 mm, TR/TE = 390/15 ms, NEX = 6, matrix = 256 × 256, scan time = 4 min 30s).

Images were independently evaluated by two experienced neuroradiologists (with 25 and 16 years of experience in neuroradiology, respectively). Both neuroradiologists were blinded to the clinical information of the patients. The image order of cMRI, dMRI and hrMRI was randomized. The detection of pituitary adenomas was scored using a 3-point scale (0 = poor, 1 = fair, 2 = excellent). Scores of 1 or 2 represented a successful pituitary adenoma detection. The gold standard was the histopathology, and the diameter and the location of lesions were recorded on the sequence where identified.

The signal-to-noise ratio (SNR) and contrast-to-noise ratio (CNR) were calculated as follows: SNR = SIadenoma / SDbackground, CNR = |SIpituitary – SIadenoma| / SDbackground. SIpituitary and SIadenoma were defined as the mean signal intensity of the pituitary gland and the pituitary adenoma, respectively. SDbackground was defined as the standard deviation of the signal intensity of the background. CNR was recorded as 0 when no pituitary adenoma was identified. Figure 2 showed the calculation of SNR and CNR using an operator defined region of interest.

Fig. 2

figure 2

The calculation of SNR and CNR using an operator defined region of interest. CNR = contrast-to-noise ratio, SD = standard deviation, SI = signal intensity, SNR = signal-to-noise ratio

Statistical analysis

The κ analysis was conducted to assess the interobserver agreements. The κ value was interpreted as follows: below 0.20, slight agreement; 0.21–0.40, fair agreement; 0.41–0.60, moderate agreement; 0.61–0.80, substantial agreement; greater than 0.80, almost perfect agreement.

To assess the diagnostic performance of different evaluations, the receiver operating characteristic curves were plotted and the area under curves (AUCs) were compared between noninvasive and invasive evaluations for each neuroradiologist by using the DeLong test. Sensitivity, specificity, positive predictive value, and negative predictive value were calculated. The Friedman’s test was used to evaluate the SNR and CNR measurements as well as conspicuity scores of pituitary adenomas between MR protocols, and the Wilcoxon signed-rank test was used for pairwise comparison. The McNemar’s test was used to evaluate the tumor lateralization accuracy. A P value of less than 0.05 was considered statistically significant. A stricter P value of less than 0.017 was considered statistically significant after Bonferroni correction. Statistical analysis was performed using MedCalc Statistical Software (version 23.0.2) and SPSS Statistics (version 22.0).

Results

Clinical characteristics

The clinical characteristics of the 95 patients with Cushing’s syndrome were shown in Table 1. There were 85 patients (median age, 38 years; interquartile range [IQR], 29–51 years; 55 females [65%]) with Cushing’s disease and 10 patients (median age, 39 years; IQR, 30–47 years; 5 females [50%]) with EAS. Of the 85 patients with Cushing’s disease, the median diameter of pituitary adenomas was 5 mm (IQR, 4–5 mm), ranging from 3 to 28 mm. Among them, 80 patients had microadenomas (less than 10 mm in size). Of the ten patients with EAS, one patient had an ovarian carcinoid tumor found by abdominal CT, others had pulmonary carcinoid tumors found by thoracic CT as the cause of Cushing’s syndrome. None of the patients with EAS had a lesion in the pituitary.

Table 1 Clinical characteristics of the patients

Diagnostic performance noninvasive and invasive evaluations

The inter-observer agreements between two neuroradiologists were moderate on cMRI (κ = 0.597), moderate on dMRI (κ = 0.595), and almost perfect on hrMRI (κ = 0.850), respectively.

The diagnostic performance of noninvasive and invasive evaluations was shown in Table 2. Compared with BIPSS (AUC, 0.98; 95%CI: 0.93, 1.00), the diagnostic performance of HDDST + hrMRI was comparable in both neuroradiologist 1 (AUC, 0.95; 95%CI: 0.89, 0.99; P = 0.129) and neuroradiologist 2 (AUC, 0.98; 95%CI: 0.92, 1.00; P = 0.707). However, the diagnostic performance of HDDST + cMRI and HDDST + dMRI was inferior to BIPSS (P ≤ 0.001 for all). No difference was found between HDDST + cMRI and HDDST + dMRI in neuroradiologist 1 (P = 0.050) and neuroradiologist 2 (P = 0.353).

Table 2 The diagnostic performance of noninvasive and invasive evaluations

Figures 3 and 4 showed that microadenomas were correctly diagnosed on hrMRI, but missed on cMRI or dMRI.

Fig. 3

figure 3

Images in a patient with Cushing’s disease. The lesion is missed on (a) coronal contrast-enhanced T1-weighted image and (b) coronal dynamic contrast-enhanced T1-weighted image obtained with two-dimensional (2D) fast spin echo (FSE) sequence. (c) Coronal contrast-enhanced T1-weighted image on high-resolution MRI obtained with 3D FSE sequence shows a round pituitary microadenoma measuring approximately 4 mm with delayed enhancement on the left side of the pituitary gland

Fig. 4

figure 4

Images in a patient with Cushing’s disease. The lesion is missed on (a) coronal contrast-enhanced T1-weighted image and (b) coronal dynamic contrast-enhanced T1-weighted image obtained with two-dimensional (2D) fast spin echo (FSE) sequence. (c) Coronal contrast-enhanced T1-weighted image on high-resolution MRI obtained with 3D FSE sequence shows a round pituitary microadenoma measuring approximately 5 mm with delayed enhancement on the left side of the pituitary gland

Further, subgroup analysis was conducted in 85 patients with Cushing’s disease. The conspicuity scores of pituitary adenomas on cMRI, dMRI and hrMRI were shown in Table 3. Significant differences between three MR protocols were found in neuroradiologist 1 and neuroradiologist 2 (P < 0.001 for both). Pairwise comparison showed no difference between cMRI and dMRI in neuroradiologist 1 (P = 0.732) and neuroradiologist 2 (P = 0.130). However, hrMRI had significantly higher scores than cMRI and dMRI in neuroradiologist 1 and neuroradiologist 2 (P < 0.001 for all). The SNR on cMRI, dMRI and hrMRI were 64.8 (IQR, 50.8–97.0), 42.4 (IQR, 30.2–57.0) and 65.1 (IQR, 51.9–92.4), respectively. The SNR on cMRI and hrMRI were similar (P = 0.759), but they were higher than that of dMRI (P < 0.001 for both). The CNR on cMRI, dMRI and hrMRI were27.0 (IQR, 17.8–43.8), 26.4 (IQR, 17.7–37.5), and 29.7 (IQR, 21.1–45.1), respectively. The CNR were comparable (P = 0.159).

Table 3 Conspicuity scores of pituitary adenomas on MRI

The comparison of tumor lateralization accuracy was shown in Table 4. Because HDDST has no role to identify the tumor lateralization, the tumor lateralization of noninvasive evaluations was only based on MRI. The sensitivity of BIPSS was 96.5% (82/85), comparable to those of hrMRI in neuroradiologist 1 (90.6%, P = 0.227) and neuroradiologist 2 (95.3%, P > 0.99). However, for tumor lateralization accuracy, 36 patients had BIPSS lateralization predicted by an intersinus ratio of ≥ 1.4 [20], and 21 patients had BIPSS lateralization that were concordant in laterality with surgery. The tumor lateralization accuracy was 58.3% (21/36).

Table 4 Tumor lateralization accuracy comparison

In the whole population, the tumor lateralization accuracy of BIPSS in total was 24.7% (21/85), which is significantly lower than those of hrMRI in neuroradiologist 1 (90.6%, P < 0.001) and neuroradiologist 2 (95.3%, P < 0.001).

Discussion

In patients with ACTH-dependent Cushing’s syndrome, it is crucial but challenging to distinguish pituitary secretion from ectopic ACTH secretion. In the current study, the diagnostic performance of noninvasive evaluations, HDDST + hrMRI, is comparable to BIPSS. Moreover, it is superior to BIPSS in terms of tumor lateralization.

No consensus agreement has been made that whether BIPSS should be performed in all the patients with suspected Cushing’s disease, although BIPSS is the gold standard with high sensitivity and specificity, which is about 90–95% [10,11,12,13]. On the one hand, about 10–40% of the population harbor nonfunctioning pituitary adenomas [1321], which may lead to false-positive results without centralizing BIPSS results. On the other hand, BIPSS is invasive and is not reliable on tumor lateralization. BIPSS will be bypassed when the tumor is greater than 6 mm in pituitary MRI and the patient has a classical presentation and dynamic biochemical results consistent with Cushing’s disease [13].

Noninvasive evaluations have comparable sensitivity to BIPSS for identifying pituitary adenomas in patients with Cushing’s disease. With the development of MRI technology, 3D FSE sequence provides a reliable alternative to detect pituitary adenomas [14]. The 3D FSE sequence overcomes the disadvantages of 3D SPGR sequence, such as bright blood and magnetic susceptibility [2223]. By using black blood in 3D FSE sequence, an obvious contrast between the pituitary and the cavernous sinus can be observed. By using fat saturation after enhancement, the hyperintensity of adjacent fat-containing tissue can be suppressed. All these mentioned above can facilitating the identification of pituitary adenomas. The sensitivity of hrMRI using 3D FSE sequence ranges from 87.7 to 93.8%, depending on radiologists with different experience levels [16]. Compared with traditional 2D FSE sequence acquiring images with 2- to 3-mm slice thickness, hrMRI using 3D FSE sequence acquiring images with 1.2-mm slice thickness can dramatically reduce the partial volume averaging effect, improving the identification of the microadenomas [15]. The trade-off between spatial resolution and image noise is challenging in pituitary MRI [24]. Previous studies have proved that hrMRI has high signal-to-noise ratio and contrast-to-noise ratio [1516], and sufficient contrast between pituitary adenomas and the pituitary gland could help to improve the identification of pituitary adenomas. In the current study, the conspicuity scores of hrMRI are significantly higher than those of cMRI and dMRI, supporting that hrMRI is reliable on identifying pituitary lesions. Besides, the diagnosis of Cushing’s disease cannot be made depending on the results of hrMRI alone. Given that there is a population with accidental adenomas when imaging, most of which are nonfunctioning pituitary adenomas, the results of HDDST will help rule out. In the current study, all the patients who underwent surgery had positive histopathology results, which means that no pituitary incidentalomas were found in this population. This might be caused by the relatively small sample size. Eighty patients with Cushing’s disease have microadenomas, and the median diameter at surgery is about 5 mm, consistent with previous studies [2526]. All these mentioned above makes it more difficult to identify the lesions in the current study. However, the sensitivity of HDDST + hrMRI in the current study is up to 95.3%, comparable to the gold standard.

Noninvasive evaluations have significantly higher tumor lateralization accuracy than BIPSS. According to the guideline, surgery is the first-line treatment [3]. Precise location of the pituitary adenoma before surgery can dramatically improve the postoperative remission rate [27]. However, the tumor lateralization accuracy of BIPSS, less than 80% in previous studies [192829], cannot satisfy the clinical need. According to previous studies, the cut-off value for tumor lateralization was set as an intersinus ratio of ≥ 1.4 [20], and the accuracy of lateralization by BIPSS ranged from 48.0 to 78.7% [192829]. In the current study, 36 patients had BIPSS lateralization and 21 patients had BIPSS lateralization that were concordant in laterality with surgery. The tumor lateralization accuracy was 58.3%, consistent with previous studies [192829]. However, the aim of our study is to evaluate the diagnostic performance of BIPSS in all the patients underwent BIPSS, therefore, the tumor lateralization accuracy of BIPSS in total was only 24.7% (21/85). In our study, many patients have positive BIPSS results with an intersinus ratio of < 1.4, resulting in the low tumor lateralization accuracy of BIPSS. One possible reason might be that desmopressin is not so effective. Another possible reason for low tumor lateralization accuracy of BIPSS is that IPSs have considerable anatomy variations. A previous study suggests that BIPSS results are much improved when venous drainage is symmetric [30]. Patients with asymmetric IPSs have dominant venous drainage, and when the dominant side of venous drainage is discordant with the side of the lesion, BIPSS will fail in tumor lateralization [30]. Failure in tumor lateralization will result in multiple incisions into the pituitary in search of adenoma or hemi- or subtotal hypophysectomy, increasing the risk of complications and reducing the remission rate [31]. In total, only 24.7% of the patients have a BIPSS lateralization that were concordant in laterality with surgery, whereas the tumor lateralization accuracy of HDDST + hrMRI is superior to BIPSS with statistical significance.

Limitations of the study included its retrospective nature. The bias may be introduced during the patient inclusion/exclusion process. Patients lack of any of preoperative MRI scans, HDDST, or BIPSS have not been included in the current study. Some patients will bypass hrMRI as well as BIPSS when they have obvious pituitary adenomas on cMRI and dMRI. The diagnostic performance of these evaluations might be better with the inclusion of these patients. Second, the sample size in our current study is relatively small. Because this is a single institutional study and Cushing’s syndrome is a rare disease. The relatively small sample size may limit the conclusions regarding the diagnostic performance of hrMRI for differentiating ectopic from pituitary sources of ACTH. A larger population from multicenter is needed for future study. Besides, a large portion of patients with prior pituitary surgery have been excluded. The imaging findings of these patients are more complicated and hrMRI may show more advantages than routine sequences in this population.

Conclusions

In conclusion, as noninvasive diagnostic evaluations, HDDST + hrMRI achieves high diagnostic performance comparable with gold standard (BIPSS), and it is superior to BIPSS in terms of tumor lateralization accuracy in patients with ACTH-dependent Cushing’s syndrome.

Data availability

The datasets used and analyzed during the current study are available from the corresponding author upon reasonable request.

Abbreviations

24hUFC:
24-hour urinary free cortisol
2D:
Two-dimensional
3D:
Three-dimensional
ACTH:
Adrenocorticotropic hormone
AUC:
Area under curve
BIPSS:
Bilateral inferior petrosal sinus sampling
cMRI:
Contrast-enhanced MRI
CNR:
Contrast-to-noise ratio
dMRI:
Dynamic contrast-enhanced MRI
EAS:
Ectopic adrenocorticotropic hormone syndrome
FSE:
Fast spin echo
HDDST:
High-dose dexamethasone suppression test
hrMRI:
High-resolution contrast-enhanced MRI
IPS:
Inferior petrosal sinus
IQR:
Interquartile range
SNR:
Signal-to-noise ratio
SPGR:
Spoiled gradient recalled

References

  1. Lacroix A, Feelders RA, Stratakis CA, Nieman LK. Cushing’s syndrome. Lancet (London England). 2015;386(9996):913–27.

    Article CAS PubMed Google Scholar

  2. Loriaux DL. Diagnosis and differential diagnosis of cushing’s syndrome. N Engl J Med. 2017;376(15):1451–9.

    Article CAS PubMed Google Scholar

  3. Nieman LK, Biller BM, Findling JW, Murad MH, Newell-Price J, Savage MO, et al. Treatment of cushing’s syndrome: an endocrine society clinical practice guideline. J Clin Endocrinol Metab. 2015;100(8):2807–31.

    Article CAS PubMed PubMed Central Google Scholar

  4. Wind JJ, Lonser RR, Nieman LK, DeVroom HL, Chang R, Oldfield EH. The lateralization accuracy of inferior petrosal sinus sampling in 501 patients with cushing’s disease. J Clin Endocrinol Metab. 2013;98(6):2285–93.

    Article CAS PubMed PubMed Central Google Scholar

  5. Boscaro M, Arnaldi G. Approach to the patient with possible cushing’s syndrome. J Clin Endocrinol Metab. 2009;94(9):3121–31.

    Article CAS PubMed Google Scholar

  6. Kasaliwal R, Sankhe SS, Lila AR, Budyal SR, Jagtap VS, Sarathi V, et al. Volume interpolated 3D-spoiled gradient echo sequence is better than dynamic contrast spin echo sequence for MRI detection of Corticotropin secreting pituitary microadenomas. Clin Endocrinol (Oxf). 2013;78(6):825–30.

    Article CAS PubMed Google Scholar

  7. Grober Y, Grober H, Wintermark M, Jane JA, Oldfield EH. Comparison of MRI techniques for detecting microadenomas in cushing’s disease. J Neurosurg. 2018;128(4):1051–7.

    Article PubMed Google Scholar

  8. Fukuhara N, Inoshita N, Yamaguchi-Okada M, Tatsushima K, Takeshita A, Ito J, et al. Outcomes of three-Tesla magnetic resonance imaging for the identification of pituitary adenoma in patients with cushing’s disease. Endocr J. 2019;66(3):259–64.

    Article PubMed Google Scholar

  9. Patronas N, Bulakbasi N, Stratakis CA, Lafferty A, Oldfield EH, Doppman J, Nieman LK. Spoiled gradient recalled acquisition in the steady state technique is superior to conventional Postcontrast spin echo technique for magnetic resonance imaging detection of adrenocorticotropin-secreting pituitary tumors. J Clin Endocrinol Metab. 2003;88(4):1565–9.

    Article CAS PubMed Google Scholar

  10. Pecori Giraldi F, Cavallo LM, Tortora F, Pivonello R, Colao A, Cappabianca P, et al. The role of inferior petrosal sinus sampling in ACTH-dependent cushing’s syndrome: review and joint opinion statement by members of the Italian society for endocrinology, Italian society for neurosurgery, and Italian society for neuroradiology. NeuroSurg Focus. 2015;38(2):E5.

    Article PubMed Google Scholar

  11. Biller BM, Grossman AB, Stewart PM, Melmed S, Bertagna X, Bertherat J, et al. Treatment of adrenocorticotropin-dependent cushing’s syndrome: a consensus statement. J Clin Endocrinol Metab. 2008;93(7):2454–62.

    Article CAS PubMed PubMed Central Google Scholar

  12. Newell-Price J, Bertagna X, Grossman AB, Nieman LK. Cushing’s syndrome. Lancet (London England). 2006;367(9522):1605–17.

    Article CAS PubMed Google Scholar

  13. Arnaldi G, Angeli A, Atkinson AB, Bertagna X, Cavagnini F, Chrousos GP, et al. Diagnosis and complications of cushing’s syndrome: a consensus statement. J Clin Endocrinol Metab. 2003;88(12):5593–602.

    Article CAS PubMed Google Scholar

  14. Sartoretti T, Sartoretti E, Wyss M, Schwenk A, van Smoorenburg L, Eichenberger B, et al. Compressed SENSE accelerated 3D T1w black blood turbo spin echo versus 2D T1w turbo spin echo sequence in pituitary magnetic resonance imaging. Eur J Radiol. 2019;120:108667.

    Article PubMed Google Scholar

  15. Liu Z, Hou B, You H, Lu L, Duan L, Li M, et al. High-resolution contrast-enhanced MRI with three-dimensional fast spin echo improved the diagnostic performance for identifying pituitary microadenomas in cushing’s syndrome. Eur Radiol. 2023;33(9):5984–92.

    Article PubMed PubMed Central Google Scholar

  16. Liu Z, Hou B, You H, Lu L, Duan L, Li M, et al. Three-Dimensional fast spin echo pituitary MRI in Treatment-Naive cushing’s disease: reduced impact of reader experience and increased diagnostic accuracy. J Magn Reson Imaging. 2024;59(6):2115–23.

    Article PubMed Google Scholar

  17. Liu Z, Zhang X, Wang Z, You H, Li M, Feng F, Jin Z. High positive predictive value of the combined pituitary dynamic enhanced MRI and high-dose dexamethasone suppression tests in the diagnosis of cushing’s disease bypassing bilateral inferior petrosal sinus sampling. Sci Rep. 2020;10(1):14694.

    Article CAS PubMed PubMed Central Google Scholar

  18. Doppman JL, Oldfield E, Krudy AG, Chrousos GP, Schulte HM, Schaaf M, Loriaux DL. Petrosal sinus sampling for Cushing syndrome: anatomical and technical considerations. Work in progress. Radiology. 1984;150(1):99–103.

    Article CAS PubMed Google Scholar

  19. Machado MC, de Sa SV, Domenice S, Fragoso MC, Puglia P Jr., Pereira MA, et al. The role of Desmopressin in bilateral and simultaneous inferior petrosal sinus sampling for differential diagnosis of ACTH-dependent cushing’s syndrome. Clin Endocrinol (Oxf). 2007;66(1):136–42.

    Article CAS PubMed Google Scholar

  20. Oldfield EH, Doppman JL, Nieman LK, Chrousos GP, Miller DL, Katz DA, et al. Petrosal sinus sampling with and without corticotropin-releasing hormone for the differential diagnosis of cushing’s syndrome. N Engl J Med. 1991;325(13):897–905.

    Article CAS PubMed Google Scholar

  21. Chong BW, Kucharczyk W, Singer W, George S. Pituitary gland MR: a comparative study of healthy volunteers and patients with microadenomas. AJNR Am J Neuroradiol. 1994;15(4):675–9.

    CAS PubMed PubMed Central Google Scholar

  22. Lien RJ, Corcuera-Solano I, Pawha PS, Naidich TP, Tanenbaum LN. Three-Tesla imaging of the pituitary and parasellar region: T1-weighted 3-dimensional fast spin echo cube outperforms conventional 2-dimensional magnetic resonance imaging. J Comput Assist Tomogr. 2015;39(3):329–33.

    PubMed Google Scholar

  23. Kakite S, Fujii S, Kurosaki M, Kanasaki Y, Matsusue E, Kaminou T, Ogawa T. Three-dimensional gradient echo versus spin echo sequence in contrast-enhanced imaging of the pituitary gland at 3T. Eur J Radiol. 2011;79(1):108–12.

    Article PubMed Google Scholar

  24. Kim M, Kim HS, Kim HJ, Park JE, Park SY, Kim YH, et al. Thin-Slice pituitary MRI with deep Learning-based reconstruction: diagnostic performance in a postoperative setting. Radiology. 2021;298(1):114–22.

    Article PubMed Google Scholar

  25. Vitale G, Tortora F, Baldelli R, Cocchiara F, Paragliola RM, Sbardella E, et al. Pituitary magnetic resonance imaging in cushing’s disease. Endocrine. 2017;55(3):691–6.

    Article CAS PubMed Google Scholar

  26. Jagannathan J, Smith R, DeVroom HL, Vortmeyer AO, Stratakis CA, Nieman LK, Oldfield EH. Outcome of using the histological pseudocapsule as a surgical capsule in Cushing disease. J Neurosurg. 2009;111(3):531–9.

    Article PubMed PubMed Central Google Scholar

  27. Yamada S, Fukuhara N, Nishioka H, Takeshita A, Inoshita N, Ito J, Takeuchi Y. Surgical management and outcomes in patients with Cushing disease with negative pituitary magnetic resonance imaging. World Neurosurg. 2012;77(3–4):525–32.

    Article PubMed Google Scholar

  28. Deipolyi A, Bailin A, Hirsch JA, Walker TG, Oklu R. Bilateral inferior petrosal sinus sampling: experience in 327 patients. J Neurointerv Surg. 2017;9(2):196–9.

    Article PubMed Google Scholar

  29. Castinetti F, Morange I, Dufour H, Jaquet P, Conte-Devolx B, Girard N, Brue T. Desmopressin test during petrosal sinus sampling: a valuable tool to discriminate pituitary or ectopic ACTH-dependent cushing’s syndrome. Eur J Endocrinol. 2007;157(3):271–7.

    Article CAS PubMed Google Scholar

  30. Lefournier V, Martinie M, Vasdev A, Bessou P, Passagia JG, Labat-Moleur F, et al. Accuracy of bilateral inferior petrosal or cavernous sinuses sampling in predicting the lateralization of cushing’s disease pituitary microadenoma: influence of catheter position and anatomy of venous drainage. J Clin Endocrinol Metab. 2003;88(1):196–203.

    Article CAS PubMed Google Scholar

  31. Castle-Kirszbaum M, Amukotuwa S, Fuller P, Goldschlager T, Gonzalvo A, Kam J, et al. MRI for Cushing disease: A systematic review. AJNR Am J Neuroradiol. 2023;44(3):311–6.

    Article CAS PubMed PubMed Central Google Scholar

Download references

Acknowledgements

We thank Dr. Kai Sun, Medical Research Center, Peking Union Medical College Hospital, for his guidance on the statistical analysis in this study. We thank all the patients who participated in this study.

Funding

This study was supported by the National Natural Science Foundation of China (grants 82371946 and 82071899), the Chinese Academy of Medical Sciences Innovation Fund for Medical Sciences (grant 2021-I2M-1-025), and the National High Level Hospital Clinical Research Funding (grants 2022-PUMCH-B-067 and 2022-PUMCH-B-114). The funding played no role in the design of the study and collection, analysis, and interpretation of data and in writing the manuscript.

Author information

Authors and Affiliations

  1. Department of Radiology, Peking Union Medical College Hospital, Chinese Academe of Medical Sciences and Peking Union Medical College, No.1 Shuaifuyuan Wangfujing Dongcheng Distinct, Beijing, 100730, China

    Zeyu Liu, Bo Hou, Hui You, Mingli Li & Feng Feng

  2. Department of Endocrinology, Peking Union Medical College Hospital, Chinese Academe of Medical Sciences and Peking Union Medical College, No.1 Shuaifuyuan Wangfujing Dongcheng Distinct, Beijing, 100730, China

    Lin Lu, Lian Duan & Huijuan Zhu

  3. Department of Neurosurgery, Peking Union Medical College Hospital, Chinese Academe of Medical Sciences and Peking Union Medical College, No.1 Shuaifuyuan Wangfujing Dongcheng Distinct, Beijing, 100730, China

    Kan Deng & Yong Yao

  4. State Key Laboratory of Complex Severe and Rare Disease, Peking Union Medical College Hospital, Chinese Academe of Medical Sciences and Peking Union Medical College, No.1 Shuaifuyuan Wangfujing Dongcheng Distinct, Beijing, 100730, China

    Yong Yao, Huijuan Zhu & Feng Feng

Contributions

All authors have participated sufficiently in this submission to take public responsibility for its content. H.Y. and F.F. proposed research ideas, revised the paper, and reviewed it academically. B.H. and Z.L. were responsible for literature review, data analysis and writing the manuscript. M.L. revised the paper. L.L., L.D. and H.Z. collected the clinical data. K.D. and Y.Y. collected the surgical and histopathology data. All authors reviewed the manuscript.

Corresponding authors

Correspondence to Hui You or Feng Feng.

Ethics declarations

Ethics approval and consent to participate

This study was performed in line with the principles of the Declaration of Helsinki. Approval was granted by the Institutional Review Board of Peking Union Medical College Hospital. Informed consent was waived by Institutional Review Board of Peking Union Medical College Hospital, because it was a retrospective, non-interventional, and observational study.

Consent for publication

Not applicable.

Competing interests

The authors declare no competing interests.

Additional information

Publisher’s note

Springer Nature remains neutral with regard to jurisdictional claims in published maps and institutional affiliations.

About this article

Cite this article

Liu, Z., Hou, B., You, H. et al. Improved noninvasive diagnostic evaluations in treatment-naïve adrenocorticotropic hormone (ACTH)-dependent Cushing’s syndrome. BMC Med Imaging 25, 252 (2025). https://doi.org/10.1186/s12880-025-01786-y

Download citation

https://bmcmedimaging.biomedcentral.com/articles/10.1186/s12880-025-01786-y